有線SLEダッシュボード
まずは、有線サービスレベルエクスペリエンス(SLE)ダッシュボードを使用して、スループット、接続性、スイッチの状態などのユーザーに影響を与える要因のサービスレベルを評価します。
™ クラウドJuniper Mist継続的にネットワークテレメトリデータを収集し、機械学習(ML)を使用してエンドユーザーエクスペリエンスを分析します。このサービスは、ポートが数百または数千であるかに関係なく、ネットワーク全体でデータを効率的に収集および分析します。
有線のSLE(サービスレベル期待値)Juniper Mistダッシュボードからこの情報にアクセスでき、ネットワークのユーザーエクスペリエンスを評価し、問題を事前に解決するのに役立ちます。単にデバイスやリンクの稼働状況ではなく、クライアントエクスペリエンスの品質も重要です。
有線ネットワークでは、次の2つの課題があります。
-
クライアントは接続できますか?
-
クライアントは接続後にトラフィックを渡すことができますか?
有線SLEダッシュボードには、任意の時点におけるネットワーク上の有線クライアントのユーザーエクスペリエンスが表示されます。これらのインタラクティブなダッシュボードを使用して、大きな問題になる前にユーザーの問題点を特定し、ネットワークを事前に測定および管理できます。
有線SLEダッシュボードの検索
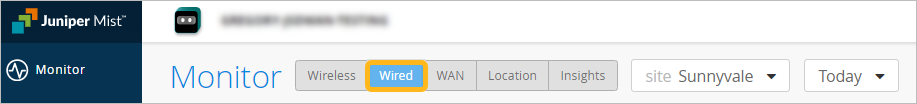
有線SLEダッシュボードを見つけるには、左側のメニューから サービスレベルの監視>選択し、有線 ボタンをクリックします。
ボタンは、必要なサブスクリプションがある場合にのみ表示されます。これらの要件については、 Juniper Mist AIネイティブ運用ガイドをご覧ください。
Wired Assurance:Day 2 - 有線SLEのビデオ概要
One of the coolest features of Wired Assurance is the Service Level Expectations, or SLEs. SLEs were first introduced with Wi-Fi Assurance to help you understand the client experience. Now the SLE framework has been extended to Juniper EX switches.
You can see what the performance and experience for wired devices is, categorized into throughput, successful connect, and switch health. In the throughput SLE, there are classifiers, congestion, interface anomalies, storm control, etc. This is where you can drill down to get an accurate sense of what is going on in the network.
The distribution table breaks it down by clients, VLANs, interfaces, and switches. You can also sort by failure rate or biggest overall impact. Double-click into affected items by switches, VLANs, interfaces, and clients.
Going over to the switch health SLE, we immediately see there are CPU issues. The EX4300 shows the overall impact at 74%. The screen shows CPU utilization spiking over 100%, mapped to a time graph to help you narrow in on the issue.
Wired SLEs measure wired experience with pre and post-connection performance metrics to help you understand how the network experience is for your users, wired devices, and IoT endpoints.
有線SLEダッシュボードの使用
SLEの概要については、 サービスレベル期待値(SLE)を参照してください。
有線SLEと分類子の解釈については、この章のその他の有線SLEトピックを参照してください。