How to Monitor Incidents
Use the Incidents page to view all incidents related to an endpoint in a user timeline view. To access the Incidents page, select Monitor > Insights > Incidents.
There are two ways to view your data. You can select either the Grid view or the Plot view. By default, the data is displayed in Grid view. In the Timeline section, you can select a log parser from the list to view log data in the timeline graph. You can zoom in, zoom out, show all data, and refresh the data.
Grid View
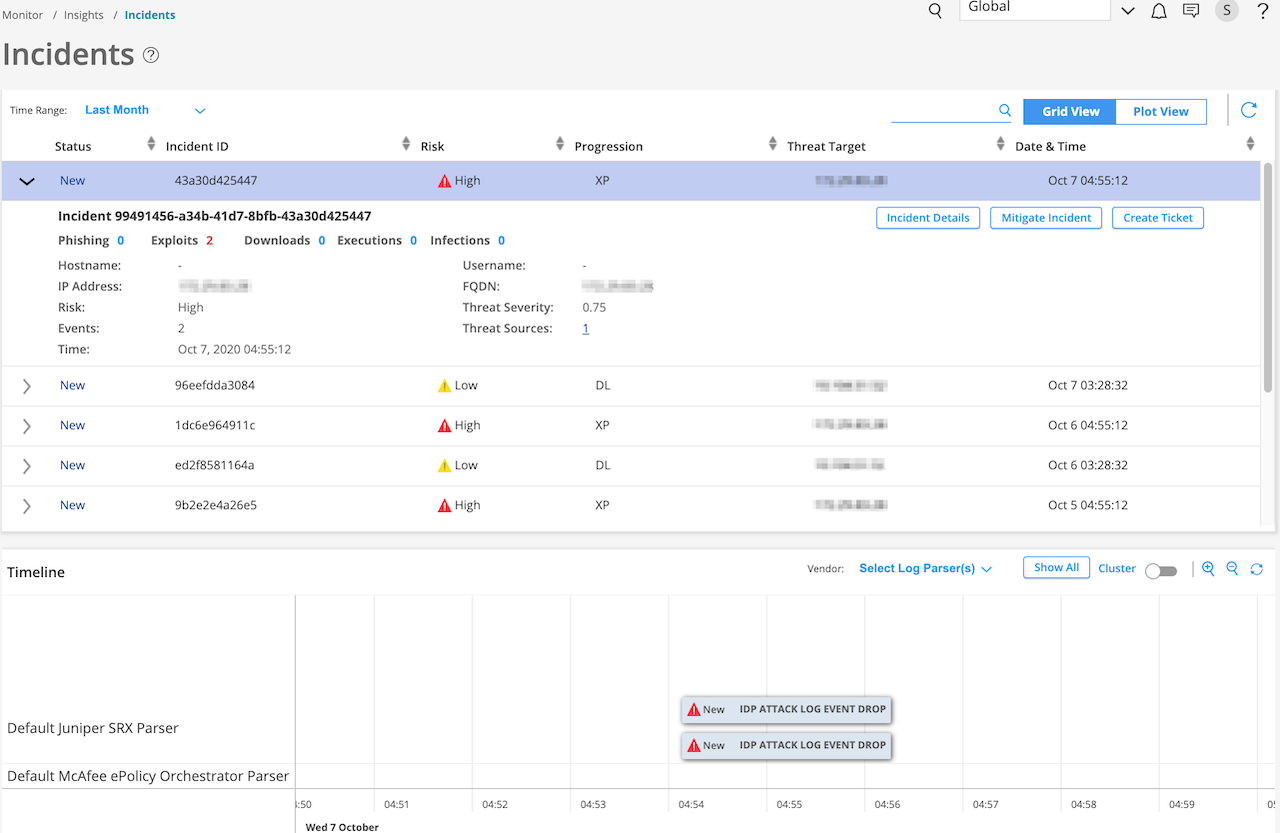
Click Grid View for a comprehensive details about incidents. You can view the incident ID, state of the incident, progression, and so on. You can expand an incident to view more details and create ServiceNow tickets if required, as shown in Figure 1.
After you create a ticket, the status of the incident changes to Acknowledged, as shown in Figure 2
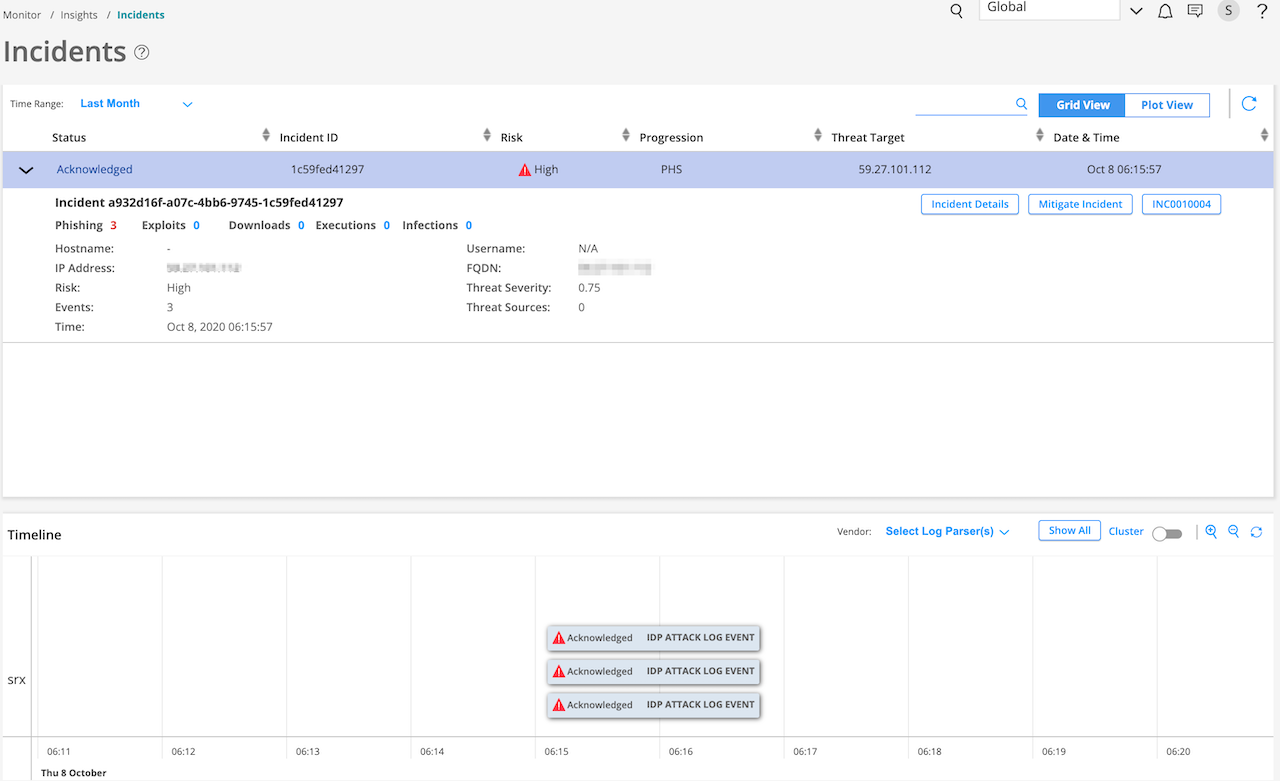
Table 1 describes different fields available in this view. You can view data for a custom time range, last 24 hours, last week, last month, and last year.
Table 1: Fields on the Grid View Page
Field Name | Description |
|---|---|
Status | Specifies the status of the ServiceNow ticket. After you create a ServiceNow ticket, the status shows Acknowledged, as shown in Figure 2. |
Incident ID | Specifies the incident ID. |
Risk | Specifies the threat metric and severity rating. |
Progression | Specifies the progression of an incident |
Threat Target | Specifies the IP address of the targeted host. |
Date & Time | Specifies the timestamp of the incident. |
In the Status column, click > to see additional details (apart from details provided in Table 1) about an incident, such as:
Hostname—If Juniper Identity Management Service (JIMS) is configured, the hostname is shown.
Username—If JIMS is configured, the username is shown.
IP address
Number of events that contributed to an incident
Fully qualified domain name (FQDN)
Threat severity value
Number of threat sources associated with the Incident
Table 2 explains the other options available for each incident.
Table 2: Options for Each Incident
Option | Description |
|---|---|
Incident Details | Select Incident Details to see the following information about an incident:
|
Mitigate Incident | Select Mitigate Incident to enable the mitigation if it’s disabled and vice versa. To mitigate incidents, you must have already configured ATP Cloud or Policy Enforcer. For more information about mitigation settings, see Configure Mitigation Settings |
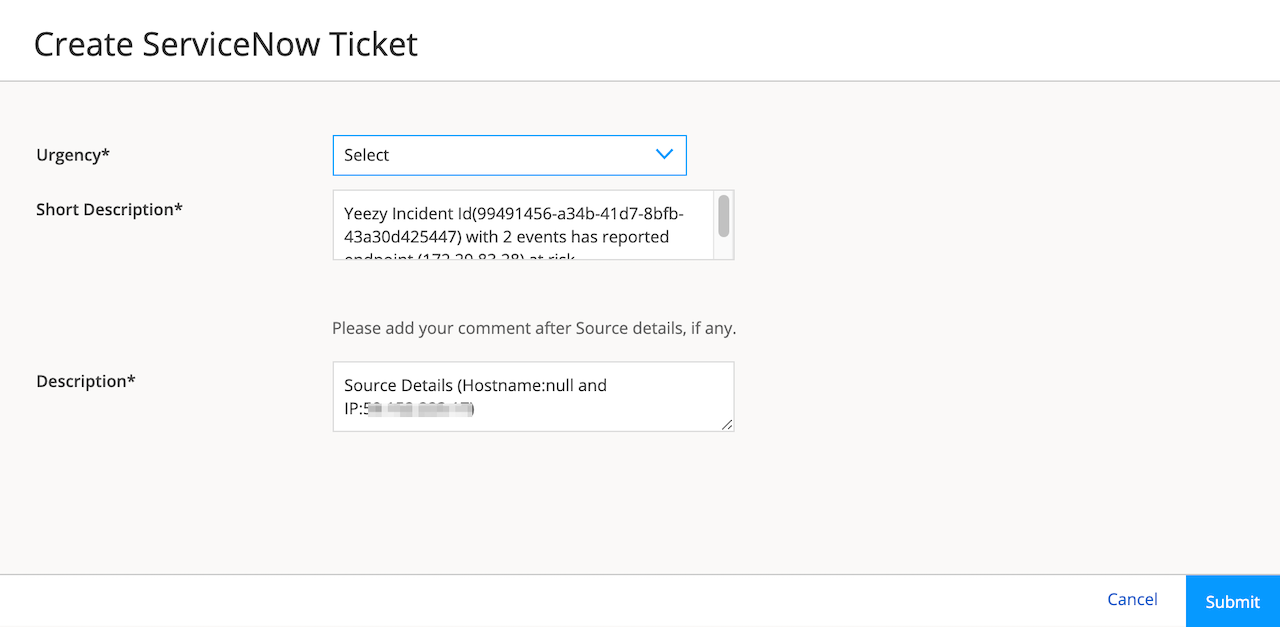
Create Ticket | You can create a ServiceNow ticket for an incident. You must have already configured ServiceNow settings to create a ServiceNow ticket. See About the ServiceNow Configuration Page. To create a ServiceNow ticket:
|
Plot View
Click the Plot View link for a brief summary of incidents represented in a soar bubble chart. Each bubble represents a host and the bubble size is proportional to the number of threats, as shown in Figure 4.
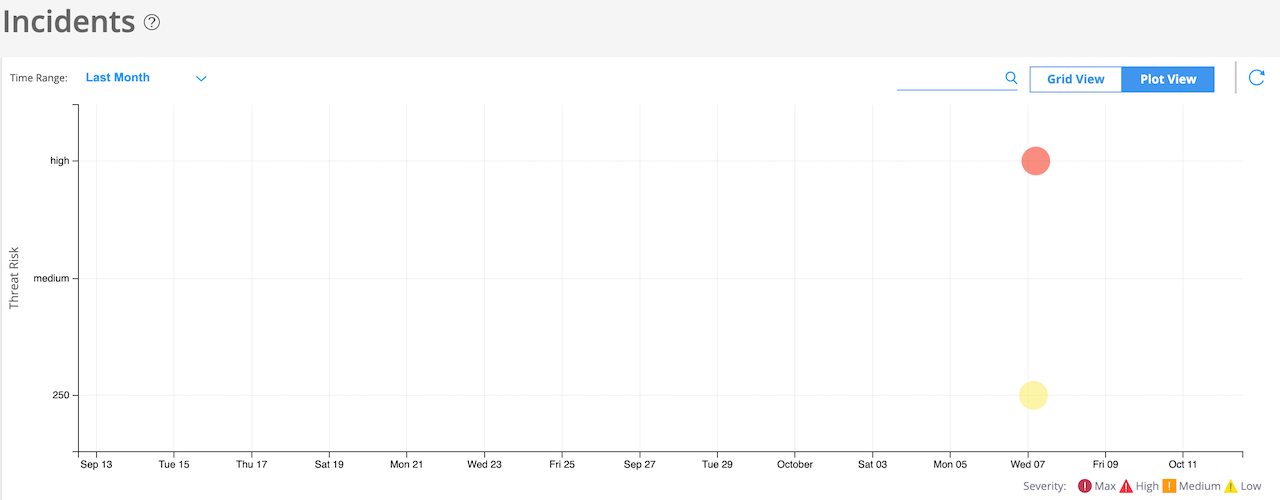
You can view data for a custom time range, last 24 hours, last week, last month, and last year.
Timeline View
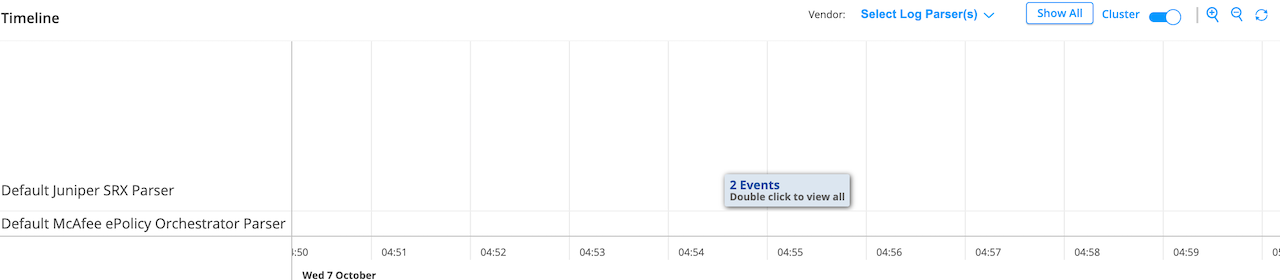
You can view all incidents on a timeline graph. Hover over each event to see more details about an incident. In the Select Log Parser(s) list, you can select the required log parser. You can select either one or all the log parsers. By default, the timeline graph shows all of the configured vendors in the log source.
Click Show All to see all events associated with an endpoint in the selected time range.
You can enable the Cluster option to cluster events belonging to the same time, as shown in Figure 5.
You can also zoom in, zoom out, and reset the data in the timeline graph. The reset option shows events for the corresponding incidents.