Scaling, Troubleshooting, and Monitoring Considerations
This chapter discusses various aspects of monitoring route server scale, Junos BGP components, and client-specific BGP sessions. Monitoring a route server is not unlike normal BGP session management, which is covered so commonly in other publications that we assume the reader is well-versed in it.
Unlike those normal BGP speakers, Junos route servers have a couple of special considerations
Configuration database size
rpd memory utilization for route copies between routing instances
Monitoring the Configuration Database Size
To support large configurations, for example say a thousand route server clients resulting in more than two million lines of output or more, the default configuration database size needs to be extended and compression enabled. The following configuration stanza enables extended configuration database size but requires a Junos reboot:
Initial Junos Configuration Database
The Junos configuration database can be monitored with the show system configuration database usage command, here
showing the size with a basic configuration:
Now let’s show 1,000 route-server clients, each with their own routing instance, import policy, instance-export policy, and instance-import policy:
You can see the significant database usage.
Monitoring Route Table Size
The next sample output shows summary statistics about the entries
in the routing table (show route summary command) and the memory usage breakdown (show task
memory detail command) for the rpd. The two commands
provide a comprehensive picture of the memory utilization of the routing
protocol process.
The show route summary command shows
the number of routes in the various routing tables for each route
server client. Within each routing table, all of the active, holddown,
and hidden destinations and routes are summarized. Routes are in the holddown state prior to being declared inactive, and
hidden routes are not used because of routing policy. Note that routes
in the holddown and hidden states are still using memory because they appear in the routing
table:
Monitoring RPD Memory Utilization
The show task memory detail command
lists the data structures within the tasks run by rpd. Tasks are enabled
depending on the router’s configuration. The Alloc
Bytes field indicates the highest amount of memory used
by the data structure. The maximum allocated blocks and bytes are
high water marks for a data structure. The example below looks to
be output from a very healthy route server as very little memory is
being allocated:
 -------------------------------------------------------------------------
 ------------------------ Allocator Memory Report -------------------------
 Name                 Size Alloc DTXP    Alloc     Alloc MaxAlloc  MaxAlloc
 bgp-th-wrstage-iov  10240 12288             5     61440        7     86016
 rt_table_name_node     20    24            11       264       12       288
 bgpconf              1776  1792            12     21504       17     30464
 bgp_uio_trace_conf     20    24            36       864       36       864
 bgp_uio_group_info    820   896             4      3584        4      3584
 bgp_uio_peer_info     168   192             7      1344        7      1344
 bgp_orf_mark_t         24    28             7       196        7       196
 bgp_riblist_entry_t    12    16            12       192       12       192
 bgp_rg_list_obj         8    12             1        12        1        12
 bgp_msgbld             76    80            11       880       11       880
 bgp_io_oper           228   256             7      1792        7      1792
 bgp_nlri_sync_t       372   384             7      2688        7      2688
 bgp-rib-to-group       12    16             4        64        4        64
 bgp_mrto_hash        4096  8192             2     16384        4     32768
 bgp-rib-grp          1896  2048             2      4096        4      8192
 bgp-rib-globals        28    32             7       224        7       224
 bgp-rib-peer-group    496   512             2      1024        4      2048
 bgp-rib-peer-counter  116   128             7       896        7       896
 bgp-rib-peer          484   512             7      3584        7      3584
 bgp-rib               136   140             7       980        7       980
 bgp ifachg notify      12    16             3        48        3        48
 bgp ifachg reg         32    36             3       108        3       108
 bgp_act_node          700   768             7      5376        7      5376
 bgp_adv_entry          24    28             6       168      136      3808
 bgp_checksum_stats_t   12    16             7       112        7       112
 bgp_tsi_t              16    20             6       120      136      2720
 bgp_addpath_params_t   12    16             7       112        7       112
 bgpb_sbits_01          20    24             4        96       10       240
 bgp_metrics_node       84    96            13      1248       19      1824
 bgpg_rtinfo_entry      16    20             6       120       65      1300
 bgp_peeras_t           16    20             1        20        3        60
 bgp_rtentry            24    28            43      1204      105      2940
 bgp_bmp_common_peer_    4     8            16       128       22       176
 bgpPeerGroup        19088 20480             4     81920        4     81920
 bgpPeer              9288 12288             7     86016        7     86016
 bgp_buffer           4100  8192             5     40960        7     57344
 bgp_cluster_t          16    20             1        20        1        20
 bgp_instance_t         88    96             5       480        6       576
 bgp_evpn_metrics       48    52            18       936       34      1768
  -------------------------------------------------------------------------
  -------------------------- Malloc Usage Report ---------------------------
  Name                      Allocs     Bytes  MaxAllocs   MaxBytes FuncCalls
  BGP_3                          3       448          3        448         3
  BGP_Group_C3                   4       816          4        816         4
  BGP_2                          3       448          3        448         3
  BGP_Group_C2                   4       816          4        816         4
  BGP_1                          3       448          3        448         3
  BGP_Group_C1                   4       816          4        816         4
  BGP_100_100                    3       448          3        448         3
  BGP_100_100                    3       448          3        448         3
  BGP_100_100                    3       448          3        448         3
  BGP_100_100                    3       448          3        448         3
  BGP_Group_evpn                 4       816          5        828        94
  BGP_RT_Background             29    278000         32     278136       303
  bgp-thrio                      1      8192          1       8192         1
  bgp-thrio-ctx                 41     19552         60      27420    575053
  BGP addpath task               2      3584          2       3584         2
	 -------------------------------------------------------------------------
Monitoring Client EBGP Sessions
Individual route server client EBGP sessions can be viewed either
as a summarized list, or specifically, using show bgp
summary on the sample topology:
 root@rs1> show bgp summary
 Threading mode: BGP I/O
 Groups: 4 Peers: 7 Down peers: 0
 Table        Tot Paths  Act Paths Suppressed History Damp State     Pending
 bgp.evpn.0
                     12         12          0       0          0           0
 Peer          AS      InPkt     OutPkt OutQ   Flaps Last Up/Dwn State|#Active/
Received/Accepted/Damped...
 192.0.2.1      1       6195       6093     0     1  1d 22:26:37  Establ
    C1.inet.0: 31/31/31/0
 192.0.2.2      2        332        325     0     7      2:27:38  Establ
    C2.inet.0: 31/31/31/0
 192.0.2.3      3      53788      52946     0     0  2w2d 19:23:41 Establ
    C3.inet.0: 31/31/31/0
root@rs1> show bgp neighbor 192.0.2.1
Peer: 192.0.2.1+56947 AS 1  Local: 192.0.2.254+179 AS 123
  Group: C1                  Routing-Instance: C1
  Forwarding routing-instance: master
  Type: External    State: Established    Flags: <Sync>
  Last State: OpenConfirm   Last Event: RecvKeepAlive
  Last Error: Hold Timer Expired Error
  Options: <Preference AddressFamily PeerAS Refresh>
  Options: <MtuDiscovery>
  Options: <RouteServerClient>
  Address families configured: inet-unicast
  Holdtime: 90 Preference: 170
  Number of flaps: 1
  Last flap event: HoldTime
  Error: ‘Hold Timer Expired Error’ Sent: 1 Recv: 0
  Peer ID: 192.0.2.1        Local ID: 192.0.2.254        Active Holdtime: 90
[...Output truncated...]`
Monitoring Route Distribution
The following show command views the total routes present in the route server client C3’s RIB, along with the RIBs where they are imported:
root@rs1> show route export C3.inet.0 detail
C3.inet.0                         Routes:     31
Import: [ C1.inet.0 C2.inet.0 C3.inet.0 ]
To see specific routes in C3’s RIB that will be exported to C1, based on the IXP global policy, view the source RIB and filter by using the target community:
root@rs1> show route protocol bgp community 64498:1 table C3.inet.0

C3.inet.0: 31 destinations, 31 routes (31 active, 0 holddown, 0 hidden)
+ = Active Route, - = Last Active, * = Both

198.51.100.0/24     *[BGP/170] 2w0d 20:13:27, localpref 100
                      AS path: 3 I, validation-state: unverified
                    > to 192.0.2.3 via ge-0/0/1.0
203.0.113.0/24      *[BGP/170] 2w0d 20:13:27, localpref 100
                      AS path: 3 I, validation-state: unverified
                    > to 192.0.2.3 via ge-0/0/1.0
[...Output truncated...]
A slightly different view, or rather a validation of the previous command, is to look at the RIB contents of all client RIBs from the perspective of what routes have been received from a specific route server client. In the next example, 192.0.2.3 is the BGP peer associated with the routing-instance C3:
root@rs1> show route receive-protocol bgp 192.0.2.3 | except inet.0

inet.3: 4 destinations, 4 routes (4 active, 0 holddown, 0 hidden)

C1.inet.0: 31 destinations, 31 routes (31 active, 0 holddown, 0 hidden)
  Prefix        Nexthop       MED     Lclpref    AS path
* 198.51.100.0/24          192.0.2.3                              3 I
* 203.0.113.0/24           192.0.2.3                              3 I
  [...Output truncated...]

C3.inet.0: 31 destinations, 31 routes (31 active, 0 holddown, 0 hidden)
   Prefix       Nexthop       MED     Lclpref    AS path
* 198.51.100.0/24           192.0.2.3                             3 I
* 203.0.113.0/24            192.0.2.3                             3 I
   [...Output truncated...]
Specific prefixes can also be searched for to aid in troubleshooting:
regress@RS1> show route receive-protocol bgp 192.0.2.3 198.51.100.0 |except inet.0

C1.inet.0: 31 destinations, 31 routes (31 active, 0 holddown, 0 hidden)
  Prefix       Nexthop        MED     Lclpref    AS path
* 198.51.100.0/24           192.0.2.3                             3 I

C1.inet.0: 31 destinations, 31 routes (31 active, 0 holddown, 0 hidden)
  Prefix       Nexthop        MED     Lclpref    AS path
* 198.51.100.0/24           192.0.2.3                             3 I
Routes may also be searched by community value or name. The search results in retrieving all the clients’ RIBs that have a match, so route propagation between client RIBs can be tracked:
regress@RS1> show route protocol bgp community-name as64498_comms 198.51.100.0

inet.0: 41 destinations, 41 routes (40 active, 0 holddown, 1 hidden)

C1.inet.0: 93 destinations, 93 routes (93 active, 0 holddown, 0 hidden)
+ = Active Route, - = Last Active, * = Both

198.51.100.0/24     *[BGP/170] 2w2d 19:32:26, localpref 100
                      AS path: 3 I, validation-state: unverified
                    > to 192.0.2.3 via ge-0/0/1.0

C3.inet.0: 62 destinations, 62 routes (62 active, 0 holddown, 0 hidden)
+ = Active Route, - = Last Active, * = Both

198.51.100.0/24     *[BGP/170] 2w2d 19:32:26, localpref 100
                      AS path: 3 I, validation-state: unverified
                    > to 192.0.2.3 via ge-0/0/1.0
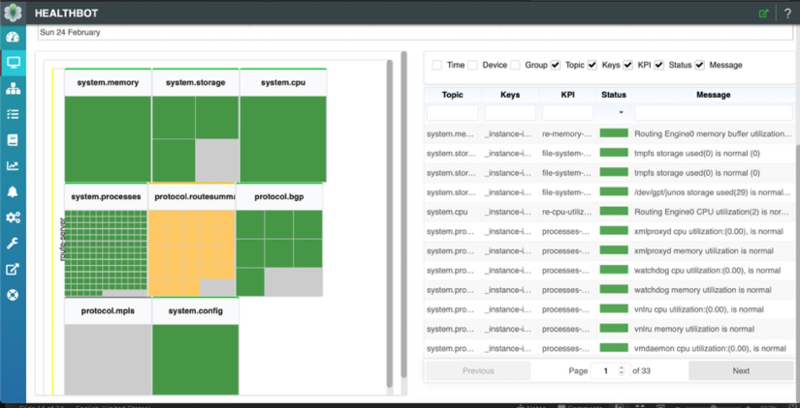
Monitoring Tools: HealthBot
HealthBot is a highly automated and programmable device-level diagnostics and network analytics tool that provides consistent and coherent operational intelligence across network deployments. Integrated with multiple data collection methods (such as Junos Telemetry Interface, NETCONF, and SNMP), HealthBot aggregates and correlates large volumes of time-sensitive telemetry data, providing a multidimensional and predictive view of the network. Additionally, HealthBot translates troubleshooting, maintenance, and real-time analytics into an intuitive user experience to give network operators actionable insights into the health of an individual device and the overall network.
HealthBot BGP KPIs, located at https://github.com/Juniper/healthbot-rules/tree/master/juniper_official/Protocols/Bgp, contain readily consumable HealthBot playbooks and rules, which are specific to BGP neighbor key performance indicators (KPIs).
BGP KPI rules collect the statistics from network devices then analyzes the data and acts. A BGP KPI playbook is set of rules, each rule is defined with a set of KPIs. Playbooks contain BGP session state, neighbor flap detection, received routes with static threshold, and received routes with dynamic threshold rules.
Rules are defined with default variable values that can be changed when deploying playbooks.
HealthBot RIB KPIs, located at https://github.com/Juniper/healthbot-rules/tree/master/juniper_official/Protocols/Rib, contain readily consumable HealthBot playbooks and rules that are specific to RIB route summary KPIs. RIB route summary KPI rules collect the statistics from network devices then analyze the data and act appropriately. The RIB route summary KPI playbook is set of rules, each rule is defined with set of KPIs. Playbooks contain route table summaries for ascertaining routes and protocol route summary rules with dynamic thresholds. Rules are defined with default variable values that can be changed while deploying the playbook.
HealthBot Systems KPIs, located at https://github.com/Juniper/healthbot-rules/tree/master/juniper_official/System, contain readily consumable HealthBot playbooks and rules that are specific to system KPIs. System KPI rules collect the statistics from network devices, then analyze the data and act. The system KPI playbook is a set of rules, where each rule is defined with a set of KPIs. Playbooks contain routing engine CPU, routing engine memory, Junos processes CPU, memory leak detection, and system storage rules.
Rules are defined with default variable values, which can be changed while deploying the playbook.