Packet Flow in Contrail End-to-End View
So far, we’ve looked at floating IP, service, and Ingress in detail, and examined how all these objects are related to each other. In Contrail, both service and ingress are implemented based on load balancers (but with different loadbalancer_provider types). Conceptually, Ingress is designed based on service. The VIP of both types of load balancers are implemented based on floating IP.
Packet Flow
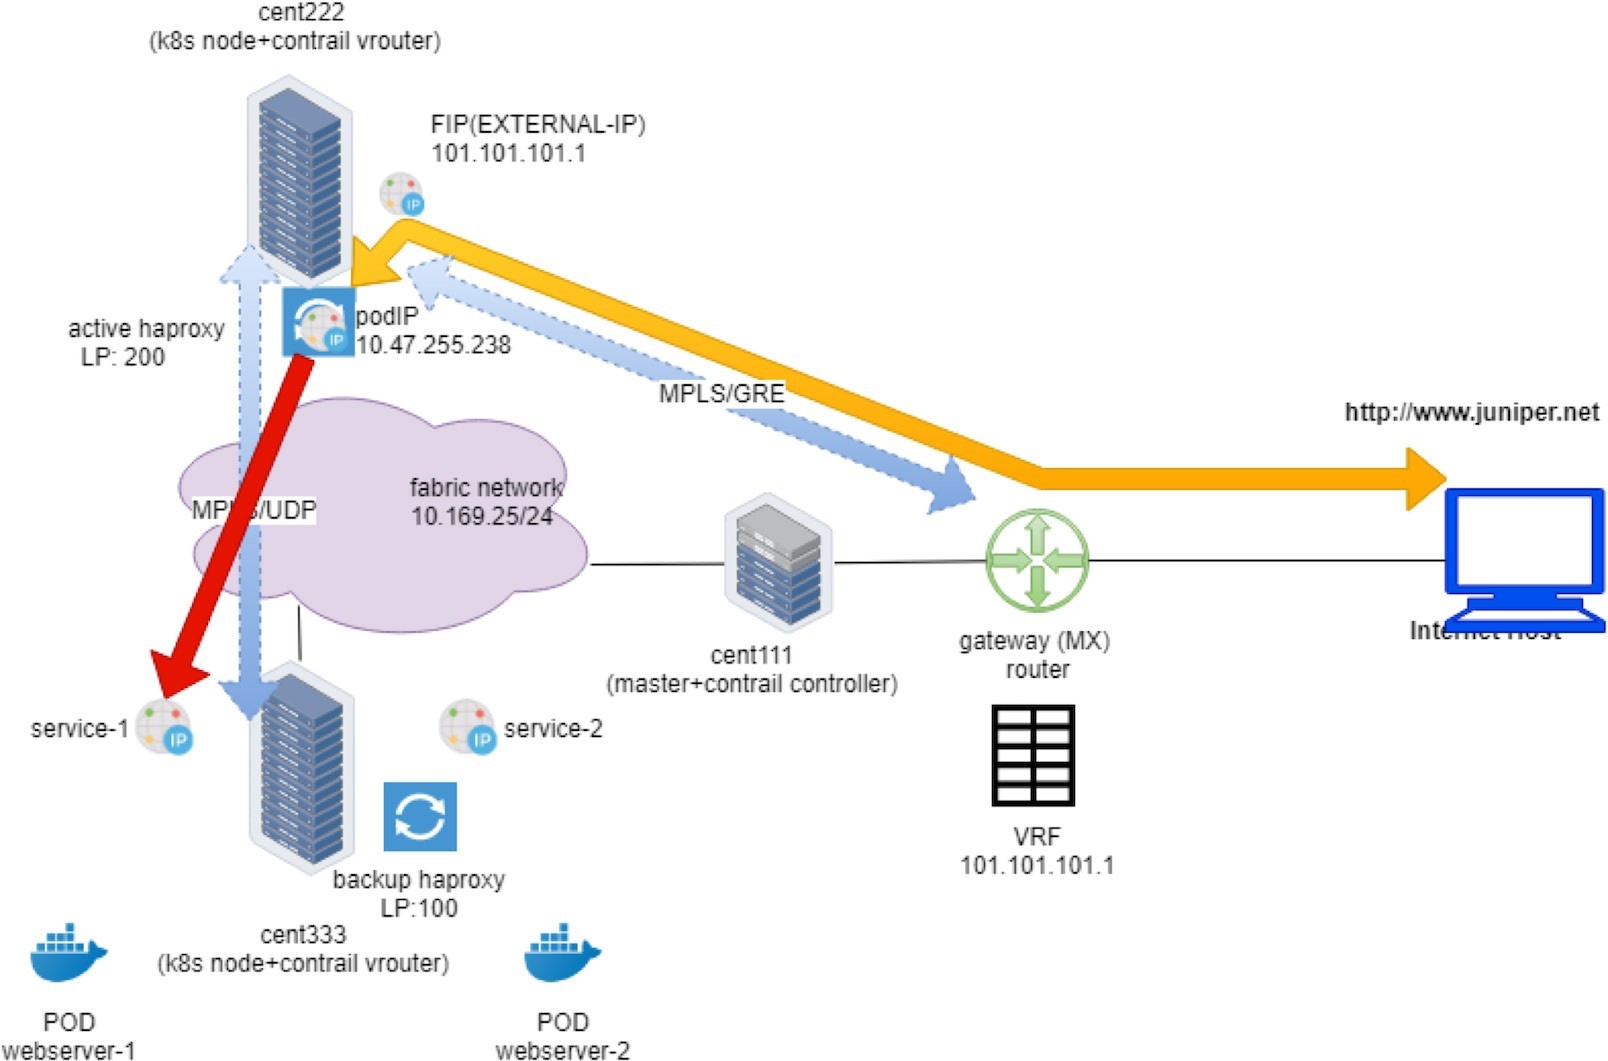
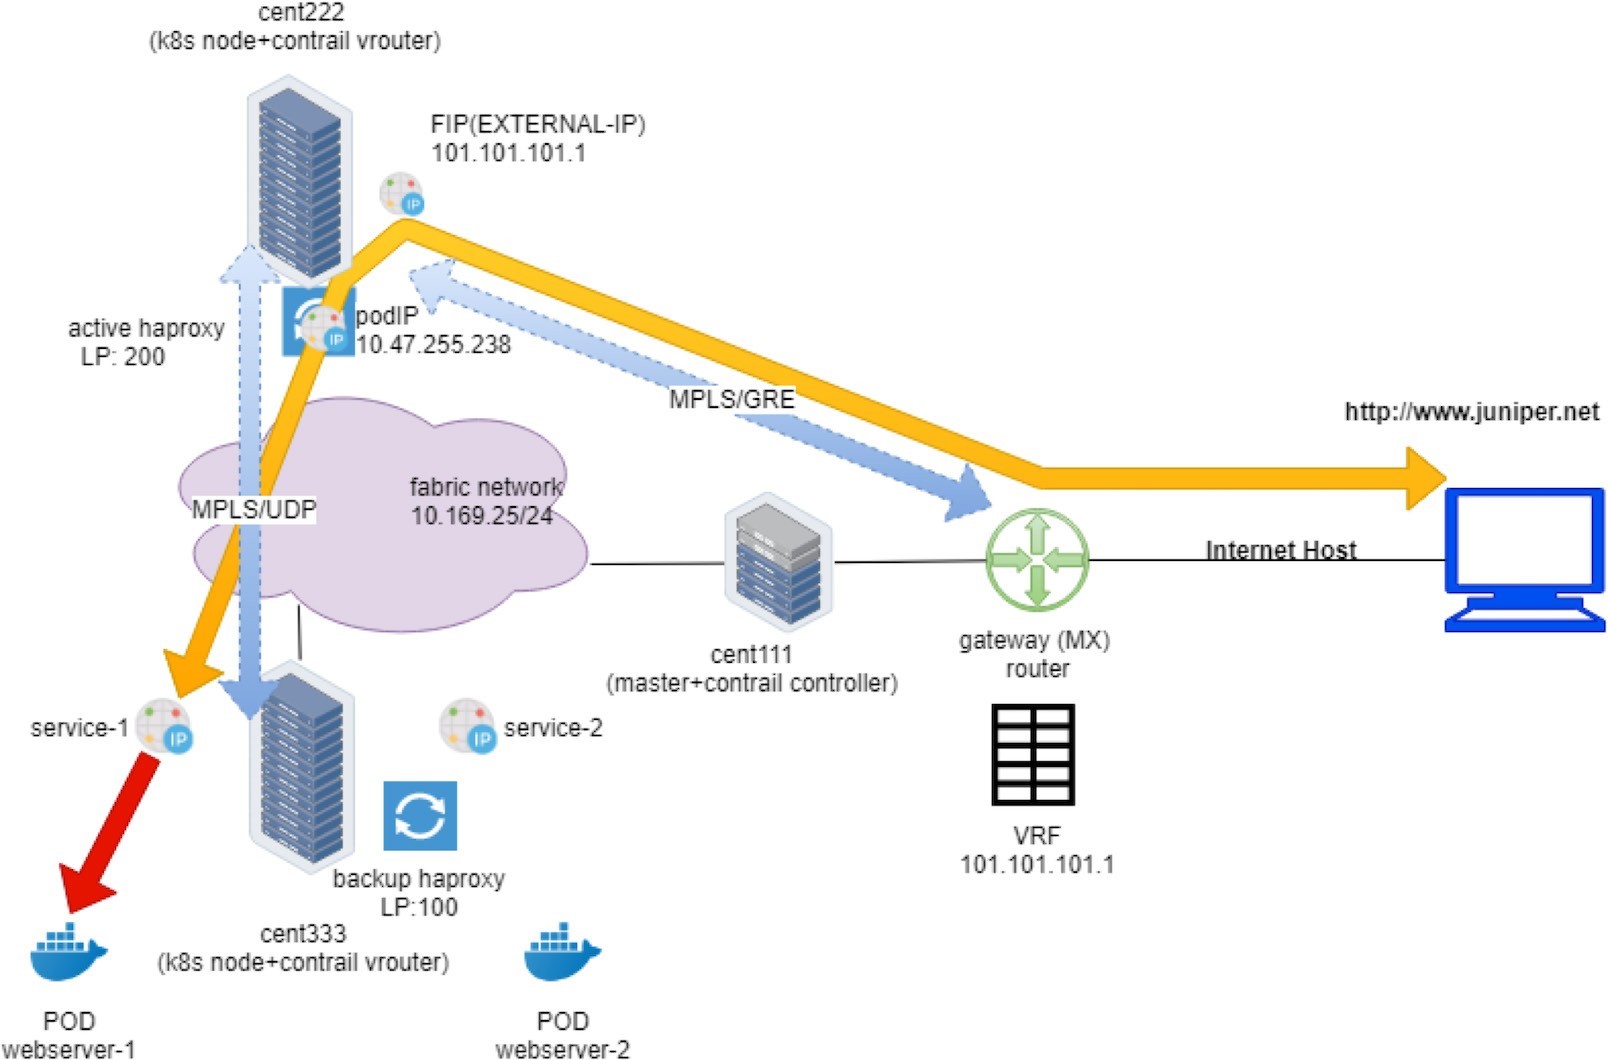
In order to illustrate the detail packet flow in this Contrail Kubernetes environment, let’s examine the end-to-end HTTP request from the external Internet host to the destination pod in our Ingress lab setup. We’ll examine the forwarding state step-by-step: starting from the Internet host, through the gateway router, then through the active haproxy, backend service, and to the final destination pod.
Understanding packet flow will enable you to troubleshoot any future forwarding plane issues.
Setup, Utilities, and Tools
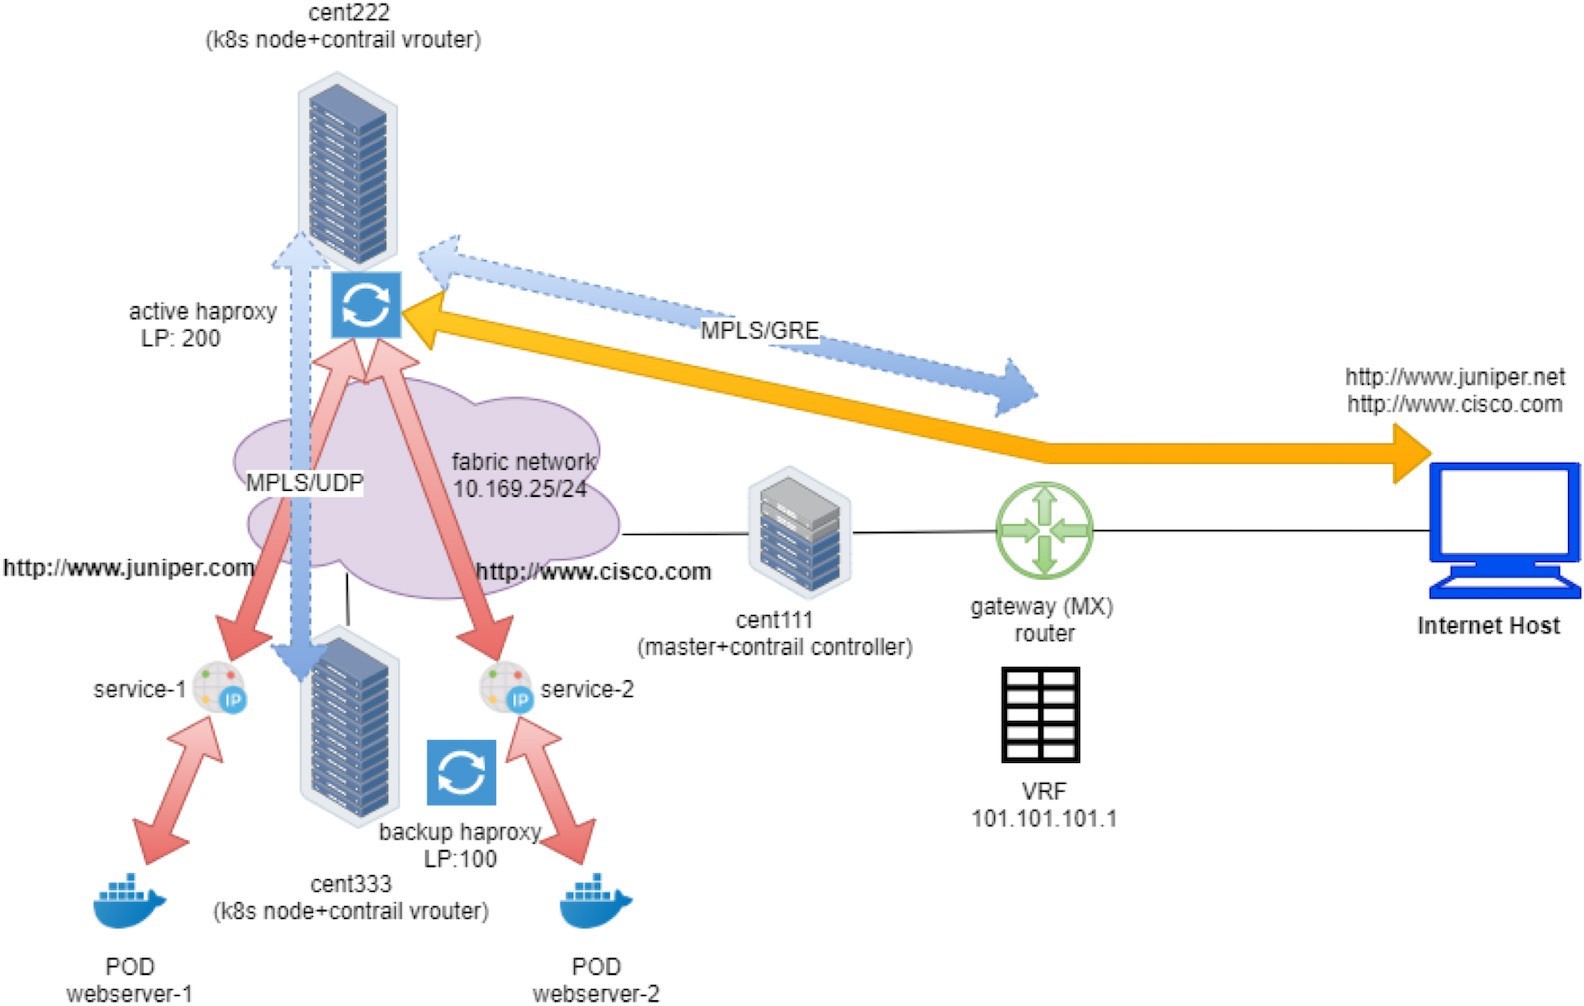
You’ve seen Figure 1 before in the Ingress section of Chapter 6.
Earlier, we looked at the external gateway router’s VRF routing table and used the protocol next hop information to find out which node gets the packet from the client. In practice, you need to find out the same from the cluster and the nodes themselves. A Contrail cluster typically comes with a group of built-in utilities that you can use to inspect the packet flow and forwarding state. In the service examples you saw the usage of flow, nh, vif, etc., and in this chapter we’ll revisit these utilities and introduce some more that can demonstrate additional information about packet flow.
Some of the available utilities/tools that are used:
On any Linux machine:
curl (with debug option), telnet as HTTP client tool
tcpdump and wireshark as packet capture tool
shell script can be used to automate command line tasks
On the vRouter: flow/rt/nh/vif and etc.
Curl
One behavior in the curl tool implementation is that it will always close the TCP session right after the HTTP response has been returned when running in a shell terminal. Although this is safe and clean behavior in practice, it may bring some difficulties to our test. So in this lab we actually held the TCP connection to look into the details. However, a TCP flow entry in Contrail vRouter is bound to the TCP connection, and when the TCP session closes the flow will be cleared. The problem is that curl gets its job done too fast. It establishes the TCP connection, sends the HTTP request, gets the response, and closes the session. Its process is too fast to allow us any time to capture anything with the vRouter utilities (e.g. flow command). As soon as you hit enter to start the curl command, the command returns in less than one or two seconds.
Some workarounds are:
Large file transfer: One method is to install a large file in the webserver and try to pull it with curl, that way the file transfer process holds the TCP session. We’ve seen this method in the service section in Chapter 3.
Telnet: You can also make use of the telnet protocol. Establish the TCP connection toward the URL’s corresponding IP and port, and then manually input a few HTTP commands and headers to trigger the HTTP request. Doing this allows you some period of time before the haproxy times out and takes down the TCP connection toward the client.
However, please note that haproxy may still tear down its session immediately toward the backend pod. How haproxy behaves varies depending on its implementation and configurations.
From the Internet host, telnet to Ingress public FIP 101.101.101.1 and port 80:
The TCP connection is established (we’ll check what is at the other end in a while). Next, send the HTTP GET command and host header
GET / HTTP/1.1Host: www.juniper.netThis basically sends a HTTP GET request to retrieve data and the Host provides the URL of the request. One more return indicates the end of the request, which triggers an immediate response from the server:
From now on you can collect the flow table in the active haproxy compute node for later analysis.
Shell Script
The third useful tool is a script with which you can automate the test process and repeat the curl and flow command at the same time over and over. With a small shell script in compute node to collect flow table periodically, and another script in the Internet host to keep sending request with curl, over time you will have a good chance to have the flow table captured in compute node at the right moment.
For instance, the Internet host side script can be:
And the compute side script may look like:
First the shell one-liner starts a new test every three seconds, then the second one captures a specific flow entry every 0.2 seconds. Twenty tests can be done in two minutes to capture some useful information in a short time.
In this next section we’ll use the script method to capture the required information from compute nodes.
Packet Flow Analysis
Earlier we used the curl tool to trigger HTTP requests for our test. It supports extensive options for various features. We’ve seen the -H option, which specifies the host field in a HTTP request. This time, for debugging purposes, we use another useful option, -v in the curl command:
This option displays more verbose information about the HTTP interaction:
The > lines are the messages content that curl sent out, and
The < lines are message content that it receives
from remote. From the interaction you can see
The curl sent a HTTP GET with path / to the FIP 101.101.101.1, and with Host filled with juniper URL.
It gets the response with code 200 OK, indicating the request has succeeded.
There are a bunch of other headers in the response that are not important for our test so we can skip them.
The rest of the response is the HTML source code of a returned web page.
The connection is immediately closed afterward.
Now you’ve seen the verbose interactions that curl performed under the hood, and you can understand the GET command and host header we sent in the telnet test. In that test we were just emulating what curl would do, but just now we did it manually!
Internet Host to Gateway Router
First let’s start from the client – the Internet host.
As in any host, the routing table is pretty simple. The static route, or more typically, a default route, pointing to the gateway route is all that it needs:
The last entry is the static route that we’ve manually configured, pointing to our gateway router.
In this setup, we configured a VRF table in the gateway router to connect the host machine into the same MPLS/VPN so that it can communicate with the overlay networks in Contrail cluster. In practice, there are other ways to achieve the same goal. For example, the gateway router can also choose to leak routes with policies between VPNs and the Internet routing table, so that an Internet host that is not part of the VPNs can also access the overlay networks in Contrail.
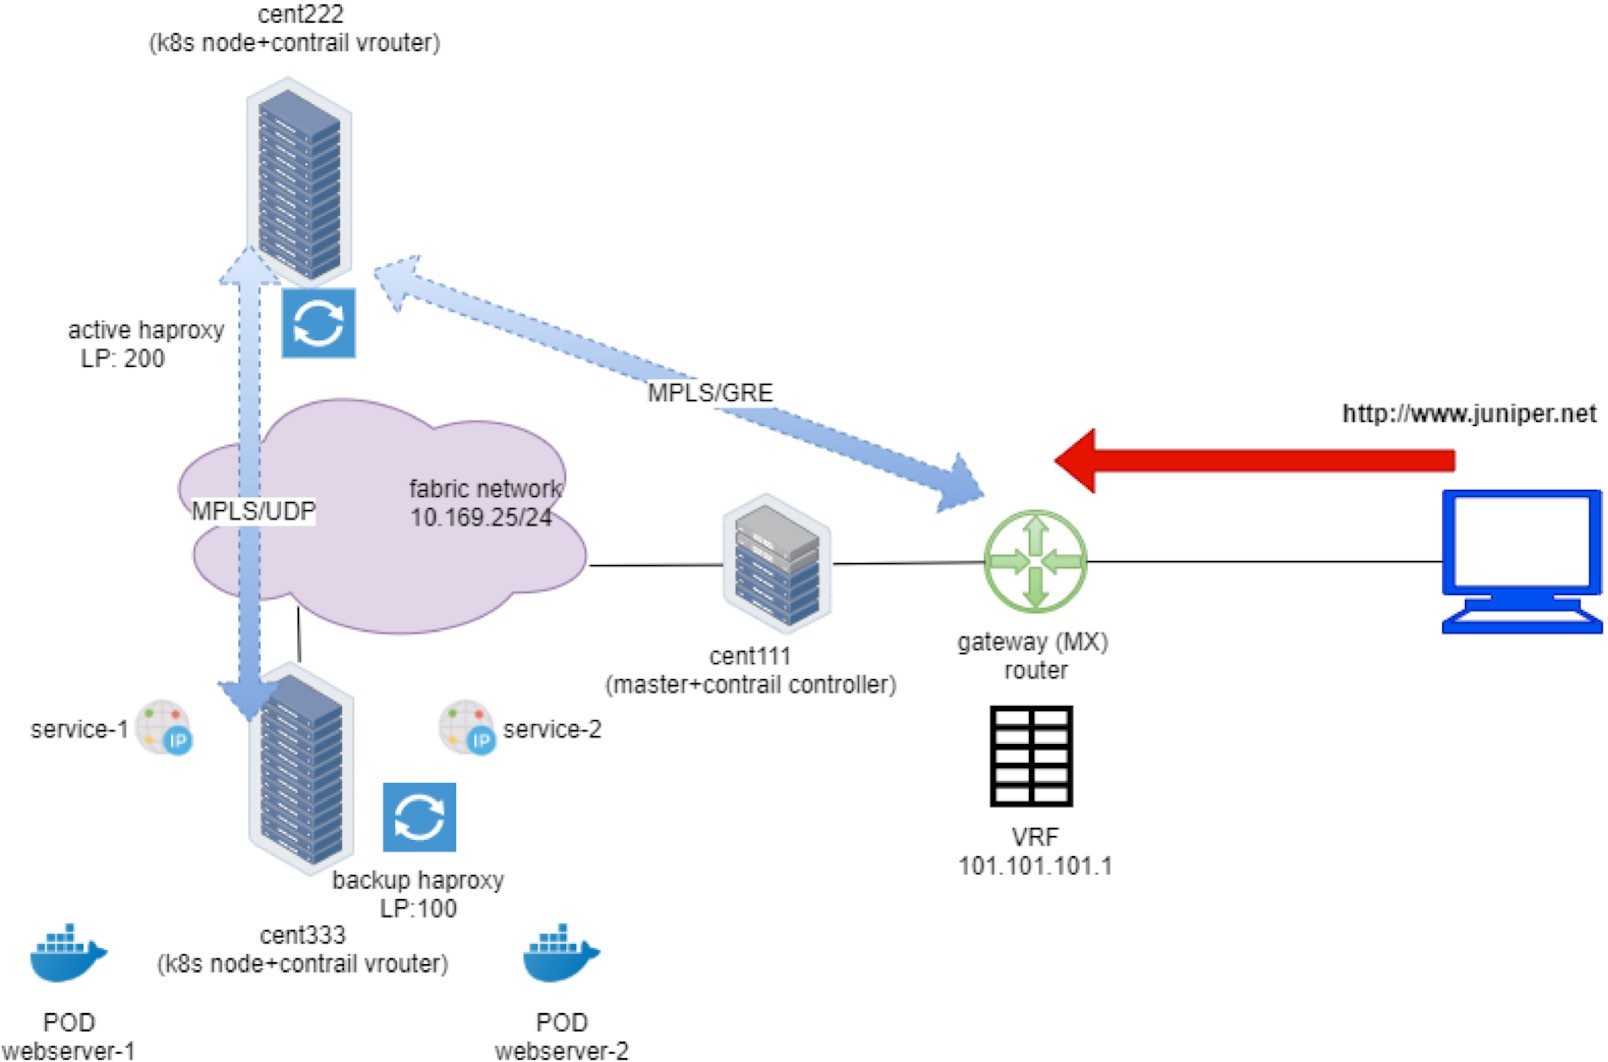
Gateway Router to Ingress Public Floating IP: MPLS over GRE
We’ve seen gateway router’s routing table before. From the protocol next hop we can find out that the packet will be sent to active haproxy node cent222 via the MPLSoGRE tunnel.
Now with the flow table collected on both computes, we can find out the same information. Let’s take a look at the flow entries of active proxy compute:
This flow reflects the state of the TCP connection originating from the Internet host client to active haproxy. Let’s look at the first entry in the capture:
The first flow entry displays the source and destination of the HTTP request; it is coming from Internet host (15.15.15.2) and lands the Ingress floating IP in current node cent222.
The S(nh):61 is the next hop to the source of the request – the Internet host. This is similar to reverse path forwarding(RPF). The vRouter always maintains the path toward the source of the packet in the flow.
The nh --get command resolves the nexthop 61 with more details. You can see a MPLSoGRE flag is set, Sip and Dip are the two ends of the GRE tunnel, and they are currently the node and the gateway router’s loopback, IP respectively.
The TCP:SSrEEr are TCP flags showing the state of this the TCP connection. The vRouter detects the SYN (S), SYN-ACK (Sr), so the bidirectional connection is established (EEr).
Proto(V) field indicate the VRF number and protocol type. two VRF is involved here in current (isolated) NS ns-user-1.
VRF 2: the VRF of default pod network
VRF 5: the VRF of the FIP-VN
protocol 6 means TCP (HTTP packets).
We’ll use VRF 2 later when we query the nexthop for a prefix in the VRF routing table.
Overall, the first flow entry confirms that the request packet from the Internet host traverses the gateway router, and via the MPLSoGRE tunnel it hits the ingress external VIP 101.101.101.1. NAT will happen and we’ll look into that next.
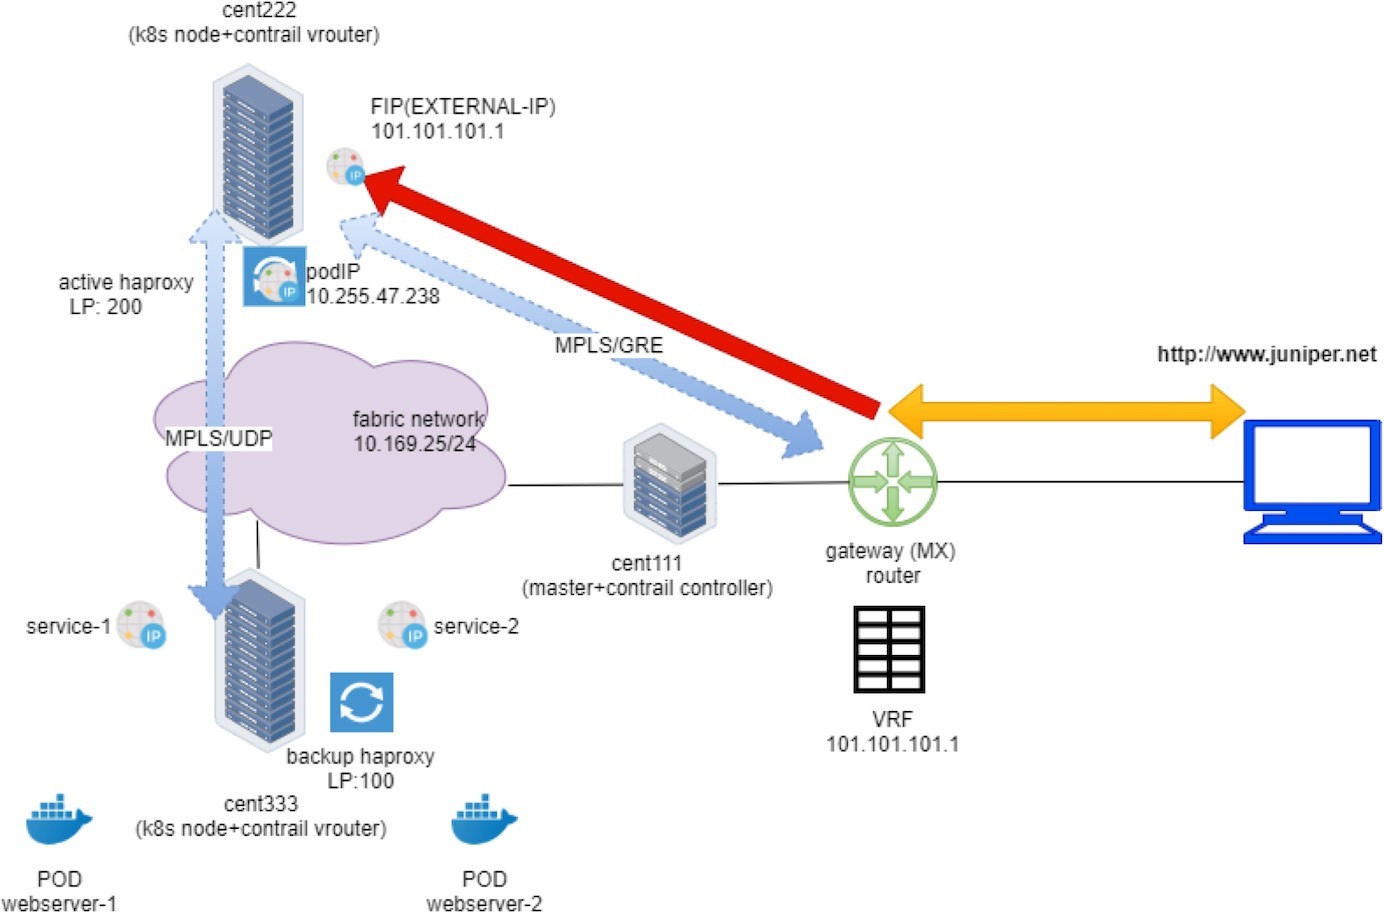
Ingress Public Floating IP to Ingress Pod IP: FIP(NAT)
To verify the NAT operation, you only need to dig a little bit more out of the previous flow output:
The Action flag, N(D), in the first entry indicates destination NAT or DNAT. Destination ingress external floating IP 101.101.101.1, which is the external ingress, will be translated to the ingress internal VIP.
The Action flag, N(S), in the second entry, indicates source NAT or SNAT. This indicates source NAT source IP 10.47.255.238, which is the internal ingress, and the VIP will be translated to the ingress external VIP.
In summary, what the flow table of active haproxy node cent222 tells us is that on receiving the packet destined to the ingress floating IP, vRouter on node cent222 performs NAT operation and translates destination floating IP (101.101.101.1) to the ingress’s internal VIP (10.47.255.238). After that the packet lands the ingress load balancer’s VRF table and forwards it to the active haproxy’s listening interface. The HTTP proxy operation will now happen, and we’ll talk about it next.
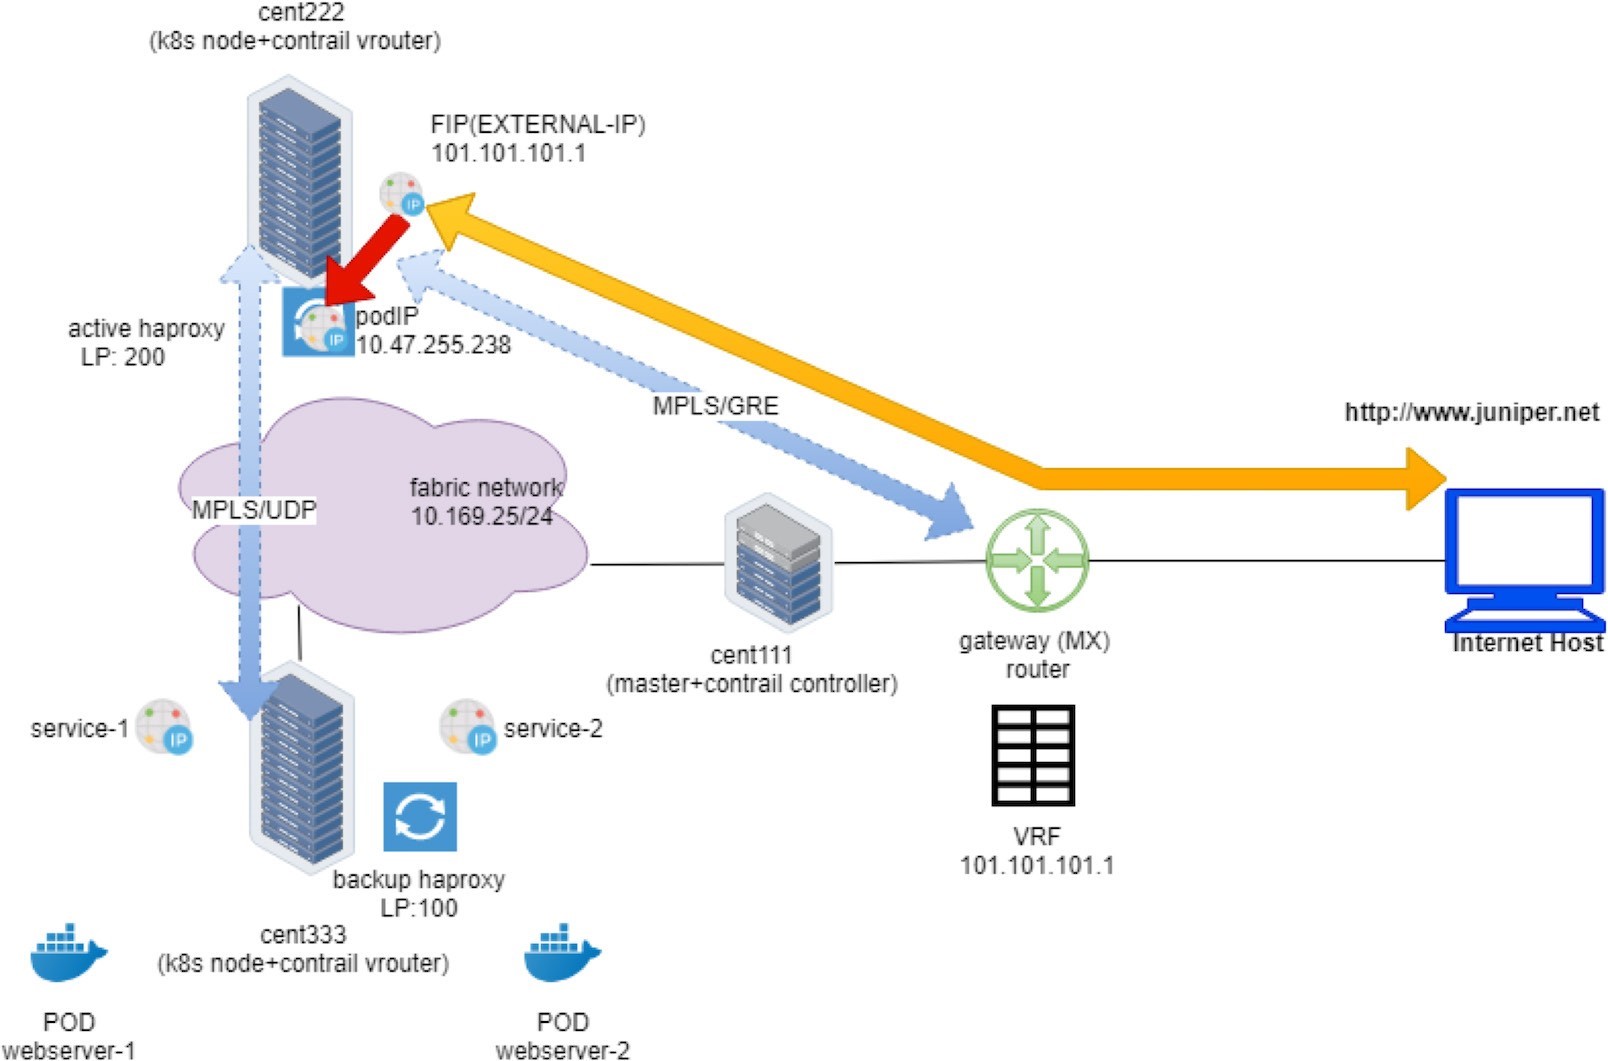
In vRouter flow, the second flow entry is also called a reverse flow of the first one. It is the flow entry vRouter that sends the returning packet towards the Internet host. From the ingress load balancer’s perspective it only uses 10.47.255.238, assigned from the default pod network as its source IP, it does not know anything about the floating IP. The same goes for the external Internet host, it only knows how to reach the floating IP and has no clues about the private ingress internal VIP. It is the vRouter that is doing the two-way NAT translations in between.
Ingress Pod IP to Service IP: MPLS over UDP
Now the packet lands in the ingress load balancer’s VRF table and it is in the frontend of the haproxy. What happens is:
The haproxy is listening in on the frontend IP (ingress internal podIP/VIP) and port 80 to see the packet.
The haproxy checks the ingress rule programmed in its configuration file, decides that the requests need to be proxied to the service IP of webservice-1.
The vRouter checks the ingress load balancer’s VRF table and sees the prefix of webservice-1 and the service IP is learned from a destination node cent333, which will be the next hop to forward the packet.
Between compute nodes the forwarding path is programmed with MPLSoUDP tunnel, so the vRouter sends it through MPLS over UDP tunnel with the right MPLS Label.
This process is illustrated next in Figure 5:
Let’s first take a look at the VRF routing table from UI. In UI, we can check the VRF routing table based on the VRF name, from any compute node.
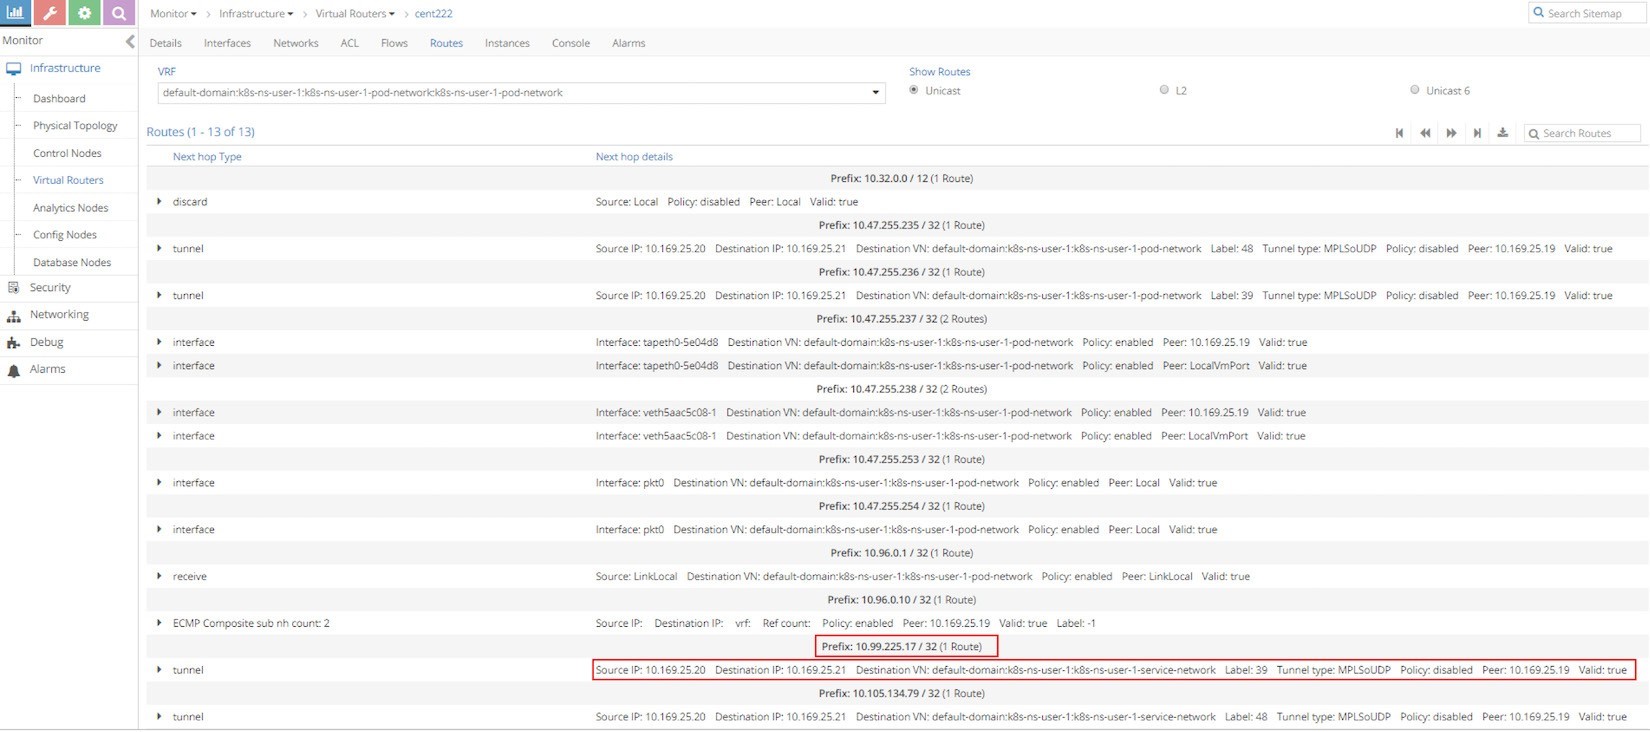
From the Ingress podIP’s VRF, which is the same VRF for the default pod network of current namespace, we can see that the next hop toward service IP prefix 10.99.225.17/32 is the other compute node cent333 with IP 10.169.25.21 through MPLSoUDP tunnel. The same result can also be found via vRouter rt/nh utilities:
Please note that all the traffic from ingress to service happens in the overlay between Contrail compute nodes, which means that all overlay packets should be encapsulated in MPLS over UDP tunnel. To verify the haproxy process packet processing details, let’s capture packets on the physical interface of node cent222, where the active haproxy process is running. The next screen capture, Figure 7, shows the results
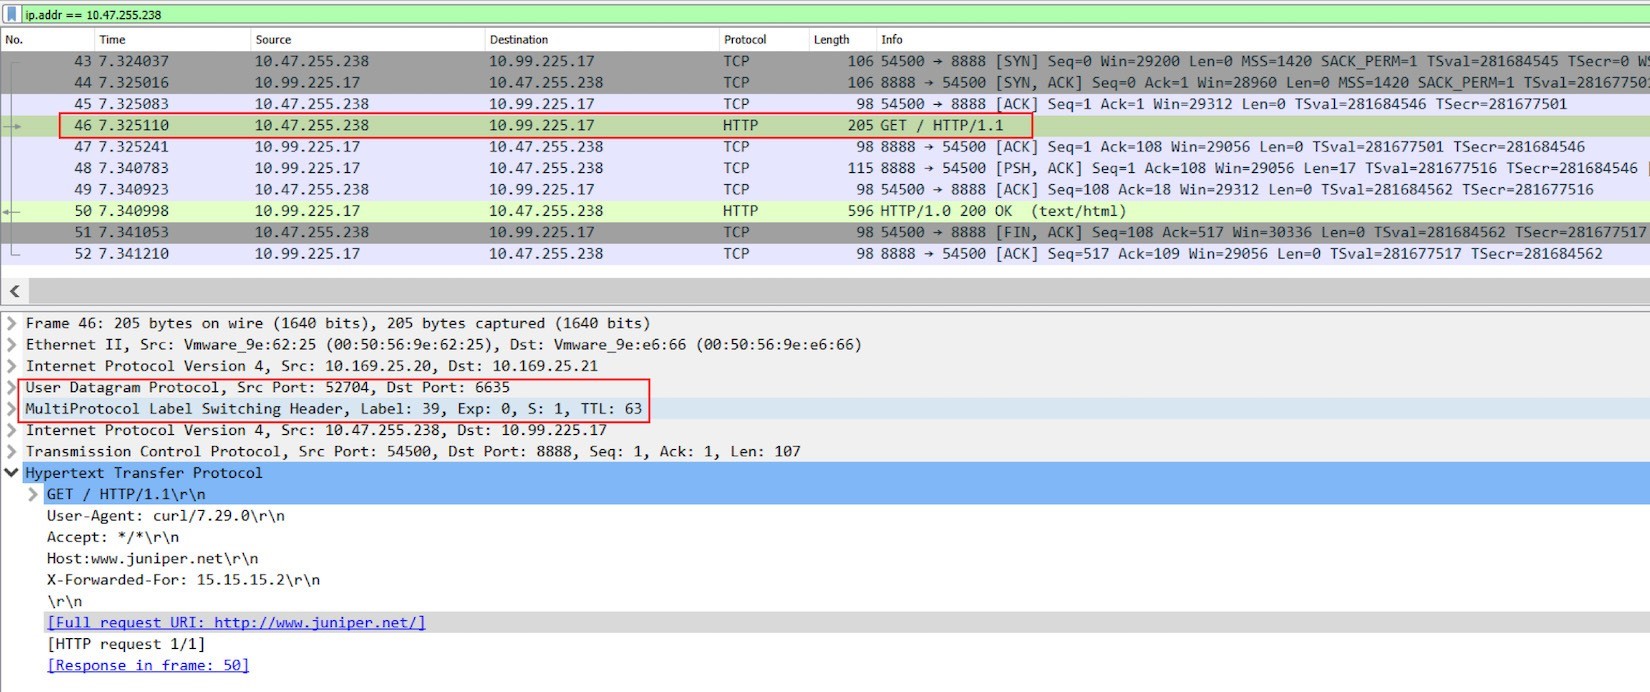
From the Wireshark screenshot in Figure 7, you can see clearly that:
Frames 43-45, Ingress private podIP established a new TCP connection toward service IP and port, this happens in overlay.
Frame 46, on the new TCP connection, haproxy starts a HTTP request to the service IP.
Frame 50, the HTTP response returns back.
Frame 46 is also the one to use as an example to show the packet encapsulation. You’ll see this IP packet containing the HTTP request is MPLS-labeled, and it is embedded inside of a UDP datagram. The outer source and destination IP of the packet are 10.169.25.20 (compute node cent222) and 10.169.25.21 (compute node cent333), respectively.
Forward Versus Proxy
If you are observant enough, you should have noticed something weird in this capture. For example:
Shouldn’t the source IP address be the Internet host’s IP 15.15.15.2, instead of load balancer’s frontend IP?
Is the original HTTP request forwarded at all?
Is the transaction within the same TCP session sourcing from Internet host, crossing gateway router and load balancer node cent222, all the way down to the backend pod sitting in node cent333?
The answer to all of these questions is No. The haproxy in this test is doing Layer 7 (Application Layer) load balancing. What it does is:
Establishes TCP connection with the Internet host and keeps monitoring the HTTP request;
Whenever it sees a HTTP request coming in, it checks its rules and initiates a brand new TCP connection to the corresponding backend;
It copies the original HTTP request it receives from the Internet host and pastes into the new TCP connection with its backend. Precisely speaking, the HTTP request is proxied, not forwarded.
Extending the wireshark display filter to include both 15.15.15.2 and 101.101.101.1.
Figure 8: Packet Capture On Active Haproxy Node Cent222 Fabric Interface: The “Whole Story” 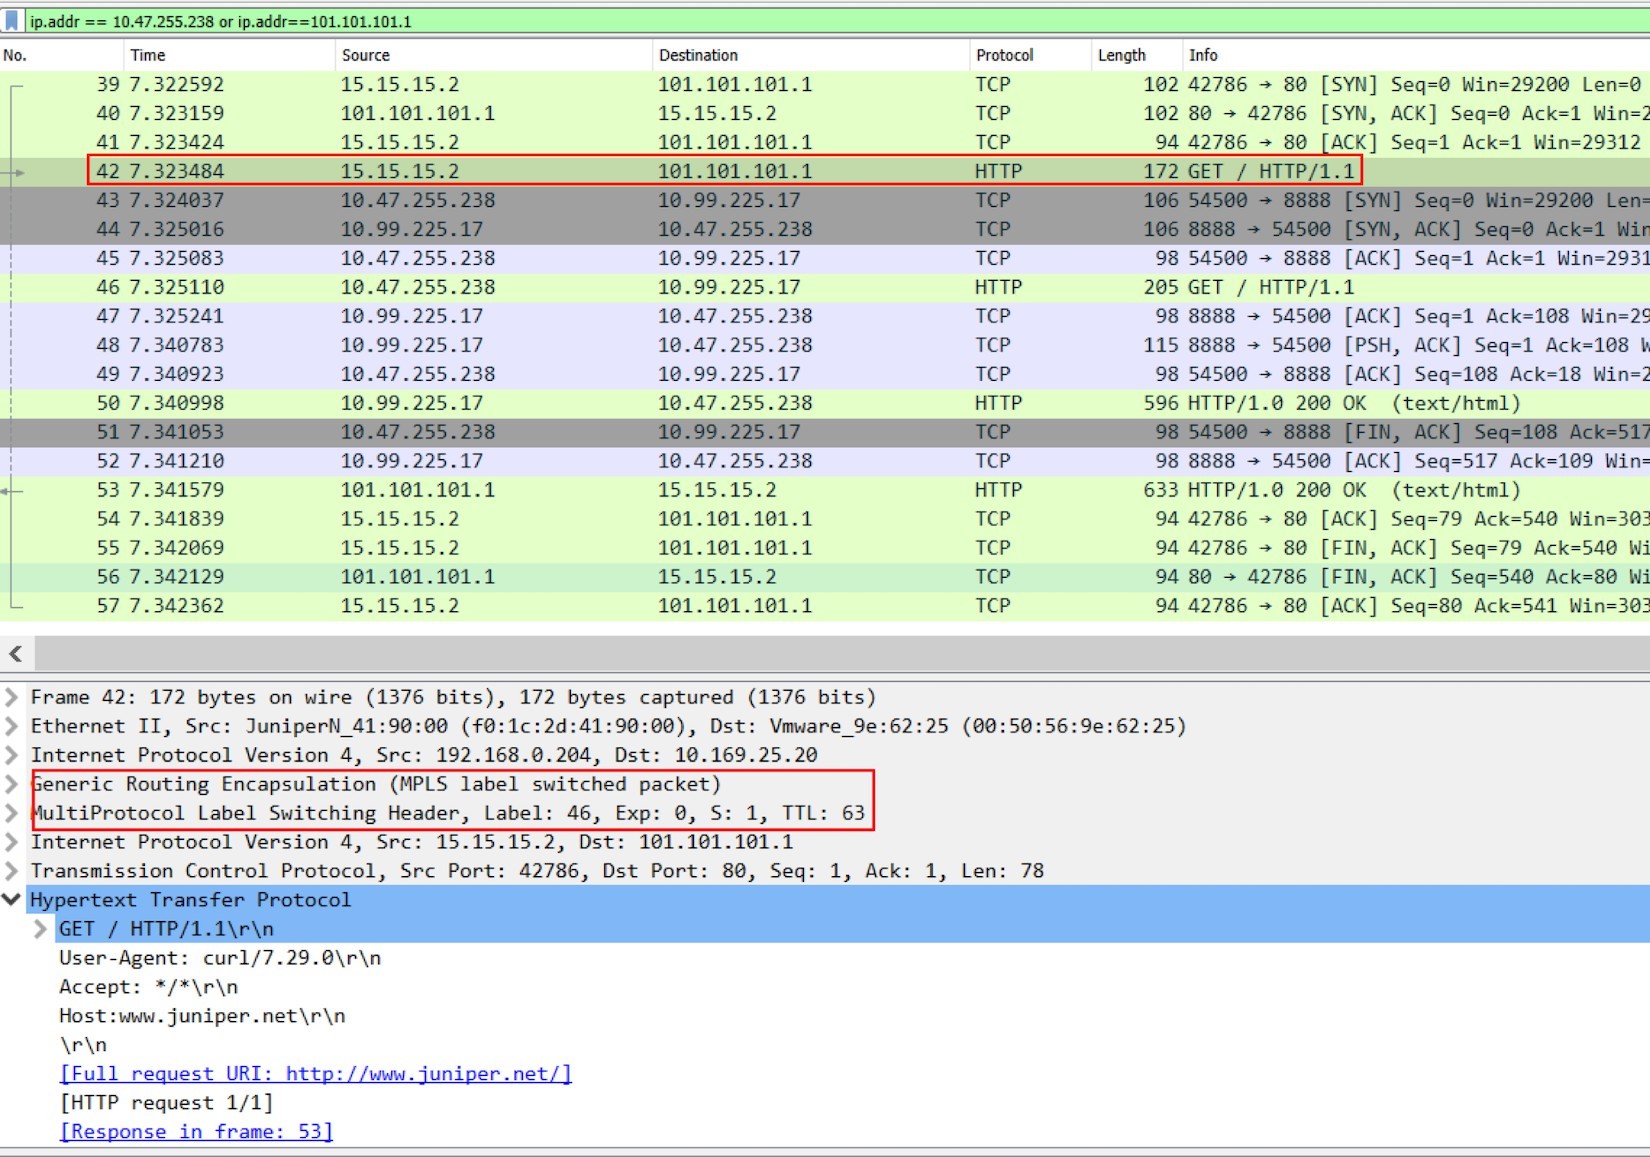
Frame 39-41: Internet host established a TCP connection toward Ingress external public FIP.
Frame 42: Internet host sent HTTP request.
Frame 43-52: active haproxy established a new TCP connection toward service, sent the HTTP request, retrieved the HTTP response, and closed the connection.
Frame 53-54: active haproxy sent the HTTP response back to Internet host.
Frame 55-57: Internet host closed the HTTP connection.
Here we use frame 42 to display the MPLS over GRE encapsulation between active haproxy node cent222 and the gateway router. When comparing it with frame 46 in the previous screenshot, you will notice this is a different label. The MPLS label carried in the GRE tunnel will be stripped before the vRouter delivers the packet to the active haproxy. A new label will be assigned when active haproxy starts a new TCP session to the remote node.
At the moment we know the HTTP request is proxied to haproxy’s backend. According to the ingress configuration, that backend is a Kubernetes service. Now, in order to reach the service, the request is sent to a destination node cent333 where all backend pods are sitting. Next we’ll look at what will happen in destination node.
Service IP to Backend Pod IP: Floating IP(NAT)
On destination node cent333, when the packet comes in from Ingress internal IP 10.47.255.238 toward the service IP 10.99.225.17 of webservice-1, the vRouter again does the NAT translation operations. It translates the service IP to the backend podIP 10.47.255.236, pretty much the same way as what you’ve seen in node cent222, where the vRouter translates between the ingress public floating IP with the ingress internal podIP.
Here is the flow table captured with the shell script. This flow shows the state of the second TCP connection between active haproxy and the backend pod:
You’ve seen something similar in the service section, so you shouldn’t have issues understanding it. Obviously the second entry is triggered by the incoming request from active haproxy IP (the Ingress podIP) towards the service IP. The vRouter knows the service IP is a floating IP that maps to the backend podIP 10.47.255.236, and service port maps to the container targetPort in the backend pod. It does DNAT+DPAT (DPd) in the incoming direction and SNAT+SPAT (SPs) in the outgoing direction.
The other easy way to trace this forwarding path is to look at the MPLS label. In previous step we've seen label 38 is used when the active haproxy computes cent222 sent packets into the MPLSoUDP tunnel to compute cent333. You can use the vrouter mpls utility to check the nexthop of this In-label:
$ docker exec -it
				vrouter_vrouter-agent_1 mpls --
				get 38 MPLS Input Label Map

				Label NextHop
				38 26

		$ docker exec -it vrouter_vrouter-agent_1 nh --get 26
		Id:26		Type:Encap
				Fmly: AF_INET Rid:0 Ref_cnt:9
				Vrf:2 Flags:Valid, Policy, Etree
				Root,
				EncapFmly:0806 Oif:4 Len:14
				Encap Data: 02 bd e8 bc 46 9a 00 00 5e 00 01 00 08 00

		$ vif --get 4
		Vrouter Interface Table

Flags: P=Policy, X=Cross Connect, S=Service
		Chain, Mr=Receive Mirror Mt=Transmit
		Mirror, Tc=Transmit Checksum Offload,
		 L3=Layer 3, L2=Layer 2 D=DHCP, Vp=Vhost
		Physical, Pr=Promiscuous, Vnt=Native Vlan
		Tagged
		Mnp=No MAC Proxy, Dpdk=DPDK PMD Interface, Rfl=Receive
		Filtering Offload, Mon=Interface is Monitored Uuf=Unknown
		Unicast Flood, Vof=VLAN insert/strip offload, Df=Drop New
		Flows, L=MAC Learning Enabled Proxy=MAC Requests Proxied
		Always, Er=Etree Root, Mn=Mirror without Vlan Tag, Ig=Igmp
		Trap Enabled


vif0/4 OS: tapeth0-baa392
		Type:Virtual
		HWaddr:00:00:5e:00:01:00
		IPaddr:10.47.255.236 Vrf:2 Mcast
		Vrf:2 Flags:PL3DEr QOS:-1 Ref:6
		RX 	packets:29389
 		bytes:1234338 		errors:0
		TX 		packets:42264
		bytes:1775136 		errors:0
		Drops:29389
Once the next hop is determined, you can find the outgoing interface (Oif) number, then with vif utility you can locate the pod interface. The corresponding podIP 10.47.255.236 is the backend pod for the HTTP request, which looks consistent with what the flow table shows above.
Finally the pod sees the HTTP request and responds back with a web page. This returning traffic is reflected by the first flow entry in the capture, which shows:
The original source IP is a backend podIP of 10.47.255.236
The original source port is webserver port 80
The destination IP is Ingress internal podIP 10.47.255.238
Backend Pod: Analyze HTTP Request
Another tcpdump packet capture on the backend pod interface helps to reveal the packet interaction between the ingress internal IP and the backend podIP:
Return Traffic
On the reverse direction, podIP runs webserver and responds with its web page. The response follows the reverse path of the request:
The pod responds to load balancer frontend IP, across MPLSoUDP tunnel.
The vRouter on node cent333 performs SNAT+SPAT, translating podIP:podPort into serviceIP:servicePort.
The respond reaches to the active haproxy running on node cent222.
The haproxy copies the HTTP response from the backend pod, and pastes into its connection with the remote Internet host.
The vRouter on node cent222 performs SNAT, translating load balancer frontend IP to floating IP
The response is sent to the gateway router, which forwards it to the Internet host.
The Internet host gets the response.