Marvis 对话助手
开始使用 Marvis 对话助手获取网络相关信息、排除故障并查找文档。
对话助手通过使用自然语言处理 (NLP) 和自然语言理解 (NLU) 功能提供帮助。它通过从用户反馈中学习来不断改进其响应。
Marvis 可以:
-
提供有关站点、设备、客户端和应用的信息
-
帮助解决与站点、设备、客户端和应用有关的问题
您可以通过遵循提示或输入问题和语句与对话助手进行交互,就像在正常对话中一样。例如,您可以问:“连接了多少台交换机?”或“主站点的工作方式如何?”
视频演示
观看用户与 Marvis 对话助手的交互。
In today's product highlights, we are going to go through the next generation Marvis called the Marvis Conversational Assistant. Using this assistant, we are going to see Marvis answer any and every question that I may have, either directly providing me the answer or asking for clarifying questions in a way of conversations to better understand my question. So let's see what Marvis can do for us today by clicking on the bottom right of my screen.
And what we see here is Marvis being able to answer every and any question right from troubleshooting to searching for a device and documentation. So let's get started with one of these options. In my case, I'm going to select troubleshoot site and my focus is the site live demo.
And that's what I'm going to ask it to tell me about. And very easily and seamlessly, I can see there are three issues plaguing the site. Starting from slow association to the AP uptime not being 100% and finally poor coverage.
Any of these can be drilled down into for further analysis and also to look at detailed data right from the dashboard on the left. Now going back to the troubleshooting scenario, I would also like to know if and who all are having a problem at the site. So I'll simply ask Marvis which users are having issues.
And right away, Marvis presents me with the list of clients having any sort of issue for me to look into and drill deeper. In this case, I'm going to look at this client called Denali and see what Marvis comes up with. So similar to what we saw at that site, this client too has slow association with the reason indicated right here for me to act upon and also the option to drill deeper and check out the client insights for further analysis in terms of the timeline and the different client events.
No discussion of wireless is complete without talking about the access point and that is what I want to know next. For this, I'm going to take a sample access point from the site. Let's say we take the one with the most recent uptime.
In this case, it is this LTEBC AP and see how it's doing. I'll go back to Marvis and ask how is LTEBC and let's see what we find out. For one, this AP is healthy and is doing well, but clients connected to this AP have poor coverage due to an asymmetry in the uplink, which can further be drilled down and trouble short.
Moving over from wireless, looking into the wired infrastructure, let's see how our switches are doing. For that, I'm going to go to the switches tab and pick off any AP or let's see if Marvis is smart enough to understand even a partial name for a switch, which is usually how I name my switches at the site. Similar names with just different ending parameters.
In this case, I'm going to say troubleshoot LD Cup. Now we see Marvis is smart enough to know which all switches or any devices, for the matter of fact, have a similar name called LD Cup. Let's go ahead and see how these switches are doing.
In this case, directly, we can see this switch has high latency on all of these interfaces and again, we can drill deeper and look at the details for the switch or even the failure timelines. Alternatively, we can click on any other switch and see what other issues it has and continue doing that for any switch of our choice. So far, we looked at troubleshooting the site, a single client, an AP and a switch.
Now let's move forward and look at how we could search for a certain device, which has called in and we want to know more details about the device, including its location. So I'm going to simply say, find Denali, which is one such client in our environment. And here, Marvis tells us the client Denali is in the site live demo along with the MAC address and the IP address.
And again, a way for us to go directly to the client and look at more details from the dashboard. The next piece, which we have is documentation, and this can be seen in different ways and forms. For instance, I want to know, does LDEBC have enough capacity? So specifically for capacity, we now see the SLE or the metric for that specific access point.
And we can see it's for LDEBC for today. You can, as far as concerned, your concern can also go back to seven days and look at this access point as well. So yes, I can see in terms of capacity, this access point may not be the best one in terms of capacity, since it has a lot of Wi-Fi interference and it's something I should take care of when I do expect my client traffic and count to increase.
Another popular one is to see how to configure my Juniper switch onto my Mist cloud. So, I'll simply ask how to configure switches. And here we get the different documentations with respect to configuring switches, right from best practices to template-based configuration, which is our de facto standard in terms of configuring switches and access points. Finally, as a different way, I also want to see how RRM is doing. So I want to know firstly, hey, how to set up RRM. Sure.
It's going to be for my site live demo. And directly I can go to the radio management piece or the page of the dashboard and look at the radio settings for those to be configured. Let's see some other questions which are pertinent and what Marvis can do about it.
I also want to know, do I have rogue APs in my environment, which is going to be problematic and would cause user connectivity issues. Sure. This is for my site live demo. And it directly shows me where I could go to see the rogue AP list. And definitely I can see there are a bunch of rogue APs which I should look and act upon. The final element here, and no discussion of Marvis is complete without talking about Marvis actions, which is the org-wide view of any and every issue you may have.
When a client comes on board onto your network, right to it accessing an application in your data center or out in the cloud, thus giving you the end-to-end visibility of a client to cloud picture. In this case, I want to know, do I have any bad cables? Now, if you may have noticed, I did purposely mistyped a couple of pieces here and you can see it did consider that as clients. And that is where you can come in and always give us feedback as we continue to look at improving the product and say, no, Marvis, I asked about cables.
Now let's get back to our original question and frame it in a better way. So I'll ask, do I have bad cables? And we can see it directly takes us to Marvis actions, but we can see there are zero layer one issues, which translates to zero bad cables. I hope this was useful for you and I look forward to connecting with you all on a different topic in a different video.
寻找对话助手
单击 Juniper Mist 门户左上角或右下角的 Marvis 图标。

使用自然语言
单击 Marvis 图标,然后在 Marvis 窗口底部 的“消息 ”框中输入您的问题或疑虑。
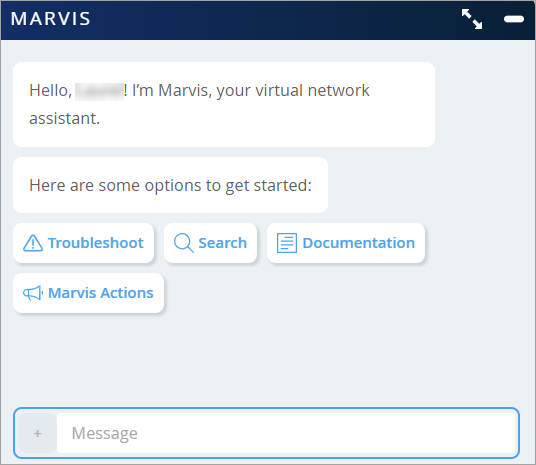
以下提示
单击 Marvis 图标,然后单击 Marvis 显示的按钮之一。
初始提示包括:
-
故障排除 — 单击此选项可对站点、应用、设备以及有线或无线客户端的问题进行故障排除。
-
搜索 - 单击此选项可搜索用户、设备和站点。
-
文档 - 单击此选项可搜索文档。
-
Marvis作 - 单击此选项可查看作仪表板中的待处理作。
在您响应提示后,Marvis 会通过显示另一个提示来继续对话。在以下示例中,您可以看到 Marvis 与想要解决站点故障的用户之间的交互。
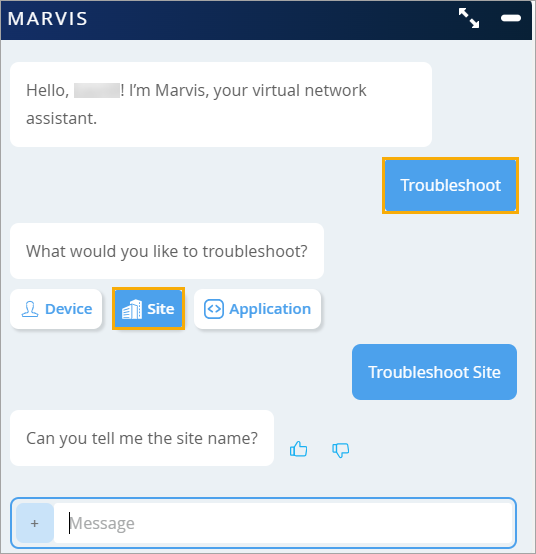
您还可以从支持工单创建页面访问对话助手,以便在提交支持工单之前快速排除受影响的站点、设备和客户端。有关详细信息,请参阅 创建支持票证。