WAN SLE
使用WAN服务级别体验 (SLE) 来评估影响用户的因素,例如WAN边缘运行状况、WAN链路运行状况和应用运行状况。
概述
SLE 过滤器按钮
-
使用左侧的按钮显示 成功率 或 值。
-
使用 “显示自定义应用程序” 切换来显示或隐藏您的自定义应用程序。
在下面的示例中,按钮处于关闭位置,因此 包括所有 应用程序。如果将按钮拖动到 “打开 ”位置,则只会看到自定义应用程序。

-
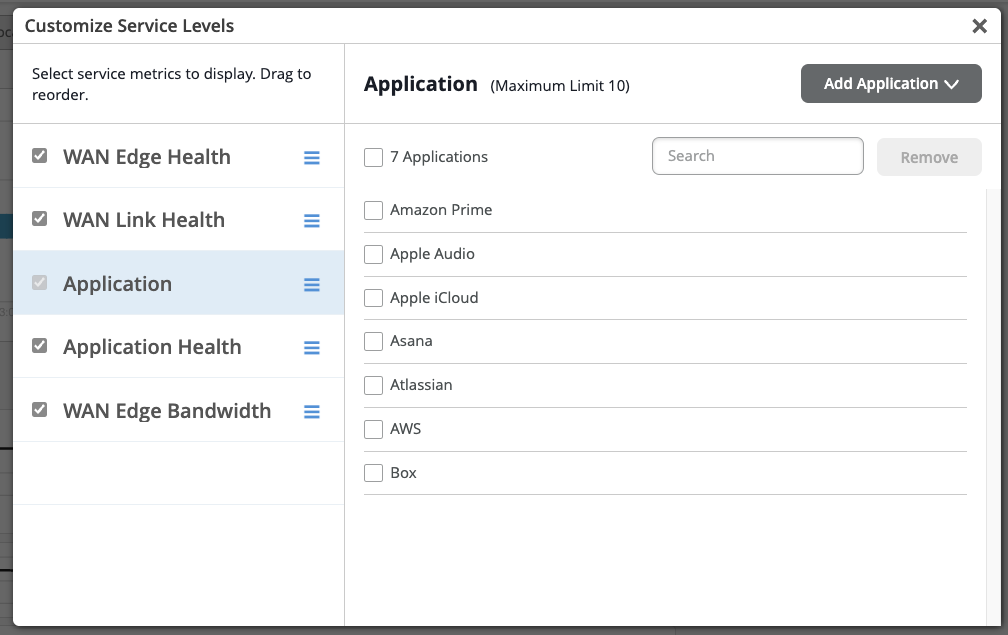
使用右侧的 “设置 ”按钮自定义服务指标。在 自定义服务级别 弹出窗口中:
-
您可以根据需要选择、取消选择服务指标(WAN 边缘运行状况、 WAN 链路运行状况、 应用程序、 应用运行状况和 WAN 边缘带宽)并重新排序。
在 “应用 服务度量”选项卡中,您可以选择和取消选择应用,并且最多可为 SRX 系列防火墙配置 10 个自定义应用。要添加新应用程序,请先取消选择其中一个现有应用程序,然后单击 “添加应用程序”。
-
视频:WAN 保证概述
Juniper MIST WAN Assurance delivers insights and troubleshooting driven by MIST AI into the WAN, exposing many factors that impact user experience across your distributed enterprise. WAN Assurance complements your SD-WAN deployment and is focused on delivering the best user experience, from client to the cloud. SD-WAN solutions dynamically optimize traffic flows across the WAN based on an SLA policy for your applications.
However, these SLAs are set once at the beginning and don't account for changes over time that impact the WAN, rendering these static SLAs ineffective. In contrast, WAN Assurance is centered around the concept of the user minute, which is represented by Service Level Expectations, or SLE for short. If a user is experiencing a poor Microsoft Teams call, then the user is having bad user minutes.
Let's see what this looks like in a Juniper Cloud instance. From the monitor view, we select WAN, choosing from the time frame over the last seven days, and we see three SLEs for the WAN. The first one is Gateway Health, which accounts for the overall state of the SRX WAN Edge device itself.
We track CPU, memory, temperature, fan, and power, all of which account for the overall device health. WAN Link Health represents the overall state of the WAN connections to the device. It tracks IPsec status, routing, and the WAN interfaces.
Thirdly, there's App Experience, which accounts for factors that impact application performance based on traffic. This SLE tracks latency, jitter, packet loss, and round-trip time. Together, these three SLEs describe how WAN performance is impacting overall user experience.
Let's ask Marvis what's happening with Microsoft Teams. By simply typing, obvious Teams call is bad, Marvis begins a root cause analysis. Marvis first responds by listing five Teams sessions from the past 24 hours.
We select the troublesome session from the list. Marvis quickly responds that the bad Teams experience was due to high latency on the Gateway SRX. Marvis also shows where the issue is in a simplified network diagram.
It displays how Abhi's MacBook is connected wirelessly to an access point, which in turn is connected to an EX access switch, and finally, the traffic is sent to the WAN via the SRX gateway. Marvis visually shows how each of these points in the network are impacting user experience. We see the AP and the gateway devices may be impacting experience.
We click the AP first. There is some non-Wi-Fi interference in the 5GIG band that could be impacting users. Next, we select the gateway device.
We see it has high latency in one of its WAN links due to slow response from the application server. Marvis makes it that easy to determine root cause analysis of issues impacting user experience. By correlating across Wi-Fi, wired, and WAN, we are able to drive a better user experience within our sites, out of our sites, from client to cloud.
视频:使用 SLE 排解 WAN 问题
Looking at our recently deployed Cupertino site, we can see that it is not meeting Service Levels. Clicking into the site, we get a closer look at the SLEs. They are broken down into three important health categories that play a role in user experience: the WAN Edge device health, the health of WAN links and paths, and the health of applications themselves. Each SLE is broken down into a simple unit of measure for the user experience called a User Minute.
Simply put, this is telling us what our user experiences on the WAN are per user, per minute. Behind these seemingly simple measurements are the complex and powerful AI models of the Mist Cloud, fed by rich telemetry from the Session Smart Network. For each SLE, we get a breakdown of the root cause of the issues identified. Whenever user experience is poor on the WAN, Mist not only tells us the root cause, but also tells us what was affected, such as the impacted applications, users, links, paths and devices.
WAN SLE 块
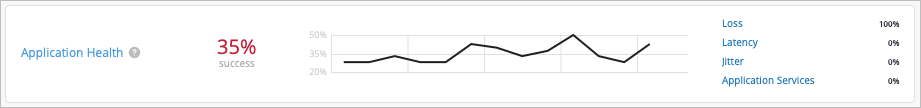
如以下示例所示,每个 SLE 块都提供了有价值的信息。
-
在左侧,您可以看到此服务级别体验 (SLE) 的成功率为 35%。选择“ 值筛选器” 按钮会显示一个数字。
-
时间线在中心显示时间段内的变化。您可以将鼠标指针悬停在任何点上以查看确切的时间和 SLE 结果。
-
右侧的分类器显示归因于每个根本原因的问题百分比。在此示例中,100% 的问题都归因于损失。
-
如果单击右侧的分类器,您将在“根本原因分析”页面上看到更多信息。大多数分类器都有子分类器,以便更好地了解确切原因。根本原因分析页面还提供了有关问题范围和影响的其他详细信息。
-
如果选择站点(位于页面顶部中心),则会显示 SLE 块。但是,当选择“整个组织”时,您会看到所有站点和所有 SLE 的高级摘要信息。
有关 WAN SLE 和分类器的详细信息,请参阅下表。
| SLE | SLE 说明 | 分类器 | 分类器说明 |
|---|---|---|---|
| WAN 边缘运行状况 | 瞻博网络 Mist 会在 WAN 边缘设备的运行状况或性能不理想时对用户进行监控。运行状况欠佳会降低设备传递流量的能力,直接影响连接到设备的任何客户端。 |
WAN 边缘断开连接 | 失去与瞻博网络 Mist 云的连接 |
| 系统 | 相对于容量而言,系统使用率较高 子分类器:
|
||
| 表容量 | 相对于容量而言,表条目数量较多 子分类器:
|
||
| DHCP 池 | DHCP 利用率相对于池大小较高 子分类器:
|
||
| WAN 链路运行状况 | 瞻博网络 Mist 会对 WAN 链路的运行状况达到或未达到 SLE 阈值时监控用户分钟数。不良的 WAN 链路运行状况会降低设备传递流量的能力,从而直接影响使用该链路的任何客户端。 |
网络 | 网络问题 子分类器:
|
| 接口 | 接口问题导致 WAN 链路运行状况故障的时间百分比。 子分类器:
|
||
| 应用运行状况 | 瞻博网络 Mist 可监控 WAN 应用的延迟,以识别性能欠佳的应用。 此 SLE 可以帮助您了解访问应用程序时的最终用户体验。例如,较弱的网络连接可能会为基于 FTP 或 SMTP 的应用提供良好的用户体验,但为 VoIP 应用提供糟糕的用户体验。 性能指标因设备而异:
要进行微调,您可以单击块上方的 “设置” 按钮以选择要包含或排除的单个应用程序。 |
抖动 | 数据包传输时间不一致 |
| 延迟 | 响应时间慢 (LAG) |
||
| 损失 | 数据包丢失 |
||
| 应用服务(仅限 SSR) | 应用请求响应缓慢、反复断开连接以及带宽不足等问题 子分类器:
|
||
| 网关带宽 | 瞻博网络 Mist 评估构成 SD-WAN 的 IPsec 叠加层。 使用此 SLE 可确定您的站点是否需要更多 WAN 带宽。 |
带宽余量 | 当前使用量超过基线,由过去 14 天内的最高使用量确定。 如果您启用了自动速度测试,这些结果也会合并到带宽裕量分类器中。在这种情况下,动态余量阈值基于最大使用率和速度测试结果(如果两者都可用)。 如果在组织设置中配置了速度测试,并且在 WAN Edge 模板、中心配置文件或 WAN Edge 设备的WAN设置中启用了速度测试。 |
| 拥塞上行链路(仅限 SRX) | 总传输丢弃字节数(TX 丢弃数)与传输数据包总数(TX 数据包)的比率较高。 |