对快速和千兆以太网接口执行环路测试
了解如何有效地对快速和千兆以太网接口执行环路测试。本指南提供了一个全面的核对表,用于诊断硬件和电路问题、创建和验证环路、配置 ARP 条目、清除接口统计信息,以及通过 ping 和错误检查进行故障排除。
对快速和千兆以太网接口使用环路测试的清单
目的
使用环路测试隔离快速和千兆以太网接口问题。
操作
下表提供了用于对快速和千兆以太网接口进行环路测试的链接和命令。
任务 |
命令或操作 |
|---|---|
| 诊断快速千兆以太网接口的可疑硬件问题 | |
将传输端口连接到接收端口。 |
|
将引脚 1 (TX+) 和引脚 3 (RX+) 交叉在一起,将引脚 2 (TX-) 和引脚 6 (RX-) 交叉在一起。 |
|
|
|
|
|
|
|
|
|
|
|
|
|
执行 中的 诊断快速千兆以太网接口的可疑硬件问题步骤 2 到 8。 |
|
诊断快速千兆以太网接口的可疑硬件问题
问题
当您怀疑硬件问题时,请执行以下步骤来帮助验证是否存在问题。
解决方案
要诊断以太网接口的可疑硬件问题,请按照下列步骤操作:
创建环回
您可以创建物理环路或配置本地环路来帮助诊断可疑的硬件问题。建议创建物理环回,因为它允许您测试和验证传输和接收端口。如果没有现场工程师创建物理环路,您可以为接口配置本地环路。本地环路在物理接口卡 (PIC) 内部创建环路。
为光纤接口创建物理环路
目的
通过测试发射端口和接收端口来验证光纤接口的功能。该测试通常由现场工程师执行,以确认连接的完整性。
操作
要在端口上创建物理环回,请使用已知良好的光纤电缆将传输端口连接到接收端口。
单模端口使用单模光纤,多模端口使用多模光纤。
意义
创建并测试物理环路时,实际上是在测试 PIC 的传输和接收功能。此过程可对 PIC 进行全面测试,确认两个端口均可运行,并且光纤连接是否按预期工作。
另请参阅
为 RJ-45 以太网接口创建环路插头
目的
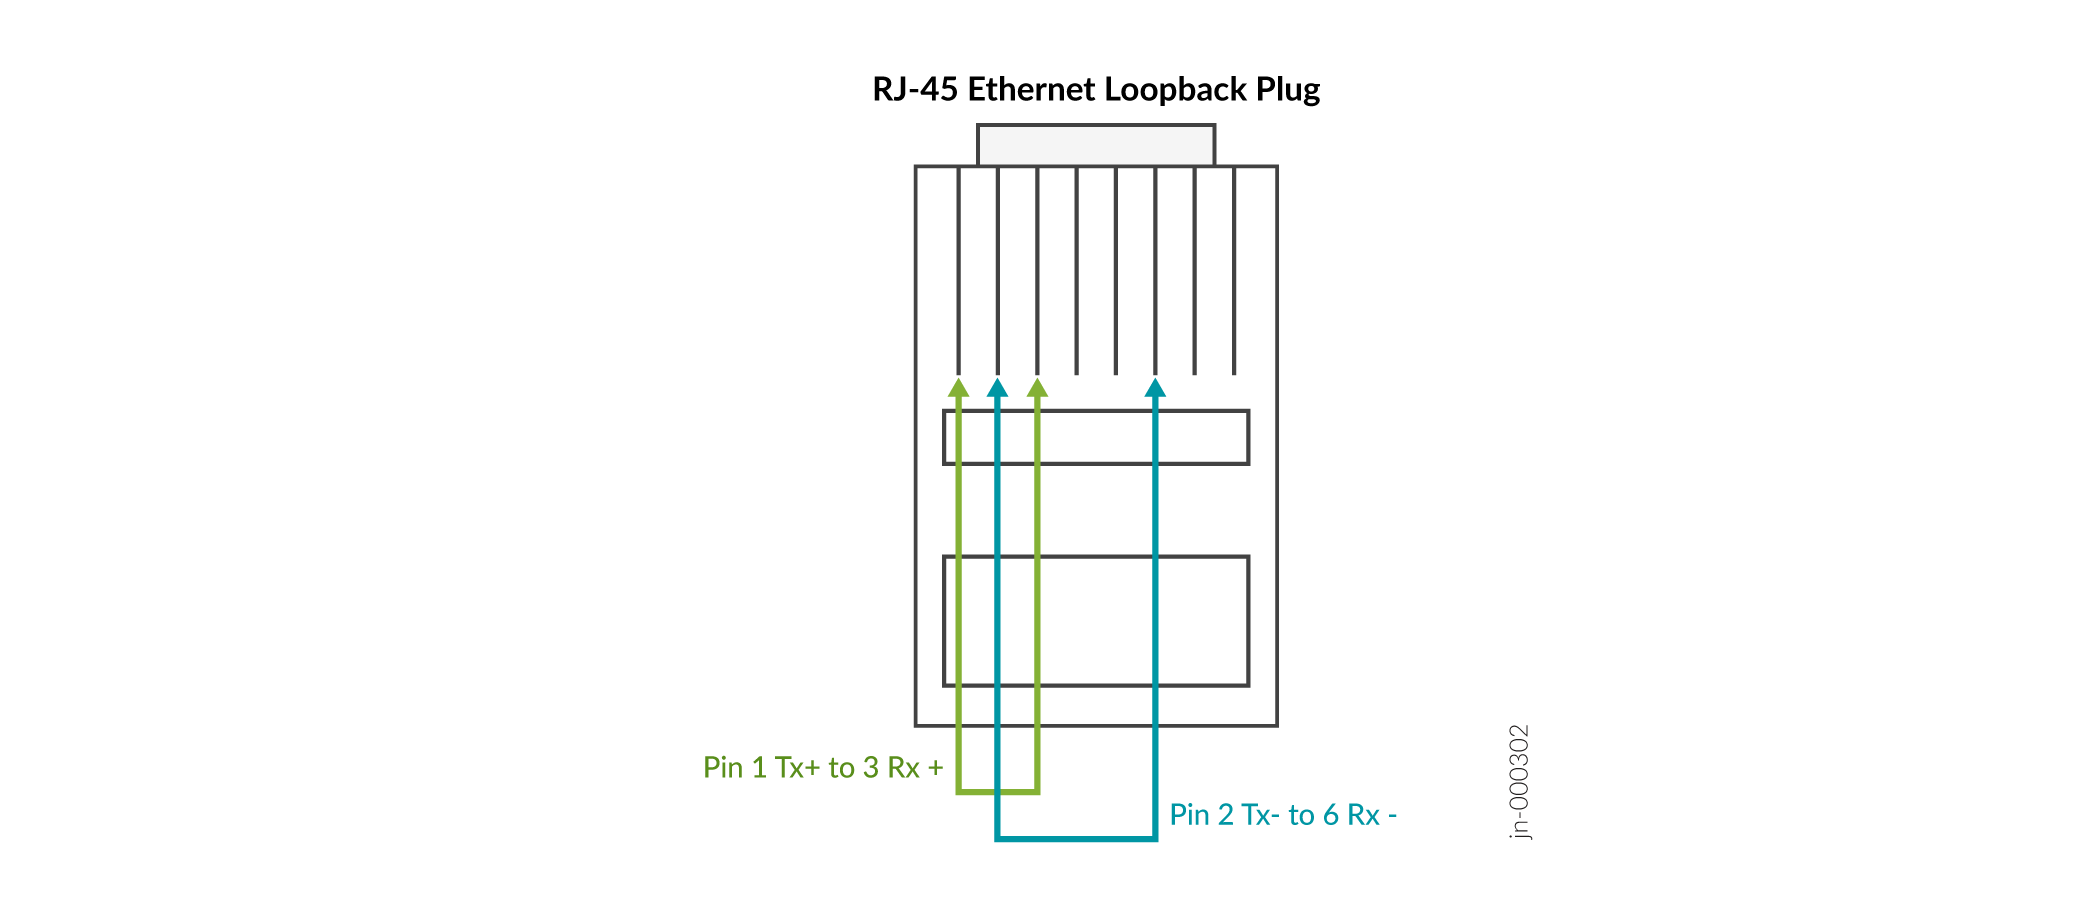
通过创建允许测试接口发射和接收功能的物理环路插头来验证 RJ-45 以太网接口的功能。
操作
要创建环路插头,请将交叉引脚 1 (TX+) 和引脚 3 (RX+) 放在一起,并将交叉引脚 2 (TX-) 和引脚 6 (RX-) 放在一起。您需要以下设备来创建环回:
-
一根 6 英寸长的 CAT5 电缆
-
RJ-45 连接器
-
压接工具
图 1 说明了如何为 RJ-45 以太网接口创建环路插头。
意义
创建并测试物理环回时,您正在测试 PIC 的 RJ-45 接口。如果有现场工程师可以创建物理环路,建议执行此操作,因为它提供了更完整的 PIC 测试。
另请参阅
配置本地环路
目的
在以太网接口上配置本地环路,用于在没有传输端口和接收端口之间物理连接的情况下测试 PIC 的内部功能。
操作
若要配置本地环回而不将传输端口物理连接到接收端口,请执行以下步骤:
在配置模式下,转到以下层次结构级别:
[edit] user@host# edit interfaces
interface-name(fastether-options | gigether-options)配置本地环路:
[edit interfaces
interface-name(fastether-options | gigether-options)] user@host# set loopback验证配置:
user@host# show
例如:
[edit interfaces fe-1/0/0 fastether-options]
user@host# show loopback
提交更改:
user@host# commit
例如:
[edit interfaces fe-1/0/0 fastether-options]
user@host# commit
commit complete
创建本地环回时,将在正在测试的接口上创建内部环路。本地环回在该 PIC 上内部循环流量。本地环回测试 PIC 的互连,但不测试发送和接收端口。在以太网接口上,您无法创建远程环回,因此没有使用 local or remote 语句的选项。只需在层次结构级别包含loopback[edit interfaces interface-name (fastether-options | gigether-options]语句,即可将接口置于本地环回模式。
完成测试后,删除 loopback 语句。
意义
配置本地环路会在接口上对流量进行内部环路,并验证 PIC 的内部连接。show 命令将在接口配置中显示环路语句,确认接口处于环路模式。请记住在测试后删除环路配置。
验证快速千兆以太网接口是否已开启
目的
显示快速千兆以太网接口的状态,以提供确定物理链路是打开还是关闭所需的信息。
操作
要验证快速千兆以太网接口的状态是否为启动,请使用以下 Junos OS 命令行界面 (CLI) 操作模式命令:
user@host> show interfaces (fe-fpc/port|ge-fpc/pic/port)
示例输出
user@host# show interfaces ge-4/0/6 extensivePhysical interface: ge-4/0/6, Enabled, Physical link is UpInterface index: 144, SNMP ifIndex: 516, Generation: 147 Link-level type: Ethernet, MTU: 1514, Speed: 1000mbps, BPDU Error: None, MAC-REWRITE Error: None,Loopback: Enabled, Source filtering: Disabled, Flow control: Enabled, Auto-negotiation: Enabled, Remote fault: Online Device flags : Present Running Loop-Detected Interface flags: SNMP-Traps Internal: 0x4000 Link flags : None CoS queues : 8 supported, 4 maximum usable queues Schedulers : 0 Hold-times : Up 0 ms, Down 0 ms Current address: 00:1f:12:fe:c5:2e, Hardware address: 00:1f:12:fe:c5:2e Last flapped : 2015-01-20 23:40:04 PST (00:02:12 ago) Statistics last cleared: Never Traffic statistics: Input bytes : 0 0 bps Output bytes : 0 0 bps Input packets: 0 0 pps Output packets: 0 0 pps IPv6 transit statistics: Input bytes : 0 Output bytes : 0 Input packets: 0 Output packets: 0 Dropped traffic statistics due to STP State: Input bytes : 0 Output bytes : 0 Input packets: 0 Output packets: 0 Input errors: Errors: 0, Drops: 0, Framing errors: 0, Runts: 0, Policed discards: 0, L3 incompletes: 0, L2 channel errors: 0, L2 mismatch timeouts: 0, FIFO errors: 0, Resource errors: 0 Output errors: Carrier transitions: 1, Errors: 0, Drops: 0, Collisions: 0, Aged packets: 0, FIFO errors: 0, HS link CRC errors: 0, MTU errors: 0, Resource errors: 0 Egress queues: 8 supported, 4 in use Queue counters: Queued packets Transmitted packets Dropped packets 0 best-effort 0 0 0 1 expedited-fo 0 0 0 2 assured-forw 0 0 0 3 network-cont 0 0 0 Queue number: Mapped forwarding classes 0 best-effort 1 expedited-forwarding 2 assured-forwarding 3 network-controlActive alarms : NoneActive defects : None MAC statistics: Receive Transmit Total octets 0 0 Total packets 0 0 Unicast packets 0 0 Broadcast packets 0 0 Multicast packets 0 0 CRC/Align errors 0 0 FIFO errors 0 0 MAC control frames 0 0 MAC pause frames 0 0 Oversized frames 0 Jabber frames 0 Fragment frames 0 VLAN tagged frames 0 Code violations 0 Filter statistics: Input packet count 0 Input packet rejects 0 Input DA rejects 0 Input SA rejects 0 Output packet count 0 Output packet pad count 0 Output packet error count 0 CAM destination filters: 0, CAM source filters: 0 Autonegotiation information: Negotiation status: Complete Link partner: Link mode: Full-duplex, Flow control: Symmetric/Asymmetric, Remote fault: OK Local resolution: Flow control: Symmetric, Remote fault: Link OK Packet Forwarding Engine configuration: Destination slot: 4 CoS information: Direction : Output CoS transmit queue Bandwidth Buffer Priority Limit % bps % usec 0 best-effort 95 950000000 95 0 low none 3 network-control 5 50000000 5 0 low none Interface transmit statistics: Disabled
意义
示例输出显示链路已启动,且此环路配置中没有报警。配置内部环路后,物理环路应在不发出警报的情况下启动。
示例输出
当您看到物理链路已关闭时,端口可能有问题。以下输出是物理链路关闭时 show interfaces fe-fpc/pic/port 命令的示例:
user@router> show interfaces fe-1/3/0
Physical interface: fe-1/3/0, Enabled, Physical link is Down
  Interface index: 44, SNMP ifIndex: 35
  Link-level type: Ethernet, MTU: 1514, Source filtering: Disabled
  Speed: 100mbps, Loopback: Disabled, Flow control: Enabled
  Device flags   : Present Running Down
  Interface flags: Hardware-Down SNMP-Traps
  Link flags     : None
  Current address: 00:90:69:8d:2c:db, Hardware address: 00:90:69:8d:2c:db
  Input rate     : 0 bps (0 pps), Output rate: 0 bps (0 pps)
  Active alarms  : LINK
  Active defects : LINK
  MAC statistics:
    Input octets: 0, Input packets: 0, Output octets: 0, Output packets: 0
  Filter statistics:
    Filtered packets: 0, Padded packets: 0, Output packet errors: 0
  Autonegotiation information:
    Negotiation status: Incomplete, Link partner status: Down
    Reason: Link partner autonegotiation failure
    Link partner: Half-duplex, Flow control: None
意义
示例输出显示物理链路已关闭,并且存在活动报警和缺陷。
表 2 显示已关闭物理链路的问题情况和操作。
问题 |
操作 |
|---|---|
电缆不匹配 |
验证光纤连接是否正确。 |
电缆损坏和/或脏污 |
验证光纤是否可以成功环路已知良好的相同类型端口。 |
光衰减过多或过少 |
根据 PIC 光学规格,验证衰减是否正确。 |
传输端口未在规格规定的 dBm 光学范围内传输 |
验证光学器件的发射功率是否在 PIC 光学规格的范围内。 |
电缆类型和端口不匹配 |
验证单模光纤电缆是否连接到单模接口,以及多模光缆是否连接到多模接口。(此问题并不总是导致物理链路中断;有时会导致错误和丢包。) |
配置静态地址解析协议表条目
目的
配置静态地址解析协议 (ARP) 条目,以允许数据包从环路以太网接口发送出去。
完成测试并监控接口流量后,请移除循环测试结束时的静态 ARP 条目。
操作
要为千兆以太网接口配置静态 ARP 表条目,请执行以下步骤。您可以按照相同的过程为快速千兆以太网接口配置静态 ARP 条目。
查找千兆以太网接口的媒体访问控制 (MAC) 地址:
user@host>
show interfaces ge-fpc/pic/portPhysical interface: ge-4/0/6, Enabled, Physical link is Up Interface index: 144, SNMP ifIndex: 516, Generation: 147 Link-level type: Ethernet, MTU: 1514, Speed: 1000mbps, BPDU Error: None, MAC-REWRITE Error: None, Loopback: Enabled, Source filtering: Disabled, Flow control: Enabled, Auto-negotiation: Enabled, Remote fault: Online Device flags : Present Running Loop-Detected Interface flags: SNMP-Traps Internal: 0x4000 Link flags : None CoS queues : 8 supported, 4 maximum usable queues Schedulers : 0 Hold-times : Up 0 ms, Down 0 ms
Current address: 00:1f:12:fe:c5:2e, Hardware address: 00:1f:12:fe:c5:2eLast flapped : 2015-01-20 23:40:04 PST (00:13:49 ago) Statistics last cleared: 2015-01-20 23:46:15 PST (00:07:38 ago) Traffic statistics: Input bytes : 125500 0 bps Output bytes : 125482 0 bps Input packets: 1281 0 pps Output packets: 1281 0 pps IPv6 transit statistics: Input bytes : 0 Output bytes : 0 Input packets: 0 Output packets: 0 Dropped traffic statistics due to STP State: Input bytes : 0 Output bytes : 0 Input packets: 0 Output packets: 0 Input errors: Errors: 0, Drops: 0, Framing errors: 0, Runts: 0, Policed discards: 0, L3 incompletes: 0, L2 channel errors: 0, L2 mismatch timeouts: 0, FIFO errors: 0, Resource errors: 0 Output errors: Carrier transitions: 0, Errors: 0, Drops: 0, Collisions: 0, Aged packets: 0, FIFO errors: 0, HS link CRC errors: 0, MTU errors: 0, Resource errors: 0 Egress queues: 8 supported, 4 in use Queue counters: Queued packets Transmitted packets Dropped packets 0 best-effort 1260 1260 0 1 expedited-fo 0 0 0 2 assured-forw 0 0 0 3 network-cont 0 0 0 Queue number: Mapped forwarding classes 0 best-effort 1 expedited-forwarding 2 assured-forwarding 3 network-control Active alarms : None Active defects : None MAC statistics: Receive Transmit Total octets 130624 130624 Total packets 1281 1281 Unicast packets 1280 1280 Broadcast packets 1 1 Multicast packets 0 0 CRC/Align errors 0 0 FIFO errors 0 0 MAC control frames 0 0 MAC pause frames 0 0 Oversized frames 0 Jabber frames 0 Fragment frames 0 VLAN tagged frames 0 Code violations 0 Filter statistics: Input packet count 1281 Input packet rejects 0 Input DA rejects 0 Input SA rejects 0 Output packet count 1281 Output packet pad count 0 Output packet error count 0 CAM destination filters: 0, CAM source filters: 0 Autonegotiation information: Negotiation status: Complete Link partner: Link mode: Full-duplex, Flow control: Symmetric/Asymmetric, Remote fault: OK Local resolution: Flow control: Symmetric, Remote fault: Link OK Packet Forwarding Engine configuration: Destination slot: 4 CoS information: Direction : Output CoS transmit queue Bandwidth Buffer Priority Limit % bps % usec 0 best-effort 95 950000000 95 0 low none 3 network-control 5 50000000 5 0 low none Interface transmit statistics: Disabled Logical interface ge-4/0/6.0 (Index 72) (SNMP ifIndex 573) (Generation 137) Flags: SNMP-Traps 0x4004000 Encapsulation: ENET2 Traffic statistics: Input bytes : 125500 Output bytes : 123480 Input packets: 1281 Output packets: 1260 Local statistics: Input bytes : 60 Output bytes : 2002 Input packets: 1 Output packets: 21 Transit statistics: Input bytes : 0 0 bps Output bytes : 0 0 bps Input packets: 0 0 pps Output packets: 0 0 pps Security: Zone: HOST Allowed host-inbound traffic : any-service bfd bgp dvmrp igmp ldp msdp nhrp ospf pgm pim rip router-discovery rsvp sap vrrp Flow Statistics : Flow Input statistics : Self packets : 0 ICMP packets : 40 VPN packets : 0 Multicast packets : 0 Bytes permitted by policy : 107520 Connections established : 20 Flow Output statistics: Multicast packets : 0 Bytes permitted by policy : 107520 Flow error statistics (Packets dropped due to): Address spoofing: 0 Authentication failed: 0 Incoming NAT errors: 0 Invalid zone received packet: 0 Multiple user authentications: 0 Multiple incoming NAT: 0 No parent for a gate: 0 No one interested in self packets: 0 No minor session: 0 No more sessions: 0 No NAT gate: 0 No route present: 11 No SA for incoming SPI: 0 No tunnel found: 0 No session for a gate: 0 No zone or NULL zone binding 0 Policy denied: 0 Security association not active: 0 TCP sequence number out of window: 0 Syn-attack protection: 0 User authentication errors: 0 Protocol inet, MTU: 1500, Generation: 158, Route table: 0 Flags: Sendbcast-pkt-to-re Addresses, Flags: Is-Preferred Is-Primary Destination: 10.108.120.0/30, Local: 10.108.120.1, Broadcast: 10.108.120.3, Generation: 158 Protocol multiservice, MTU: Unlimited, Generation: 159, Route table: 0 Policer: Input: __default_arp_policer__在配置模式下,转到以下层次结构级别:
[edit] user@host# edit interfaces
interface-nameunitlogical-unit-numberfamily inet addressaddress配置静态 ARP 条目:
user@host# set arp
ip-addressmacmac-address提交配置:
user@host# commit
验证是否安装了静态 ARP 条目:
[edit interfaces ge-4/0/6 unit 0 family inet address 10.108.120.1/30]
user@host# run show arp no-resolve
MAC Address       Address         Interface     Flags
00:1f:12:fe:c5:2e 10.108.120.2    ge-4/0/6.0           permanent
52:54:00:7d:33:4c 10.204.128.35   fxp0.0               none
52:54:00:65:11:50 10.204.128.36   fxp0.0               none
52:54:00:da:30:82 10.204.128.37   fxp0.0               none
52:54:00:3a:cf:4b 10.204.128.38   fxp0.0               none
52:54:00:de:88:5f 10.204.128.45   fxp0.0               none
52:54:00:48:03:b7 10.204.128.46   fxp0.0               none
意义
示例输出用于步骤 1 到步骤 5,显示在千兆以太网接口 ge-4/0/6上配置了静态 ARP 条目。
清除快速和千兆位以太网接口统计信息
Ping 快速千兆以太网接口
目的
使用 ping 命令验证环路连接。
操作
要从以太网接口发送 ping 数据包,请使用以下 Junos OS CLI 操作模式命令:
user@host> pingremote-IP-addressbypass-routing interface (fe-fpc/pic/port| ge-fpc/pic/port) count 100 rapid
示例输出
user@router> ping 10.108.120.2 bypass-routing interface ge-7/2/1 count 100 rapid
PING 10.108.120.2 (10.108.120.2): 56 data bytes
36 bytes from 10.108.120.1: Time to live exceeded
Vr HL TOS  Len   ID Flg  off TTL Pro  cks      Src      Dst
 4  5  00 0054 e871   0 0000  01  01 cc5c 10.108.120.1  10.108.120.2
.36 bytes from 10.108.120.1: Time to live exceeded
Vr HL TOS  Len   ID Flg  off TTL Pro  cks      Src      Dst
 4  5  00 0054 e874   0 0000  01  01 cc59 10.108.120.1  10.108.120.2
.36 bytes from 10.108.120.1: Time to live exceeded
Vr HL TOS  Len   ID Flg  off TTL Pro  cks      Src      Dst
 4  5  00 0054 e878   0 0000  01  01 cc55 10.108.120.1  10.108.120.2
.36 bytes from 10.108.120.1: Time to live exceeded
Vr HL TOS  Len   ID Flg  off TTL Pro  cks      Src      Dst
 4  5  00 0054 e87c   0 0000  01  01 cc51 10.108.120.1  10.108.120.2
.36 bytes from 10.108.120.1: Time to live exceeded
Vr HL TOS  Len   ID Flg  off TTL Pro  cks      Src      Dst
 4  5  00 0054 e880   0 0000  01  01 cc4d 10.108.120.1  10.108.120.2
.36 bytes from 10.108.120.1: Time to live exceeded
Vr HL TOS  Len   ID Flg  off TTL Pro  cks      Src      Dst
 4  5  00 0054 e884   0 0000  01  01 cc49 10.108.120.1  10.108.120.2
.36 bytes from 10.108.120.1: Time to live exceeded
意义
-
示例输出显示生存时间 (TTL) 已过期,表示链路正在从 ping 测试接收帧。
- MAC 地址与正在测试的端口的物理地址匹配,这允许端口接受来自 ping 测试的帧。
-
当数据包在链路上循环时,发送的每个 ping 命令都会显示一条“TTL exceededed”(超出 TTL) 消息。
-
生成这些消息的原因是 ping 数据包在路由器和物理环路之间反复循环。
-
当数据包到达链路的另一端(不存在)时,环路会将其发送回同一接口,数据包转发引擎结构会再次将其路由到该接口。
-
每次路由查找后,TTL 都会降低,数据包将通过环路接口发出,直到 TTL 过期,从而触发“TTL 过期”消息。
-
如果发生任何错误,则丢弃数据包,并显示超时错误,而不是 TTL 过期消息。
-
默认情况下,Junos OS 中 ICMP 回显数据包的 TTL 为 64,这意味着数据包必须循环 63 次才能生成“TTL 过期”消息;但是,您可以调整 TTL 值以更改测试的丢包容差,例如将其设置为 255,这要求数据包循环 254 次而不会出错,然后才会出现“TTL 过期”消息。
检查快速千兆以太网接口错误统计信息
目的
持续接口错误统计信息表明您需要向瞻博网络技术援助中心 (JTAC) 提交案例。
操作
要检查本地接口的错误统计信息,请使用以下 Junos OS CLI 操作模式命令:
user@host>show interfaces (fe-fpc/pic/port| ge-fpc/pic/port) extensive
示例输出
user@router> show interfaces ge-4/0/6 extensivePhysical interface: ge-4/0/6, Enabled, Physical link is UpInterface index: 144, SNMP ifIndex: 516, Generation: 147 Link-level type: Ethernet, MTU: 1514, Speed: 1000mbps, BPDU Error: None, MAC-REWRITE Error: None,Loopback: Enabled, Source filtering: Disabled, Flow control: Enabled, Auto-negotiation: Enabled, Remote fault: Online Device flags : Present Running Loop-Detected Interface flags: SNMP-Traps Internal: 0x4000 Link flags : None CoS queues : 8 supported, 4 maximum usable queues Schedulers : 0 Hold-times : Up 0 ms, Down 0 ms Current address: 00:1f:12:fe:c5:2e, Hardware address: 00:1f:12:fe:c5:2e Last flapped : 2015-01-20 23:40:04 PST (00:02:12 ago) Statistics last cleared: Never Traffic statistics: Input bytes : 0 0 bps Output bytes : 0 0 bps Input packets: 0 0 pps Output packets: 0 0 pps IPv6 transit statistics: Input bytes : 0 Output bytes : 0 Input packets: 0 Output packets: 0 Dropped traffic statistics due to STP State: Input bytes : 0 Output bytes : 0 Input packets: 0 Output packets: 0 Input errors: Errors: 0, Drops: 0, Framing errors: 0, Runts: 0, Policed discards: 0, L3 incompletes: 0, L2 channel errors: 0, L2 mismatch timeouts: 0, FIFO errors: 0, Resource errors: 0 Output errors: Carrier transitions: 1, Errors: 0, Drops: 0, Collisions: 0, Aged packets: 0, FIFO errors: 0, HS link CRC errors: 0, MTU errors: 0, Resource errors: 0 Egress queues: 8 supported, 4 in use Queue counters: Queued packets Transmitted packets Dropped packets 0 best-effort 0 0 0 1 expedited-fo 0 0 0 2 assured-forw 0 0 0 3 network-cont 0 0 0 Queue number: Mapped forwarding classes 0 best-effort 1 expedited-forwarding 2 assured-forwarding 3 network-controlActive alarms : NoneActive defects : None MAC statistics: Receive Transmit Total octets 0 0 Total packets 0 0 Unicast packets 0 0 Broadcast packets 0 0 Multicast packets 0 0 CRC/Align errors 0 0 FIFO errors 0 0 MAC control frames 0 0 MAC pause frames 0 0 Oversized frames 0 Jabber frames 0 Fragment frames 0 VLAN tagged frames 0 Code violations 0 Filter statistics: Input packet count 0 Input packet rejects 0 Input DA rejects 0 Input SA rejects 0 Output packet count 0 Output packet pad count 0 Output packet error count 0 CAM destination filters: 0, CAM source filters: 0 Autonegotiation information: Negotiation status: Complete Link partner: Link mode: Full-duplex, Flow control: Symmetric/Asymmetric, Remote fault: OK Local resolution: Flow control: Symmetric, Remote fault: Link OK Packet Forwarding Engine configuration: Destination slot: 4 CoS information: Direction : Output CoS transmit queue Bandwidth Buffer Priority Limit % bps % usec 0 best-effort 95 950000000 95 0 low none 3 network-control 5 50000000 5 0 low none Interface transmit statistics: Disabled
意义
检查是否有任何错误统计信息。不应有任何输入或输出错误。如果持续存在任何输入或输出错误,请向瞻博网络技术援助中心 (JTAC) support@juniper.net提交案例,电话为 1-888-314-JTAC(美国境内)或 1-408-745-9500(美国境外)。
诊断可疑电路问题
目的
当您怀疑电路问题时,请务必与传输层工程师合作解决问题。传输层工程师可以从网络的各个点创建到路由器的环路。然后,您可以执行测试来验证从路由器到网络中该环路的连接。
操作
在传输层工程师创建从网络到路由器的环路后,您必须验证从路由器到网络中环路的连接。按照 中的步骤 2 到 步骤 8 诊断快速千兆以太网接口的可疑硬件问题进行操作。测试中遇到的任何问题均表明从路由器到网络中的环路的连接存在问题。
通过在网络中的各个点对环回执行测试,可以隔离问题的根源。