Paragon Active Assurance — VoIP UDP Monitor

Juniper Learning Byte: Configuring the VoIP UDP with a monitor
Juniper’s Zach Gibbs covers how to configure the VoIP UDP task with a monitor using the Control Center Web Interface. This video is most appropriate for users who are new to working with Paragon Active Assurance.
You’ll learn
An example of the topology involved in the configuration, including set up type, duration, coded, etc.
How the control center communicates with the test agents over the management network
How to run the monitor and examine the results
Who is this for?
Host
Transcript
00:00 [Music]
00:13 hello my name is zach gibbs and i am a
00:16 content developer within education
00:18 services inside juniper networks
00:21 and today we will be going through the
00:23 paragon active assurance voip udp
00:26 monitor learning byte
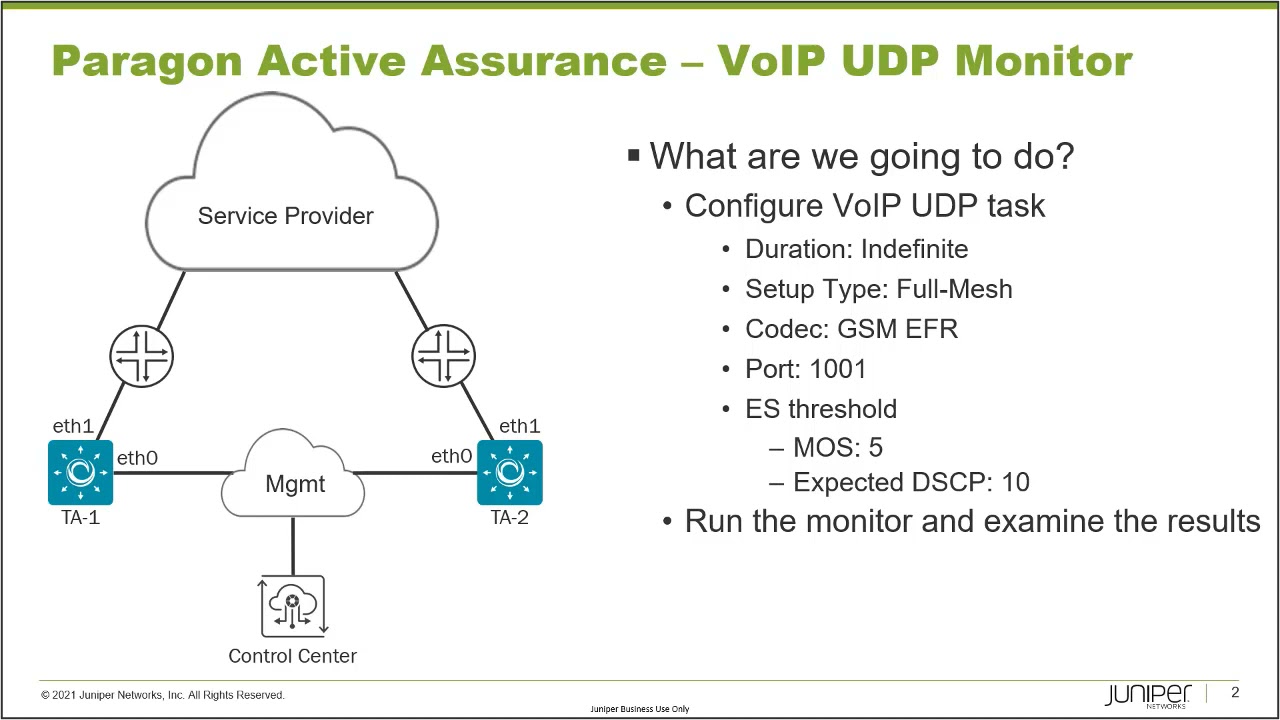
00:29 all right so here is our topology in
00:31 this topology we have three main devices
00:33 that we are concerned about we have ta1
00:36 and ta2 which are test agents and then
00:38 we have the control center and the
00:40 control center communicates with both
00:43 test agents over the management network
00:45 and both those test agents use eth0 to
00:47 connect to the management network and
00:49 then ta1 and ta2 use eth1 to connect
00:53 into the service provider production
00:55 network and so with that being said what
00:57 are we trying to do with this learning
00:58 braid well we want to configure a voip
01:01 udp task since this is a monitor the
01:04 duration is going to be indefinite
01:05 that's just how monitors run the setup
01:08 type is going to be full mesh the codec
01:10 we are going to be using is the gsm efr
01:12 codec we're going to be using port 1001
01:15 and for error seconds threshold we want
01:18 to set the mos value to 5 and the
01:20 expected dcp value to 10. now with this
01:23 task what it does is it simulates
01:26 voip media flows using you guessed it
01:29 udp hence the name voip udp for the task
01:32 and so these flows use a specific voice
01:35 codec that's either g
01:37 711 g.723 g.729 or gsm efr and in this
01:43 learning byte we will be using the gsm
01:45 efr coding and so we can run this task
01:48 as a hub and spoke topology or as a full
01:50 mesh topology we're going to be using
01:52 full mesh for this learning bite and so
01:53 this task basically allows you to see
01:55 the effect your network has on voip
01:57 traffic is my network going to work with
02:00 voip traffic is what you have to ask
02:01 yourself here and this is what this
02:02 helps you do and so to do this we have a
02:05 mos scale and what that stands for is
02:07 mean opinion scale and this mos score is
02:10 calculated by the task by using the
02:12 jitter and packet loss of the flow and
02:14 so if you have high jitter high packet
02:15 loss you're going to get a lower mos
02:17 score now with that
02:19 the mos score can range from five to one
02:22 one being the worst five being the best
02:25 and notice how for this learning byte
02:26 we're going to set a mos score of five
02:29 and see how that is now one thing i want
02:31 to point out it's actually really kind
02:32 of hard to achieve a mos score of five
02:34 and so if we don't get a mos score five
02:36 we'll drop it down just so we can see
02:38 what it looks like uh when it fails and
02:40 also when it passes okay so when this
02:43 test starts what happens is the test
02:45 agents will generate traffic
02:47 at a fixed rate and also frame size the
02:49 rate and the frame size is based on what
02:52 codec we're going to use for example if
02:53 we chose the g.711 uh for the codec the
02:57 bit rate is going to be 87.2 kilobits
03:00 per second and the frame size will be
03:02 218. so 218 bytes
03:05 so keep that in mind how this works it's
03:06 based on the codec we used and then with
03:08 task we're going to set the mos score we
03:10 want
03:11 and see if it actually passes
03:13 and so with that let's go ahead and jump
03:16 to the web interface for control center
03:18 and get this going
03:20 all right so here is the web interface
03:22 for the control center let's go to
03:24 monitoring new monitor
03:27 and we'll create this monitor we'll call
03:28 this
03:29 voip udp lb
03:32 for learning byte and then we'll select
03:34 the voip udp task
03:37 and notice how this is a puzzle piece
03:39 task which means we can add additional
03:41 tasks for this monitor but for this
03:43 learning byte we're just going to focus
03:45 on the voip udp task
03:47 okay so with that setup type full mesh
03:50 and the clients we're going to say ta1
03:52 eth1 and ta2 ethernet that's very
03:54 important select the right interface for
03:56 the different test agents or they're not
03:58 going to be able to communicate with
03:59 each other very well okay number flows
04:01 we didn't specify that in our criteria
04:03 but we can leave that at one that's fine
04:05 and the codec remember we are selecting
04:07 the gsm efr codec
04:09 and the port let's set that to 1001
04:13 and then the thresholds for aired
04:16 seconds
04:17 remember we want to set that to 5.
04:21 and then the expected dacp value i'm
04:23 going to set that to 10. now recall that
04:26 1-5 is what you can have the mos score
04:29 set to and five being the best so we're
04:32 expecting the best possible results
04:34 so with that i'm going to start the
04:36 monitor
04:38 and we're going to start without a
04:40 report we don't need that here for our
04:41 learning byte if this was a production
04:43 network highly recommend you to set up
04:45 periodic reports
04:48 and the monitor is getting started it
04:50 takes just a minute to get a monitor
04:52 started so it'll just be another few
04:54 seconds and then we'll start seeing some
04:55 results all right so we're seeing some
04:57 results and
04:59 as you can see here we have
05:02 black which means
05:03 50 percent is aired seconds 50 or more
05:06 that is and that's not good that's not
05:10 what we want to see so we have to ask
05:11 ourselves why are we getting this low
05:13 score so recall that with our air
05:15 seconds threshold we have either
05:18 a mos score that is less than five or a
05:21 dacp value that is
05:23 not 10 that is being received and you
05:25 can see here right off the bat that the
05:27 mos score is not five it's at four point
05:29 three which is still really good four is
05:32 good four and above is actually a really
05:33 good mos score but it's not perfect five
05:36 was basically perfect so there's no
05:38 packet loss but the jitter probably
05:40 isn't
05:41 where we want it to be we can select the
05:43 individual streams to get more
05:44 information about this
05:46 you can see here if we remove the air
05:48 second bar the rate we don't need to be
05:50 concerned about
05:53 and
05:54 here you can see the the jitter you can
05:56 see that how that's popping up like that
05:58 that's not what we're liking as far as
06:00 the mos score so that's why that's a
06:01 little lower and if we look at the table
06:03 we see more information here we can see
06:06 the that we have zero loss so that's
06:08 great
06:09 can't have any loss
06:10 we see the jitter here
06:13 and then we have
06:16 so es for dscp how much we're losing any
06:20 at all and we're not losing any so we're
06:21 not having any problems there but we are
06:23 getting 100 aired seconds and that's
06:25 because that mos value so let's go ahead
06:27 and close that and then let's
06:30 edit this on the fly that's the great
06:31 thing about monitors you can just edit
06:33 on the fly and let's change this to four
06:35 instead of five so recall that four is
06:38 really good
06:41 and let's save that and that bumps us
06:43 right back out to the monitor and this
06:45 will take just a minute to update and
06:47 you can see now we're getting some more
06:49 results we can see that the aired
06:51 seconds is no longer black
06:54 that is the air seconds bar we're
06:55 getting green here now on both streams
06:57 and that's really good to see and so we
06:59 can select this here
07:01 and let's go to table or we go back to
07:03 graph you can see here where the error
07:04 second started
07:06 not being
07:07 100 percent
07:09 in our case and we can look at the
07:12 error seconds here as
07:14 well you see it's 100
07:17 we can scroll down now we see it dropped
07:18 down to 60. and if we close that
07:21 and then open it again
07:23 that should actually look a little
07:24 better
07:25 we should have some additional results
07:27 in there
07:29 oh actually i misspoke we're only
07:30 showing errors so let's click show all
07:33 we should get a little better
07:34 information in there so there let me
07:36 scroll down
07:42 and then let's scroll over
07:44 and there you go so we can see where we
07:46 had sixty percent that's where things
07:48 are getting back to better then we have
07:49 zero percent zero percent zero percent
07:51 zero percent for that ten seconds there
07:53 that resolution window we had sixty
07:54 percent error seconds and then we
07:56 dropped to zero and the reason behind
07:58 that we have the mos score set to four
08:00 instead of five as far as what we want
08:03 for the air second threshold so things
08:05 look good there
08:09 so that does bring us to the end of this
08:10 learning byte so this learning byte we
08:12 demonstrated how to configure and run a
08:14 voip udp monitor so as always thanks for
08:18 watching
08:21 visit the juniper education services
08:23 website to learn more about courses
08:26 view our full range of classroom online
08:29 and e-learning courses
08:31 learning paths
08:33 industry segment and technology specific
08:36 training paths
08:37 juniper networks certification program
08:40 the ultimate demonstration of your
08:42 competence and the training community
08:45 from forums to social media join the
08:47 discussion
08:54 you