Paragon Active Assurance – Multicast UDP Test

Juniper Learning Byte: Perform a Multicast UDP test from start to finish.
Follow along to learn how to configure the Multicast UDP task with a test using the Control Center Web interface. Juniper’s Zach Gibbs will take you step by step through the process in this short but informative episode of Learning Bytes.
You’ll learn
What multicast traffic is and what it’s used for
How to test Multicast UDP connectivity between two servers
How to examine the results to see how well your network handles multicast traffic in terms of end-to-end delay, jitter, and packet loss
Who is this for?
Host
Transcript
0:00 [Music]
0:12 hello my name is zach gibbs and i'm a
0:15 content developer within education
0:17 services inside juniper networks and
0:20 today we will be going through the
0:22 paragon active assurance multicast udp
0:25 test learning byte
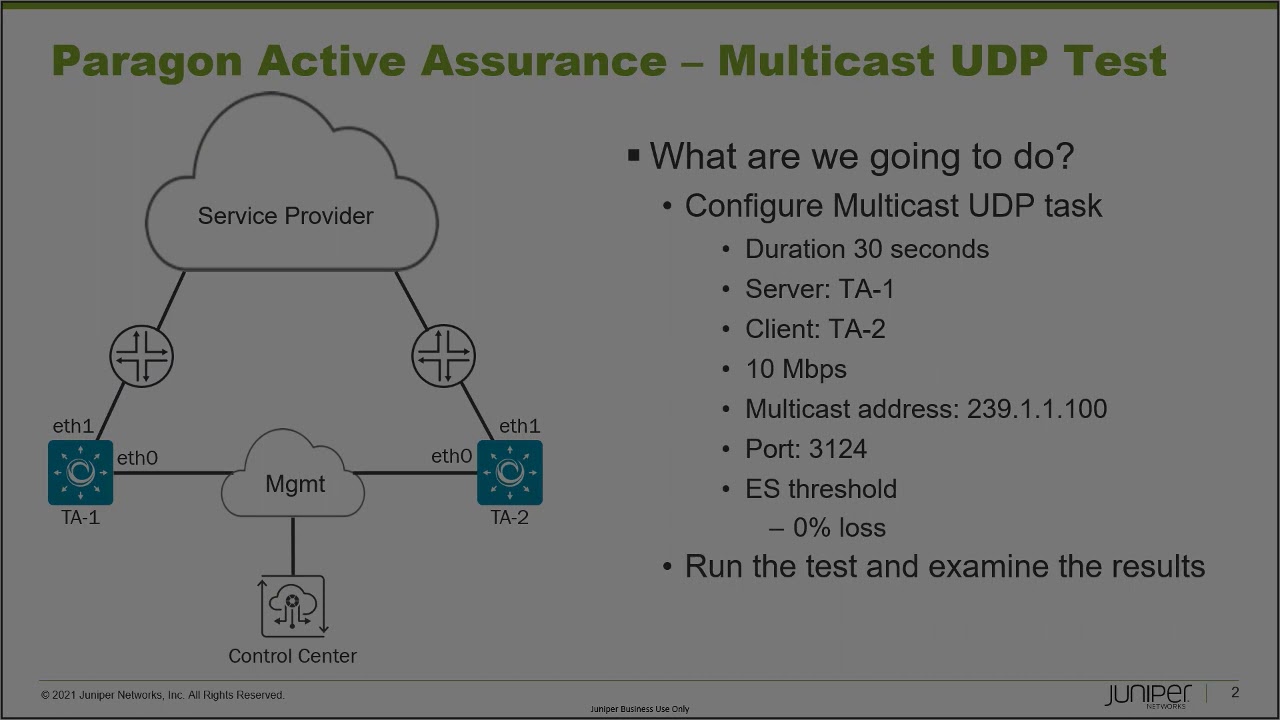
0:28 alright so here is the topology if you
0:31 have seen any of the other paragon
0:33 active assurance learning bytes that
0:34 i've created this topology will look
0:36 very familiar as it is the same but with
0:39 that being said let's go ahead and go
0:40 over the topology here we have three
0:43 main devices we want to be concerned
0:44 about that is ta1 ta2 and the control
0:47 center ta1 and ta2 use eth0 to connect
0:51 to the management network which then
0:53 allows connectivity with the control
0:55 center
0:55 and then ta1 and ta2 use eth1 to connect
0:59 into the service provider network all
1:01 right so what are we going to do with
1:03 this we are going to configure
1:05 the
1:06 multicast udp task and so first you
1:10 probably know what multicast traffic is
1:12 but just in case you don't multicast is
1:14 is normally used as a transport
1:16 mechanism for services such as iptv or
1:19 even updating pcs at the same time
1:22 so by using the multicast udp task here
1:25 like what we're doing we're going to be
1:26 able to figure out how the network
1:28 handles multicast traffic with things
1:30 like india and delay jitter and packet
1:32 loss as well as other things all right
1:34 so what this task does is it sends udp
1:37 multicast traffic from a server which in
1:40 our case is going to be ta1
1:43 and then ta2 which acts as a client is
1:46 going to receive the multicast traffic
1:48 and this would probably make a lot more
1:49 sense if we had more than just one
1:51 client because ta1 acts as the server
1:53 ta2 is the client but in the test bed i
1:55 only have the two test agents so with
1:57 this we're going to use just one client
2:00 but the concept holds true whether it's
2:01 one multicast client or many multicast
2:04 clients so when this task starts first
2:06 ta1 which remember is the server
2:09 generates multicast traffic towards the
2:11 destination multicast address which in
2:13 our case is 239.1.1.100
2:17 then ta2 which is the client tries to
2:19 join that multicast address and if ta2
2:22 is successful at joining the multicast
2:24 address
2:25 things like one-way delay jitter packet
2:27 loss and packet miss orderings are
2:29 recorded and we'll see
2:31 that in the results all right so with
2:33 that being said let's actually talk
2:35 about the specifics of the test
2:38 we're going to have a duration of 30
2:39 seconds as we talked about the servers
2:41 ta1 clients ta2 we're going to be
2:43 sending 10 megabits per second of
2:45 multicast traffic the multicast address
2:47 is 239 1.1.100 the port we're going to
2:50 use is three two one four
2:52 and then for error seconds thresholds
2:54 we're going to say zero percent loss so
2:56 we have any loss the test is going to
2:58 fail and so with that we're going to run
3:00 the test and examine the results and so
3:03 let's go ahead and jump to the control
3:05 center web interface and get this going
3:09 all right so here is the control center
3:11 web interface we're on the dashboard
3:12 let's go ahead and go to tests
3:14 and then new test sequence
3:17 and we'll call this
3:20 multicast udp
3:22 lb
3:24 learningbyte for short
3:25 and then we're going to select the
3:27 multicast udp
3:29 task and notice how this is a puzzle
3:32 piece so we could add additional tasks
3:34 in parallel if we wanted to but in our
3:36 case we're just focusing on the
3:37 multicast udp task
3:39 so we'll set the duration to 30 seconds
3:43 and then server we're going to select
3:45 ta1 and that's going to be eth1
3:47 very important select the right
3:48 interface there and ta2 eth1
3:52 and the rate remember that's going to be
3:54 10 megabits per second
3:56 and the multicast address is going to be
3:58 239.1 1.1.100
4:02 and then the
4:03 port is going to be three
4:05 one two four
4:07 and the
4:09 air seconds threshold we're just setting
4:10 the loss at zero percent and leaving it
4:13 at that we could specify the delay the
4:15 jitter the expected dscp value as well
4:18 but we don't need to do that for our
4:20 test
4:22 so let's go ahead and click the start
4:23 button
4:25 and you can see here that it is setting
4:27 the stream up and you can see we have
4:29 the one stream going ta1 to ta2 and you
4:32 can see here that we have no aired
4:33 seconds everything looks really good the
4:35 test is about to finish up and it is
4:38 done and
4:39 it passed it did not fail and remember
4:41 the only air seconds threshold we were
4:44 doing is loss and you can see here we
4:46 had zero percent loss we see the delay
4:48 as well is really low and so we let's
4:50 click on the actual stream itself have a
4:52 closer look
4:53 so here we can see the graph we can see
4:55 10 megabits per second straight across
4:57 no problems
4:58 we can see that there was no loss
5:00 everything looks good there let's go
5:02 ahead and get rid of the rate so we can
5:03 get a little more detail in what's going
5:06 on because if we have that rate selected
5:08 it
5:09 shows 10 megabits across the board and
5:11 everything else is so minimal you don't
5:13 actually see that so let's deselect that
5:15 rate
5:16 and have a closer look at things and so
5:18 here we have the average delay in
5:20 milliseconds
5:21 we can see that across the board
5:22 throughout the entire test very low
5:25 and we select loss and there's nothing
5:28 shown because loss was zero if loss had
5:30 shown up at all you would see it across
5:32 the graph as well
5:34 misordered packets was zero so nothing
5:36 shows up there we can do the minimum and
5:38 max delay and also jitter to get a
5:41 little more information and you can see
5:42 here the jitter definitely lines up with
5:45 the delay as well and so we can look at
5:46 the table as well to get this
5:48 information now since there wasn't any
5:50 errors we do have to select the show all
5:51 radio button and we see the individual
5:54 statistics as we go we can see the delay
5:56 for each second now remember this is a
5:58 test so it records the
6:00 data every single second it's got a one
6:02 second resolution window and you can see
6:04 the received packets you can see the
6:06 packet loss error seconds and things
6:08 like that so you can see see the
6:10 information of the individual second as
6:12 it was recorded throughout the entire
6:14 test
6:16 so that does bring us to the end of this
6:18 learning byte in this learning byte we
6:19 demonstrated how to configure and run a
6:22 multicast udp test so as always thanks
6:24 for watching
6:27 visit the juniper education services
6:29 website to learn more about courses
6:32 view our full range of classroom online
6:35 and e-learning courses
6:38 learning paths
6:39 industry segment and technology specific
6:42 training paths
6:43 juniper networks certification program
6:46 the ultimate demonstration of your
6:48 competence and the training community
6:51 from forums to social media join the
6:53 discussion