Paragon Active Assurance – Multicast UDP Monitor

Juniper Learning Byte: Your guide to configuring a Multicast UDP task
Are you new to working with Paragon Active Assurance? In under 10 minutes, Juniper’s Zach Gibbs will show you step by step how to configure the Multicast UDP task with a monitor using the Control Center Web interface.
You’ll learn
What a Multicast UDP task is and how to configure one
The parameters you need to set up to configure a Multicast UDP task
How to run the monitor and examine the results using the Control Center Web interface
Who is this for?
Host
Transcript
0:00 [Music]
0:12 hello my name is zach gibbs and i'm a
0:15 content developer within education
0:17 services inside juniper networks and
0:20 today we will be going through the
0:22 paragon active assurance multicast udp
0:25 monitor learning byte
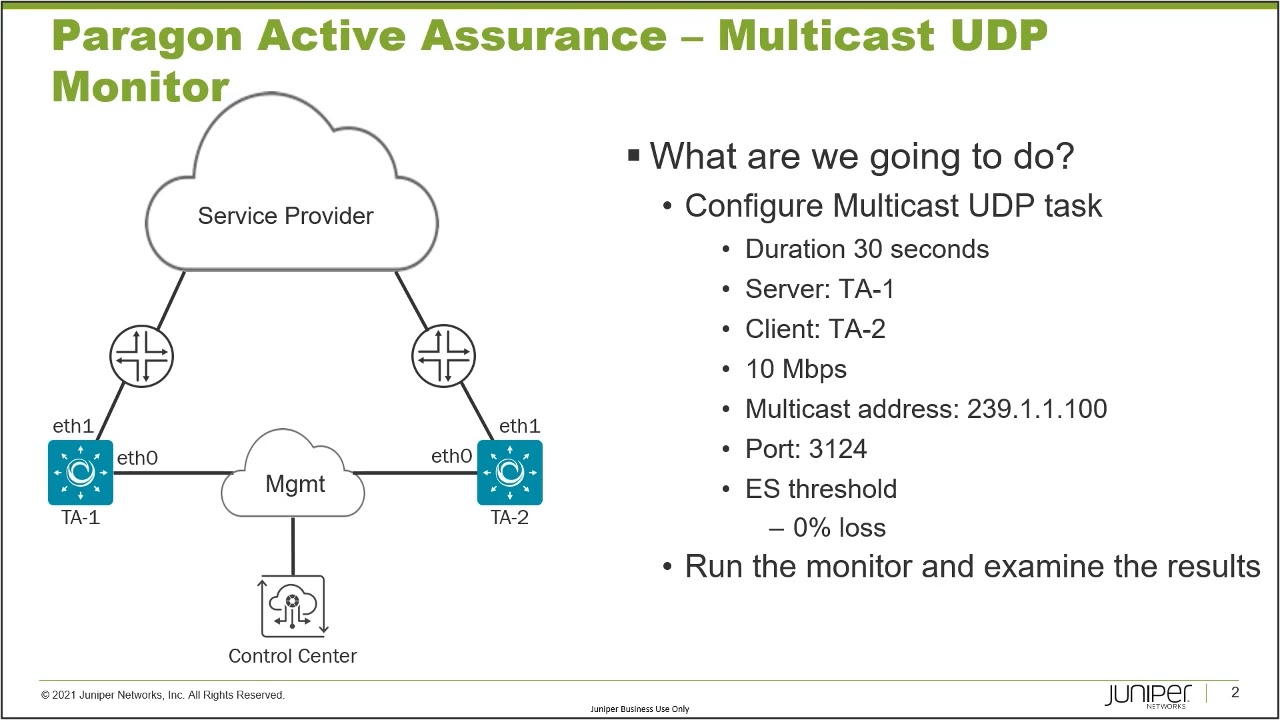
0:28 all right so here is the topology for
0:30 our learning byte and there are three
0:32 main devices we want to
0:34 talk about we have ta1 ta2 and the
0:37 control center so ta1 and ta2 use e0 to
0:41 connect to the management network which
0:43 then provides connectivity with the
0:45 control center
0:46 and then ta1 and ta2 use eth1 to connect
0:50 into the service provider network
0:52 all right so with that what are we going
0:54 to do we need to configure a multicast
0:56 udp task and so first you probably know
0:59 what multicast traffic is but just in
1:01 case you don't multicast is normally
1:03 used as a transport mechanism for
1:05 services such as iptv or even updating
1:08 pcs at the same time
1:10 so by using the multicast udp task
1:13 you're able to figure out
1:14 how your network handles multicast
1:16 traffic with things like end-to-end
1:18 delay jitter and packet loss
1:21 and so this task multicast udp task
1:24 sends udp multicast traffic from a
1:27 server which in our case is going to be
1:29 ta1 and then ta2 acts as a client to
1:33 receive the multicast traffic
1:35 and so what happens when the test starts
1:37 well first ta1 which as we know is the
1:39 server generates multicast traffic
1:41 towards the destination multicast
1:43 address
1:44 which in our case is 239.1.1.100
1:48 then ta2 which is the client tries to
1:52 join the multicast address and if ta2 is
1:54 successful at joining that multicast
1:56 address things like one way delay jitter
1:59 packet loss and packet miss orderings
2:01 that can be recorded now one thing i do
2:03 want to point out here is this would
2:05 make a lot more sense if we had more
2:06 than one client because we are talking
2:07 multicast what is the point of multicast
2:10 if we only have one client right well
2:12 the concept still holds true with just
2:14 one client ta2 is our one client ta1 is
2:16 the server and i don't have another test
2:19 station in the test bed right now so
2:20 that's why i'm using just one client
2:22 and so with that it'll still prove the
2:24 concept with only having one client but
2:27 typically you'd have multiple clients at
2:29 least two probably 10 maybe 100 clients
2:32 that would be subscribing to that
2:33 multicast address so just keep that in
2:35 mind okay so with that what are some
2:37 things we haven't talked about duration
2:38 we're going to set to 30 seconds the
2:39 server and the client we talked about
2:41 the rate we're going to set at 10
2:42 megabits per second the multicast
2:44 address of
2:45 239.1.1.100 we did talk about the server
2:48 port it's going to be three one two four
2:50 and then for error seconds threshold
2:52 we're just going to be using zero
2:53 percent loss we could also say something
2:55 about the jitter or the delay or
2:57 whatever in the air second thresholds
2:59 but with this learning about we're going
3:00 to keep it simple and put it at zero
3:02 percent loss for the only error second
3:03 threshold metric and then we'll run the
3:05 monitor and examine the results and so
3:08 with that let's go ahead and jump to the
3:10 control center web interface and get
3:12 this going
3:14 all right so here is the control center
3:16 web interface let's go to
3:18 monitoring and then new monitor
3:21 and we'll name this
3:23 multicast udp lb lb short for learning
3:26 byte
3:27 and then we'll select the multicast udp
3:30 task and you can see here that this is a
3:32 puzzle piece task which means we can add
3:34 additional parallel tasks and we could
3:36 run
3:37 other tasks at the same time as this
3:39 task but for this learning byte we are
3:41 focusing on the multicast udp task
3:43 okay so with that we need to fill out
3:45 the general section we need to specify
3:46 the server which is going to be ta1
3:48 we're going to be using the eth1
3:49 interface for this we want to make sure
3:51 we select the right interface if we were
3:53 to select each zero that would be the
3:55 management network and we don't want to
3:57 do that
3:58 okay so then the clients this is just
4:00 going to be ta2 the eth1 interface and
4:03 then the rate we're going to set that at
4:05 10 megabits per second multicast address
4:08 let's say 239 1.1.100
4:11 and the port recall that is three
4:13 one two four
4:15 and the loss is already defaulted to for
4:17 errored second threshold that is is
4:19 already defaulted to zero percent again
4:21 we could set the delay and the jitter
4:24 for air second threshold and also the
4:26 expected dscp we make sure that we're
4:28 receiving expected dcp value
4:31 but we're not going to worry about that
4:32 right now
4:33 and so with that let's go ahead and
4:34 start the monitor
4:36 and we don't need to start this with a
4:37 report if you are running a monitor in a
4:40 production environment highly recommend
4:41 it but for our learning bite it's not
4:43 necessary
4:45 and with any monitor there's a bit of a
4:47 setup time it is a little longer than a
4:49 test so this just takes a little bit of
4:51 extra time to get the setup going and
4:52 whatnot you can see here it's beginning
4:54 to start just be a few more seconds
4:57 okay you can see the monitor has started
4:59 and things are looking good we have
5:00 complete green no aired seconds so we
5:02 are getting no loss because recall that
5:03 we were only using the loss percentage
5:05 for the error second thresholds values
5:08 and so things are looking good we got
5:09 green across the board light green
5:11 across the board i guess at a start
5:12 green we're getting a little bit of a
5:14 loss a little bit of air settings but
5:15 that's not happening so you can see
5:17 things look good here and we can click
5:18 on the individual stream now one thing i
5:20 want to point out here this might seem a
5:21 little strange because it says ta1 eth1
5:24 ipv4 then giving us an arrow to ta2 eth1
5:28 ipv4 and that might seem a little
5:30 strange because that almost sounds like
5:32 it's unicast traffic but it's not what's
5:34 happening is ta1 is sending
5:36 traffic to that multicast address and
5:38 then ta2 is subscribing to that
5:40 multicast address and receiving that
5:41 traffic so with that let's go ahead and
5:43 click on the stream we can look at some
5:45 more information and we can see here
5:47 that we have some information in the
5:49 graph we can see here that we have the
5:51 air second bar the rate and the average
5:53 delay in milliseconds selected and you
5:55 can see here that at the top we can see
5:57 the rate
5:58 and
5:59 which kind of makes sense the average
6:00 delay is so low that nothing you can't
6:02 really see anything so let's go ahead
6:04 and remove that rate we know the rate is
6:05 good we're not getting any loss so let's
6:07 remove the rate from the graph
6:09 and okay great now we're seeing the es
6:11 bar down here uh there's no air second
6:14 so it's all green that's great and then
6:16 we're seeing the average delay in
6:17 milliseconds you can actually see what's
6:18 going on there
6:19 that's pretty low that's that's good and
6:22 then we could also select the max delay
6:24 and the min delay and you can actually
6:26 see that showing up there you can see
6:27 how that's
6:29 popping up here
6:30 you can see the max delay is kind of up
6:32 higher there but the average is pretty
6:34 good
6:35 let's deselect those and then we can
6:36 select the jitter as well to get some
6:38 information on that so you can see how
6:40 the jitter is coming through and then we
6:41 can look at the table the table will
6:43 actually show us that information as
6:44 well now it doesn't show anything
6:46 because there's no errors so we need to
6:47 show the
6:48 or use the show all command and we're
6:50 going to have to scroll down a bit to
6:51 see it because remember it takes a while
6:53 to get it going
6:54 and so with the monitor that is so we do
6:56 have to scroll down to start seeing the
6:58 results so you can see the results here
7:00 you can see the rate the loss miss order
7:02 packets none delay average delay delay
7:05 max things like that so you can see the
7:07 individual statistics that are recorded
7:09 for this monitor and remember since this
7:11 is a monitor it has a 10 second
7:13 resolution and so it's recording the
7:15 statistics every 10 seconds
7:18 so this does bring us to the end of this
7:20 learning by in this learning but we
7:21 demonstrated how to configure and run a
7:23 multicast udp monitor so as always
7:26 thanks for watching
7:29 visit the juniper education services
7:32 website to learn more about courses
7:34 view our full range of classroom online
7:38 and e-learning courses
7:40 learning paths
7:41 industry segment and technology specific
7:44 training paths
7:46 juniper networks certification program
7:48 the ultimate demonstration of your
7:50 competence and the training community
7:53 from forums to social media join the
7:56 discussion