Juniper Support Insights Demo

Juniper Support Insights delivers holistic visibility into the operational health of all your Junos OS devices. Now included with Juniper Care, the service easily and securely connects your Juniper devices to the cloud and provides actionable intelligence that you can use to optimize your organization’s network.
Learn more about Juniper Support Insights: https://www.juniper.net/us/en/services/support-services/support-insights.html
You’ll learn
How to see what’s happening on your network using Juniper Support Insights
How to navigate the Juniper Support Insights dashboard
Who is this for?
Host
Guest speakers

Transcript
0:00 Welcome to the Juniper Garage.
0:01 I’m Kevin.
0:02 And today, I’m going to show you a better way to know exactly
0:05 what’s happening on your network, using Juniper Support Insights.
0:10 You’ll be able to see
0:11 where your assets are, know the health of your network and devices,
0:15 make sure they’re under support, and limit your exposure to risk.
0:18 With this kind of visibility, you’ll be able to make more timely,
0:21 informed decisions for your network and deliver an amazing support
0:26 and user experience for all that rely on it.
0:29 Sit back, crack open a cold beverage, and my friend Devin will show you
0:34 what Juniper Support Insights can do for you.
0:41 I'm taking us over to the JSI reports and zoomed us in.
0:45 At first glance, you see a lot of what you'd expect out of a reporting module.
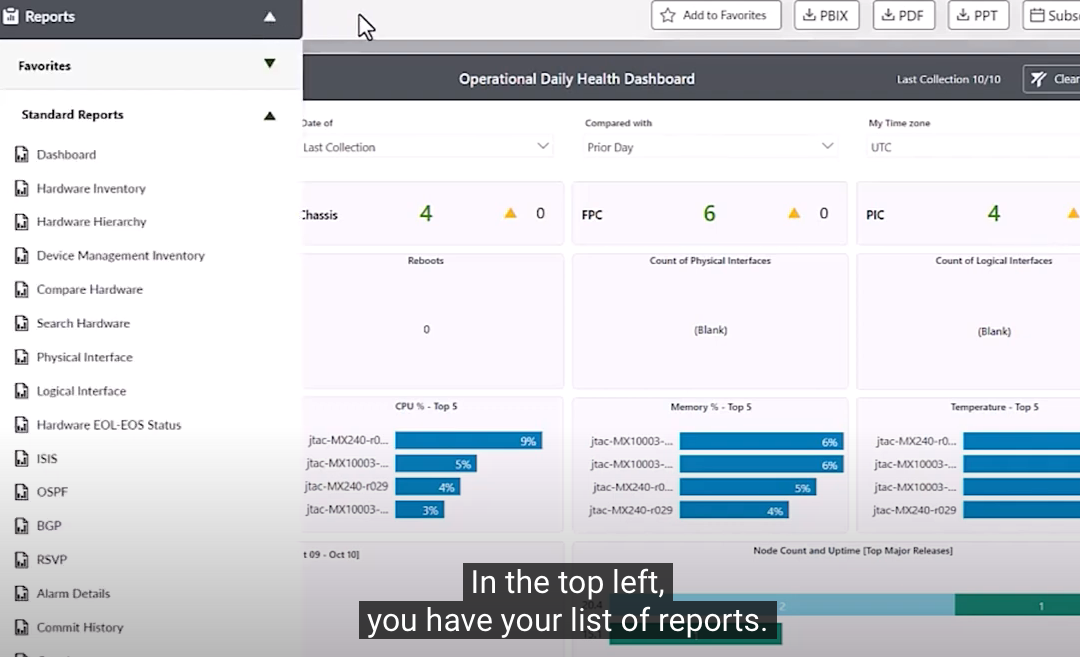
0:49 In the top left, you have your list of reports.
0:53 You have a way to favorite them here on each report.
0:56 And this is where you would select the one you want to view.
0:59 Also across the top, you have another button for add to favorites.
1:02 It operates the same as the one on the report menu.
1:05 You have different ways to download your reports, including PDF and PowerPoint
1:10 and have a way to subscribe to receive your reports
1:12 regularly over email.
1:16 The subscribe functionality is straightforward and easy.
1:20 Give it a name relevant to you, a recipient
1:24 where the recipients are members of the Juniper Support Portal.
1:28 Select the reports you would like to receive.
1:31 You can select more than one.
1:36 And then the format you want to receive the reports in,
1:39 along with their frequency.
1:40 Frequency is daily, weekly and monthly.
1:43 To match up with calendar weeks and calendar months, not just the date.
1:47 So every week on Friday or every first Monday.
1:56 Every report has filters across the top.
2:00 And you’re able to go
2:01 historically into the reports any day that there is a collection.
2:06 You can go back in time and see the data from that day
2:09 along with compare to another point in time.
2:13 If any time you
2:14 want to start a report over, you have your clear filter button here.
2:16 You also know the last collection date to make sure that your updates
2:22 are happening regularly by seeing your date right here.
2:27 So start to drill into the data.
2:29 If you know what report you want to go to, you go to the top left and select it.
2:32 You also have the option of doing a drill through.
2:36 Any of these pieces of information, you can right click drill through
2:39 and it’ll take you to
2:41 the certain report with the filters that you want to apply.
2:47 For this, we’ll jump over manually using the menu,
2:49 go to hardware inventory.
2:51 This serves the purpose of giving you a breakdown of
2:56 what equipment is in your estate, what models, what the hostname is,
3:00 what the serial number is, what the software that’s running on it.
3:04 What you’ll see here as well is the common format
3:07 that we have from our report
3:08 to have visualization on top and that data on the bottom.
3:12 In this case, you have a way to see the data organized in a hierarchy view.
3:16 Or if you’re a person who likes to manipulate the data,
3:19 you can do show table which flattens this out for easy to use in Excel.
3:25 To export that data out in that CSV format, you have your three buttons over here.
3:30 Export data and it’ll give you
3:32 an Excel sheet.
3:35 Next up, we’ll view the device management inventory,
3:38 which acts as the software inventory for the environment,
3:42 seeing what devices are running, what versions, along with the mastership
3:47 state for primary and backup devices.
3:57 One of the big reports
3:58 is the hardware end of life.
4:01 This has the added benefit of having easy pivots from data point to data point
4:06 quickly going from device group,
4:08 to product family, to model number, to host.
4:13 The same as you saw before, you have your hierarchy view
4:16 and you have your flat view, using show table.
4:22 You have a useful set of reports here called the routing reports.
4:25 Depending what you have set
4:26 up your environment, you have find the report relevant to you
4:29 and will give you the basic information about those connections.
4:34 The hosts, the peer to peer address
4:37 description, whether it's up or down, letting you quickly
4:41 get a view of the environment.
4:47 Next up are the set of reports to help you with your troubleshooting:
4:50 alarm details, commit history, coredump.
4:54 Being able to quickly see across the environment
4:57 on what devices have major alarms, have minor alarms.
5:02 Together these reports let you begin some of your troubleshooting.
5:06 Let’s say a problem was raised and started at 2 p.m.
5:09 yesterday.
5:10 You’re quickly able to scan for any alarms,
5:12 any coredumps that might have caused a blip,
5:15 any commit changes that might have led to the problem being raised.
5:19 And these work for our J-Tech folks as well.
5:21 They have access to these reports for them to answer some of their own questions
5:25 rather than always relying on asking.
5:27 To keep this high level, I'll take us back to the dashboards
5:31 and say thank you for giving us your time and letting me walk you through JSI today.
5:35 We’re happy to be adding to our cloud posture
5:38 to continue to improve your experience and engagement with Juniper.
5:41 Take care and we'll talk to you soon.