Working with activity audit logs
The Activity Audit Logs page (Monitor > Activity Audit Logs) displays detailed views of data you select from charts, or items you search for. Through this page, you can use the filtering options in the navigation bar to focus on specific users and activities to provide an audit trail or detect patterns of use.
The page shows these items.
|
Search options:
|
|
|
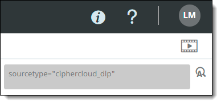
Search query string. |
|
|
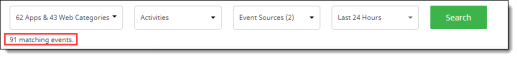
The total number of events found from the search. |
|
|
Navigation bar from which you can filter your search further by choosing users, user groups, activity types, content types, and policy names on which to search. These filters can be helpful when you need to keep an audit trail on specific users or activities. The search results show the most recent 10,000 records from the selected filter items. |
|
|
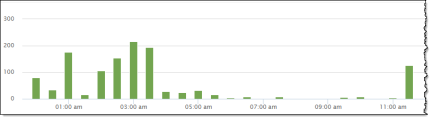
Bar graph display of event data, showing counts for all events found (in addition to the most recent 10,00 records). |
|
|
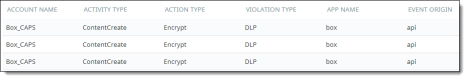
Table of event data, showing the newest 500 records. The data is sorted in descending order by time. For additional data, you can export the contents to a CSV file. The export includes the results of the currently selected filters. Note For ServiceNow cloud applications, the Activity Audit Logs page does not show source details (IP, city, country, country code, IP, origination, source state, or user type) for content download activity. |
|
Filtering data
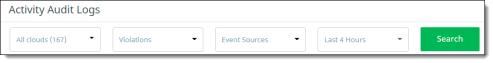
To focus on specific data, you can use the dropdown lists to set filters for the following types of information:
-
Cloud applications (managed and unmanaged)
-
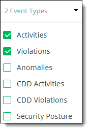
Event types, including activities, violations, anomalies, Cloud Data Discovery (CDD) activities, CDD violations, and Cloud Security Posture events
-
Event sources, including API, IaaS audit, Office 365 audit, and other event types
-
Time range, including last hour, last 4 hours, last 24 hours, today, last week, last month, last year, and custom by month and day you select
When you have selected the items from the lists, click Search.
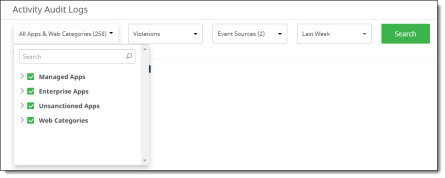
In the vertical navigation bar at the left, you can filter the data further:
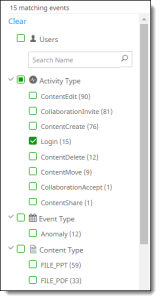
All available items are listed under each category.
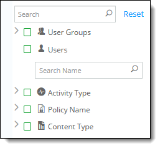
Click the > icon to expand the list for each category. If more than 10 items are available for a category, click More at the end of the list to see additional items.
To filter and search for data:
-
Select the search items from each of the dropdown lists and click Search.
The number of items matching the search criteria shows below the dropdown lists.
The search results show the total count of events.
-
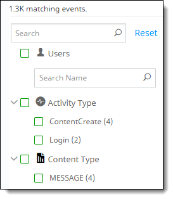
In the left menu, select the items to include in the filter.
-
To include all items in a category, click the box next to the category name (for example, Activity Type).
-
To select specific items, click the boxes next to them.
-
To search for a user, enter a few characters of the user's name in the Search box under the Users category. Select the username from the search results.
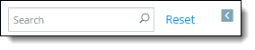
Click Reset to clear the filters in the navigation bar. The search items you selected from the search dropdown lists are not affected.
To hide the navigation bar and allow more room to see the data after making your filter selections, click the left-arrow icon next to the Reset link.
Selecting fields to include in the table view
To select fields to appear in the table view, click the icon at the right side of the screen to display a list of available fields. The contents of the list depend on the filtering options you selected.
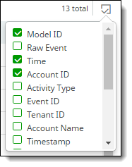
Check the fields to include in the log; uncheck any fields to exclude. You can include up to 20 fields.
If you have any malware scanning policies that include scanning by an external service, choose the fields that apply to that service to include in the table for those policies. For example, for a policy using FireEye ATP for malware scanning, you can include ReportId (a UUID provided as a response by FireEye), MD5 (available to compare with similar MD5 information), and Signature Names (comma-separated values) as fields for FireEye scanning information.
Viewing additional details from a table entry
To view additional details for a listed violation, click the binocular icon at the left side of the entry. A popup window displays details. The following examples show details from FireEye and Juniper ATP Cloud services.
FireEye
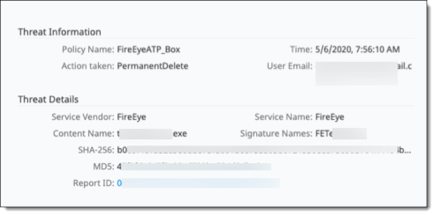
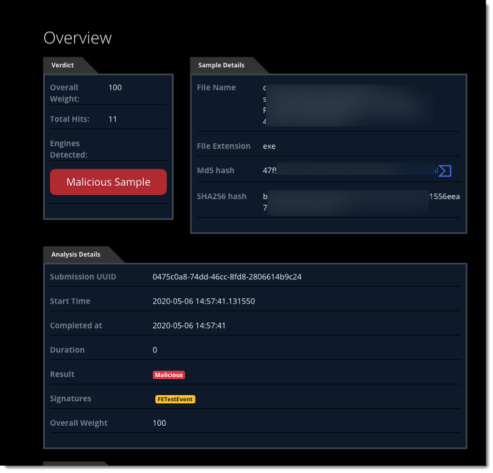
To display a FireEye report with additional details, click the Report Id link.
Juniper ATP Cloud
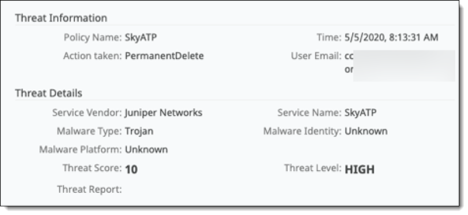
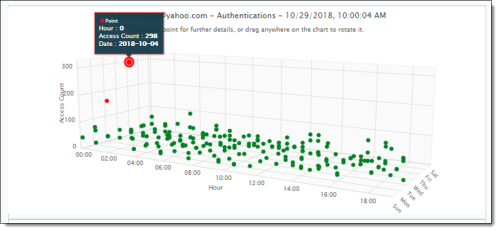
Viewing anomaly details from the Activity Audit Logs page
From the Activity Audit Logs page, you can display a three-dimensional chart of anomalous activity for a user. To view the chart, click on the binocular icon in any table row.
The three-dimensional anomaly view opens in a new window.
For more information about anomalies, see Anomalous Activities.
Performing an advanced search
The Search Query field along the top of the Activity Audit Logs page shows the items currently displayed when you select Admin Audit Logs from the Administration menu, or the items that apply to the details you selected from one of the Home page dashboards.

Note
To perform an advanced search, make sure you understand the format for writing Splunk queries. For most searches, you can find the information you need using the filtering options, and you will not need to perform an advanced search.
To perform an advanced search:
-
Click in the Search Query field. The field expands.
-
Enter the name/value pairs for the search criteria. You can enter multiple lines of name-value pairs. Up to five lines are displayed. If your search is more than five lines long, a scroll bar appears at the right of the Search Query field.
-
Click the Search icon. The search results are displayed.
-
To return the query string field to its original size, click the > icon at the right. To reset the search criteria to the original values before your search, click the x at the right.
Viewing additional log details
Do either of these actions:
-
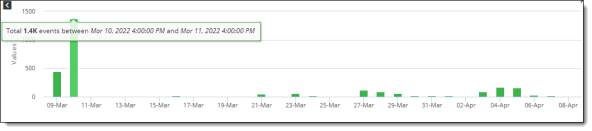
Hover over the bar for the date for which you want additional details. A pop-up displays details for that date. In this example, the pop-up shows the number of events in a 24-hour period on April 10.
-
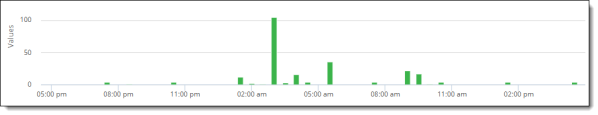
Or click the bar of the date for which you want additional details, a new bar chart is displayed with a breakdown of events. In this example, the bar chart displays an hour-by-hour count of events on April 23.
Hiding the chart view
To hide the chart view at the top of the screen and display only the list of events, click the show/hide chart icon link at the right side of the chart view. To display the chart view again, click the link.

Exporting data
You can export data to a comma-separated values (.csv) file, based on the fields and navigation bar filters you have chosen.
To export data from the Activity Audit Logs page:
-
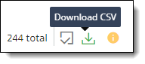
Select the Export icon at the right side of the screen.
-
Select a file name and location.
-
Save the file.