Viewing user and system activity from the Home Dashboard
From the Home Dashboard in hosted deployments, you can view graphical representations of cloud and user activity in your organization.
The Home Dashboard organizes data into these major components:
-
Data cards showing totals and trending charts for events
-
The total number of events that are possible threats to your data security (by cloud and by type)
-
A more detailed list of events. Threats include violations and anomalous activity.
The following sections describe these components.
Data cards
Data cards contain snippets of important information that administrators can view on an ongoing basis. The numbers and trending charts in the data cards are based on the time filter that you select. When you modify the time filter, the totals shown in the data cards, and the trending increments, change accordingly.
The data cards display these types of information for the cloud applications and time ranges you specify. You can see activity counts for a specific time range by hovering over the date ranges at the bottom of the data card.
The following sections describe each data card.
Content Scanning
The Content Scanning data card shows the following information.
-
Files and Objects -- The number of files (unstructured data) and objects (structured data) that have been scanned to detect policy violations. For Salesforce (SFDC), this number includes Customer Relationship Management (CRM) objects. When customers onboard cloud applications, CASB scans content and user activity on the cloud applications. Based on the activities performed and the policies set for your enterprise, CASB generates analytics and displays them on the data cards.
-
Violations -- The number of violations detected by the policy engine.
-
Protected -- The number of files or objects protected through quarantine, permanent delete, or encryption actions. These remediation actions remove content from users (permanently through delete; temporarily through quarantine) or restrict the ability of content to be read by unauthorized users (encryption). These analytics provide a view (over time) of how many protective actions have been performed in response to violations that the policy engine has detected.
Content Sharing
The Content Sharing data card shows the following information.
-
Public Links -- The total number of public links found across file storage cloud applications. A public link is any link that the general public can access without requiring a login. Public links are easy to share and are not secure. If they link to content that contains sensitive information (for example, references to credit card numbers), that information could be exposed to unauthorized users, and could compromise the privacy and security of that data.
-
The Remove Public Link option provides you with the flexibility of enabling information sharing but also allows you to protect specific types of content. When you create a policy, you can specify public link removal if a public link is included in a file with sensitive content. You can also specify removal of public links from folders that contain sensitive information.
-
External Sharing -- The number of activities in which content is shared with one or more users outside the organization's firewall (external collaborators). If a policy allows external sharing, a user can share content (for example, a file) with another user who is external. Once content is shared, the user with whom it is shared can continue accessing the content until that user's access is removed.
-
Protected -- The total number of events for which the public link or an external collaborator was removed. An external collaborator is a user outside the organization's firewall with whom content is shared. When an external collaborator is removed, that user can no longer access the content that was shared.
Most Hit Security Policies
The Most Hit Security Policies card shows a table that lists the top 10 policy hits for each policy. The table lists the policy name and type and the number and percentage of hits for the policy.
Policies
The Policies card shows in a circle graph the total number of active policies and the count of active and all policies by policy type.
Event details
Event details provide a table view of all threats for the time filter you specify. The total number of events listed matches the total number shown in the graph at the right.

You can filter data using the following options.
By time range

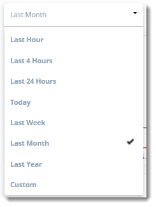
From the dropdown list, choose the time range to include on the Home page view. The default time range is Month. When you select a time range, the totals and trending increments change.
You can also specify a custom date. To do so, choose Custom, click in the first box at the top of the Custom view, then click the preferred From and To dates from the calendar.
Viewing additional details
You can display additional details from the data cards, the threat graph, or the table view.
From a data card
For a specific date: Hover over the date along the bottom of the card for which you want details.
For the data counts in a card: Click on the data count for which you want additional details.
The details are displayed in the table view.
From the table
Click the Detailed Analysis link. All activities from the Home Dashboard page are listed in a table on the Activity Audit Logs page. From here, you can drill down further by clicking on the bars.
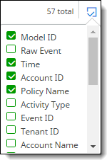
To display more or fewer columns in the table, click the box icon at the right, and select or deselect columns in the list. The field names available for selection depend on the filtering options you have selected. You can display no more than 20 columns in the table.

Refreshing all data
Click the Refresh icon at the upper right corner of the Home Dashboard to update the data for all items on the page.

Exporting data
You can save a printout of the information on the Home Dashboard.
-
Click the Export All icon at the upper right corner of the page.

-
Select a printer.
-
Print the page.