View scan details
You can view detailed values and charts that pertain to information from a scan.
-
On the Cloud Data Discovery page, click the > arrow next to the scan for which you want to see details.
-
Click the tab for the type of detail you want to see.
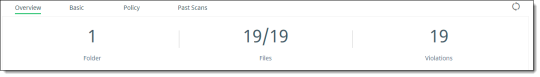
Overview tab
The Overview tab provides graphical detail for items found and policy violations.
The values along the top of the section show current totals and include:
-
Folders found
-
Files and data found
-
Policy violations found
Note
For ServiceNow cloud types, totals are also shown for structured data items. The line graphs show activity over time including:
-
Items found and scanned
-
Policy violations
You can select a time range for items to view – Last Hour, Last 4 hours, or Last 24 Hours.
Since Beginning will appear in the Showing Range list when a successful scan has been completed.
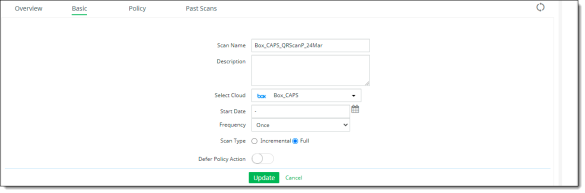
Basic tab
The Basic tab displays the information you entered when you created the scan. You can edit this information.
Policy tab
The Policy tab lists the Cloud Data Discovery policies associated with a scan. You can associate multiple policies with a scan.
Each listing shows the Policy Name and Priority. In addition, you can delete an associated policy by clicking the Delete icon in the Actions column.
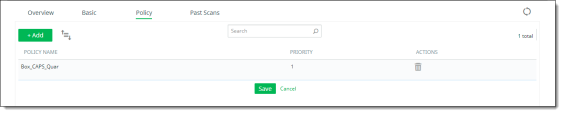
To add a Cloud Data Discovery policy to a scan, see Associate a scan with a Cloud Data Discovery policy.
Past Scans tab
The Past Scans tab lists the details of previous scans.
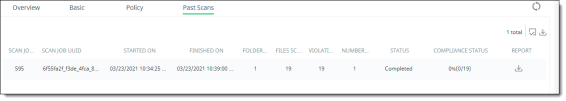
The following information is displayed for each scan:
-
Scan Job ID – An identifying number assigned for the scan.
-
Scan Job UUID – A universally unique identifier (128-bit number) for the scan.
-
Started on -- The date on which the scan was started.
-
Finished on -- The date on which the scan was finished. If the scan is in progress, this field is blank.
-
Folders Scanned – The number of folders scanned.
-
Files Scanned – The number of files scanned.
-
Violations – The number of violations found in the scan.
-
Number of Policies – The number of policies associated with the scan.
-
Status – The status of the scan since it started.
-
Compliance Status -- How many policy violations were detected as a percentage of total items scanned.
-
Report – An icon for downloading reports for the scan.
To refresh the list, click the Refresh icon above the list.

To filter the information, click the Column Filter icon, and check or uncheck the columns to view.

To download the list of past scans, click the Download icon above the list.

To generate a report for a scan, see the next section, Generate a scan report.