Insights Investigate
Insights Investigate provides tools for incident management in your organization. You can view incidents that involve policy violations occurring in your organization, assign a level of severity to an incident, and specify the appropriate action. In addition, you can view details about incidents and their sources from several perspectives and obtain additional information about each incident and its source.
To use Insights Investigate functions, go to Administration > Insights Investigate.
The Insights Investigate page provides information in three tabs:
-
Incident Management
-
Incident Insights
-
Entity Insights
Incident Management tab
The Incident Management tab lists incidents occurring in the organization.
This page lists the total number of incident records found, showing up to 50 records per page. To view additional records, use the pagination buttons at the bottom of the screen.
Four dropdown lists are available from which you can filter the information to show incidents by
-
time period (today, last 24 hours, week, month, or year, or a date period you specify)
-
cloud (managed or unmanaged)
-
severity (low, medium, or high)
-
status (open, under investigation, or resolved)
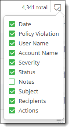
The incident management list provides the following information. Use the Column Filter at the upper right to show or hide additional columns.
|
Column |
What it shows |
|---|---|
|
Date |
The date and time of the last known occurrence of the incident. |
|
Policy Violation |
The policy that the incident violated. |
|
User Name |
The name of the user for the incident. |
|
Account Name |
The name of the cloud on which the incident occurred. |
|
Severity |
The severity of the incident — low, medium, or high. |
|
Status |
The resolution status of the incident — open, under investigation, or resolved. |
|
Subject |
The text of the subject for the violating email. |
|
Recipient |
The name of the recipient of the violating email. |
|
Actions |
The actions that can be taken for this incident. Two icons are displayed.
|
You can use Search box to find information about a specific violation.
Incident Insights tab
The Incident Insights tab provides details for these types of incidents:
-
Login violations
-
Geoanomalies
-
Activity anomalies
-
Malware
-
DLP violations
-
External sharing
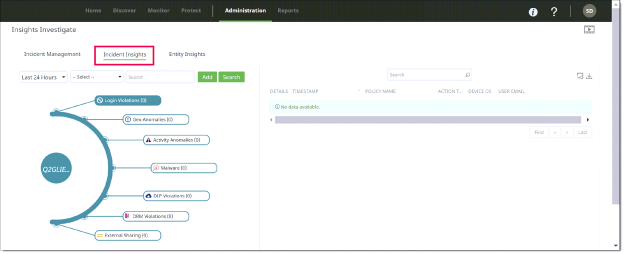
Each violation type is labeled in the outer circle of a graph showing the tenant’s name in the center. The label for each type shows the number of incidents for that type. For example, DLP Violations (189) indicates 189 occurrences of DLP violations.
For more precise search results, you can filter this information by date (today, last 4 hours, last 24 hours, week, month, or year. (The default is Last 24 Hours.)
You can search for incidents using the Search and Add buttons. These buttons enable you to conduct more precise searches for the data you need. For example, you can add a query that specifies user AND location AND application. You can include only one user in a search query.
For incident types that have no violations (count of zero), their labels are not highlighted.
For incident types that have violations, a table to the right shows additional details about each violation. The information in the table varies for each incident type. Click the violation label to see the list of incidents for that violation.
For DLP Violations, the table shows the following information for up to 100 records.
You can click the binocular icon in the first column of the table row to view a popup with additional details about a violation.
Entity Insights tab
The Entity Insights tab provides details about the entities that are the sources of violations, including:
-
User
-
Device
-
Location
-
Application
-
Content
-
External user
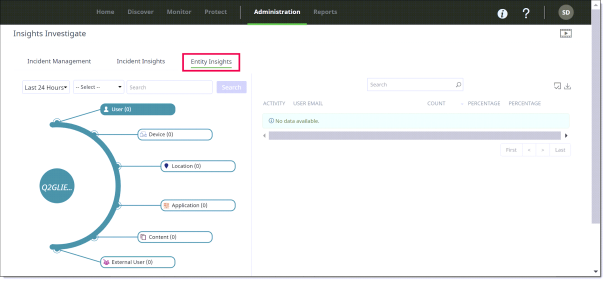
Each entity is labeled in the outer circle of the graph. By default, the tenant name appears in the center circle. The label for each entity shows the name of the entity and the count found for it. For example, User (25) would indicate 25 users found, Device (10) would indicate 10 devices found.
For more precise search results, you can filter this information by date (today, last 4 hours, last 24 hours, week, month, or year. (The default is Last 24 Hours.)
You can search for additional details about an entity. For example, if you search for a user by entering the username in the Search field, the graph displays the username and their risk level. The user’s risk level is displayed as a half-circle around the username. The color indicates the risk level (low, medium, or high).
For entity types that have incidents, a table to the right shows additional details about each incident for the entity. The type of information shown in the table varies according to the entity. Click the entity label to see the table for that entity.
Notes
-
The Entity Insights table can display no more than 1,000 records. If your search yielded a high count for an entity, the table displays only the first 1,000 records found, even if the total number of records exceeds 1,000. You might need to refine your search further to keep the total record count at 1,000 or fewer.
-
When exporting Entity Insights activity records from the Activity Audit Logs page to a CSV file, the export is limited to 10,000 events. If your search yielded an activity count higher than this, the exported CSV file will include only the first 10,000 records found.