Monitor and Troubleshoot Juniper Secure Connect
This topic contains information about VPN monitoring and troubleshooting issues with Juniper Secure Connect.
For monitoring the VPN connection, use the J-Web interface, as described in Monitor Your VPN Connection.
If you encounter any issues while using Juniper Secure Connect application, we recommend that you follow these steps to check the log messages and locate the issue:
Monitor Your VPN Connection
You can use the J-Web interface to monitor the existing remote access VPN connection. To do this, navigate to Monitor > Network > IPsec VPN page. Figure 1 shows the sample IPsec VPN page under monitoring menu option.
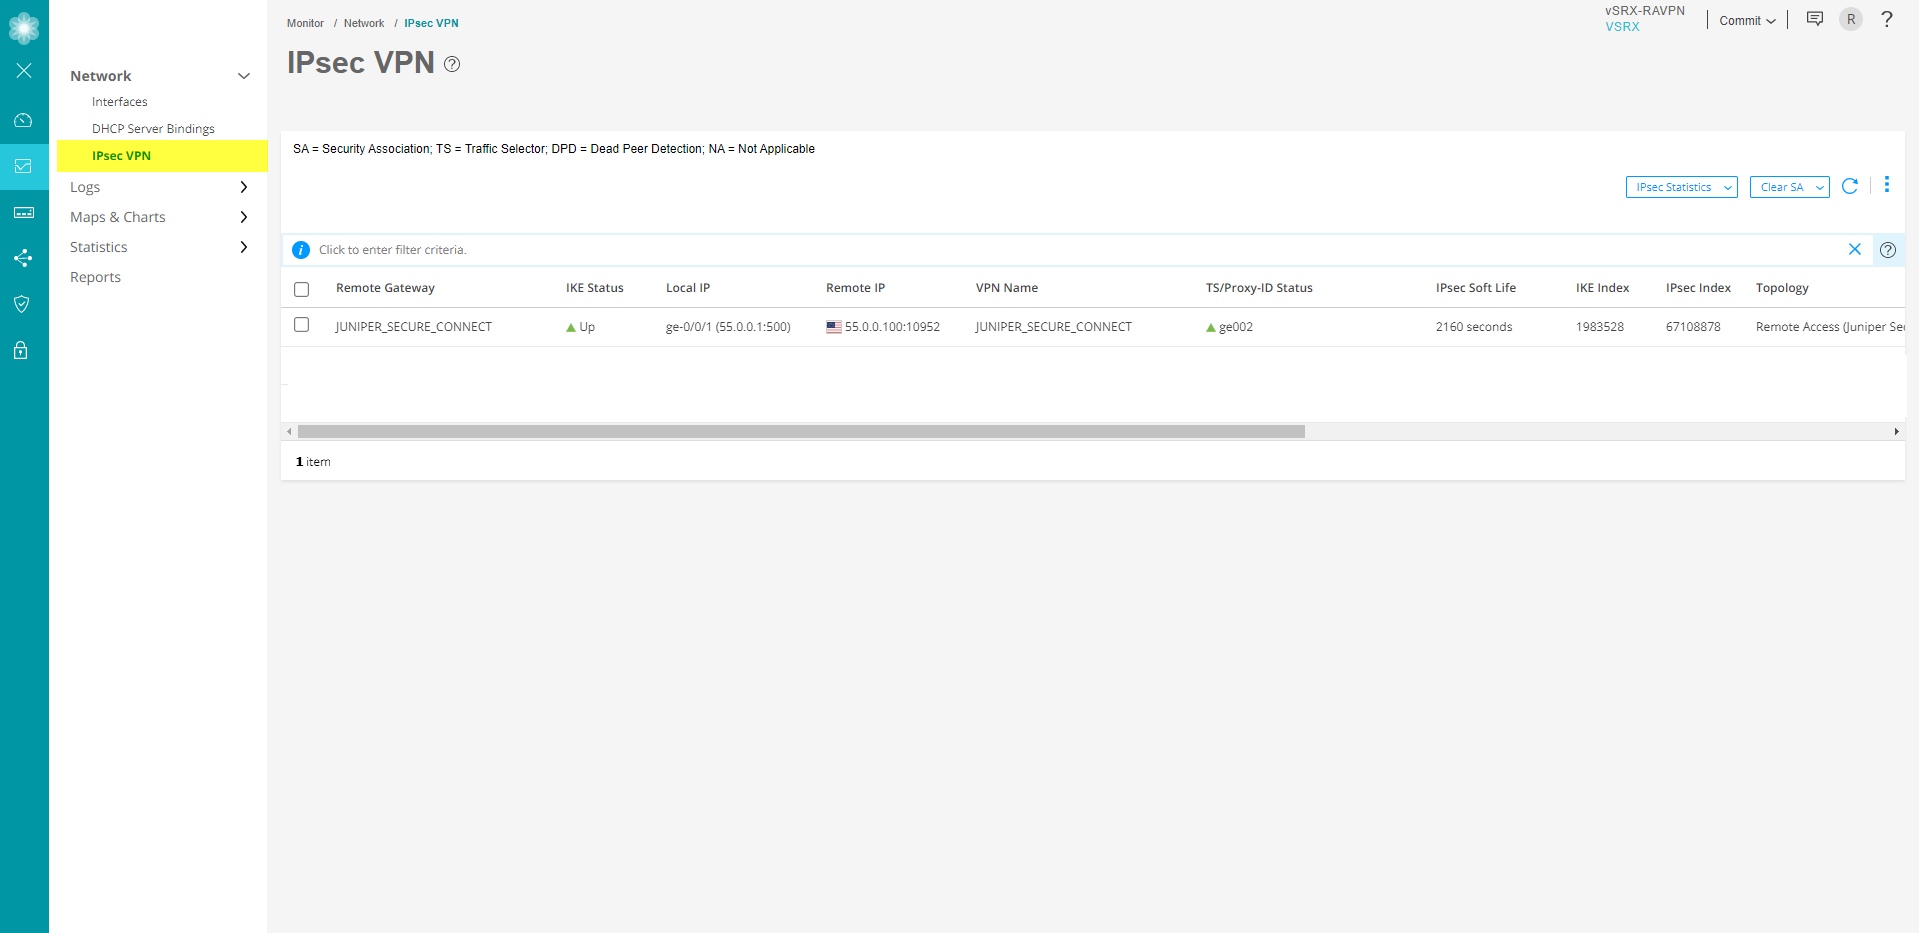
The IPsec VPN page displays IKE/IPsec configuration, Security associations (SA), and IPsec statistics information.
See Monitor IPsec VPN for more details.
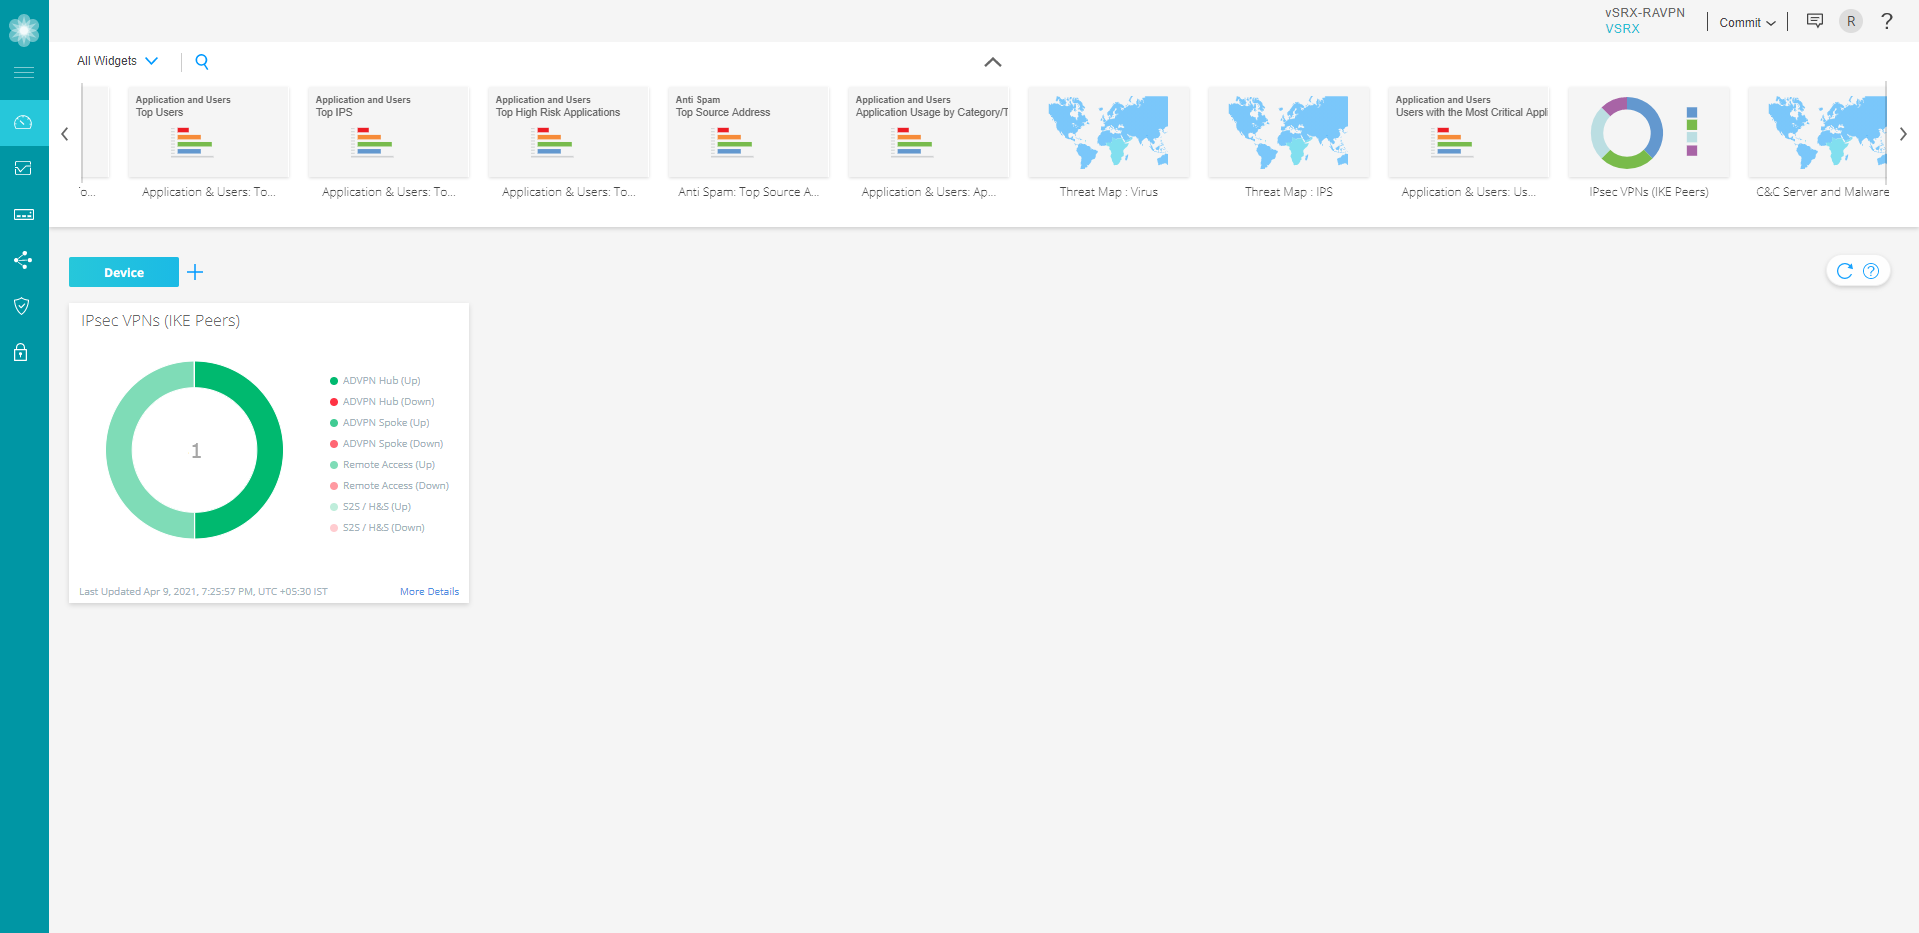
You can also view J-Web Dashboard to get the status and count of IKE peers as shown in Figure 2. Hover over the sections in the widget, to view the IKE peers count with VPN topology type. See Dashboard Overview .
Check Junos OS Logs
You must configure syslog to save the syslog file on your device. Currently, J-Web does not support structured logs. Only unstructured logs are supported.
To view the system logs in J-Web interface, navigate to Device Administration > Operations > Files as shown below:
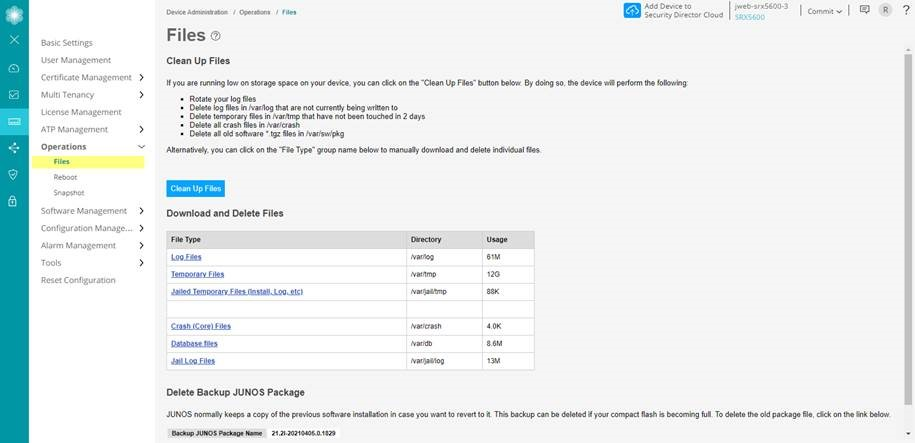
The default logs files and trace options are automatically created under /var/log folder.
You can view the stream (traffic or routing engine) logs by navigating to Monitor > Events > IPsec VPN page.
Check Juniper Secure Connect Application Logs
Windows
Following are the steps to check the Juniper Secure Connect application logs on a Windows device:
The log is continuously active in the background, even if the log window is not open. All the relevant Juniper Secure Connect communication events are displayed and saved for one week per operation day, in a log file. The files older than seven online days are automatically deleted.
The log file is generated automatically in the installation directory under the Log folder when the communication process is completed. The log file is named in NCPyymmdd.LOG format, where yy=year, mm=month, and dd=date. Select Help > Logbook to view the log messages in the log book page.
You can change the storage time for log files using the Extended Log Settings option. You can open and analyze the log files using a text editor.
Figure 4: Logbook Menu Option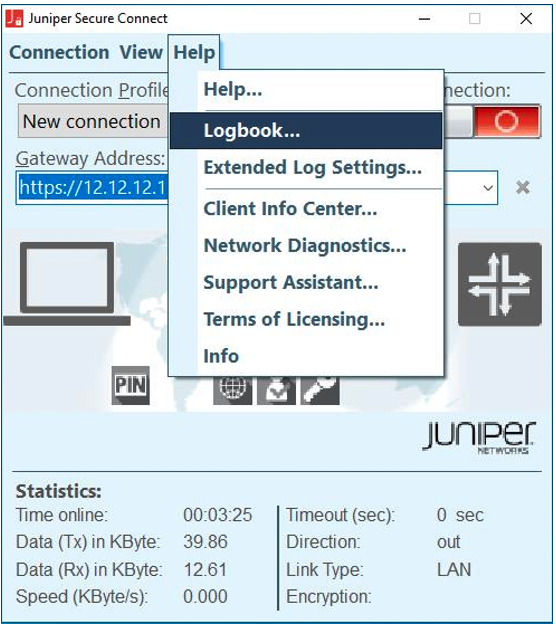 Figure 5: Log Message Display
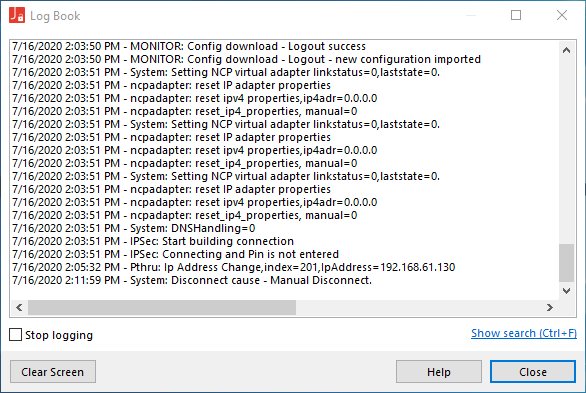
From the menu bar, click Help and then select Extended Log Settings.
Figure 6: Extended Log Settings Menu Option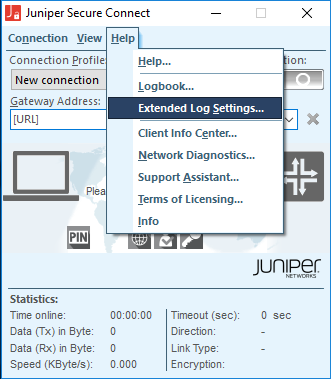
Enable all options by selecting all the check boxes, and then click OK.
Figure 7: Extended Log Settings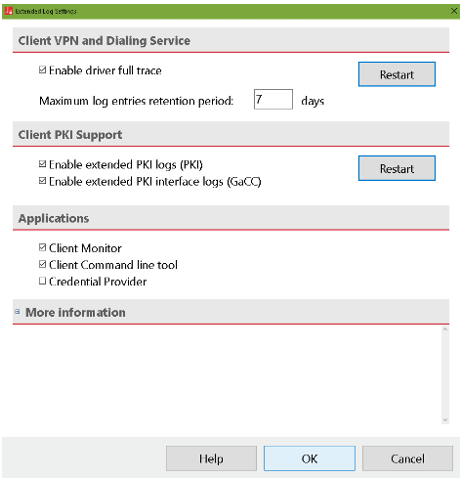
Open the logbook and check for any log messages that indicate the problem. If you cannot resolve your issue based upon the log messages, start the Support Assistant by clicking Help and then selecting Support Assistant. The Support Assistant collects all the required data.
Figure 8: Support Assistant Menu Option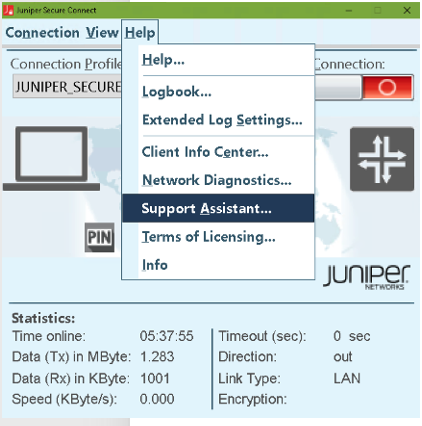
Click Add to attach any additional files, and then click Next. The Save archive file page opens.
Figure 9: Save Archive File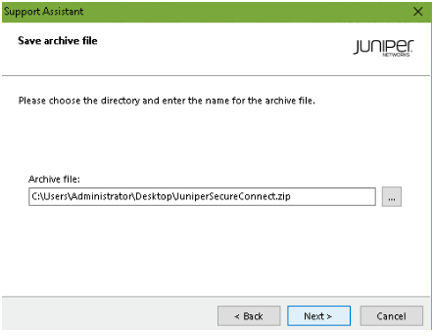 Figure 10: Log Files List
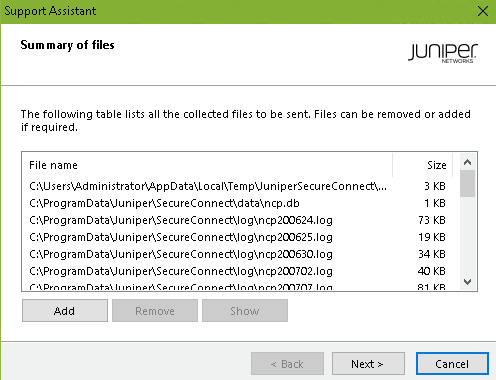
Select the Only create the archive file option button. Then, click Next.
Figure 11: Create Only Archive File
After the archival process is completed, Juniper Secure Connect displays the archived file location.
Figure 12: Successful Creation of Log Files Archival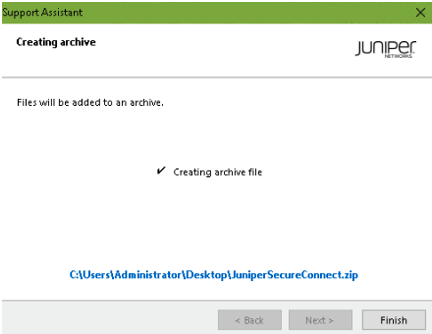
Click Finish.
macOS
Select Log > Logbook through the Juniper Secure Connect application menu to open the logbook.
Figure 13: Logbook Menu Option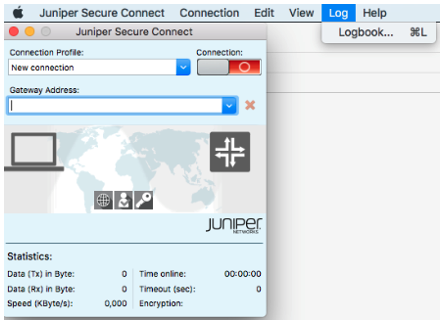
Check for any log messages that indicate the problem.
Figure 14: Displaying Log Information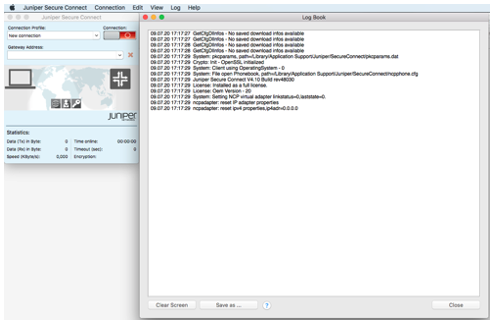
If you are not able to resolve the issue, save this log message into a file with the ncpmonlog.txt filename. Copy the file ncpphone.cfg to the same location where you saved the logbook file /Library/Application Support/Juniper/SecureConnect/ncpphone.cfg.
To locate the ncpphone.cfg file, open the Finder and select Go in the menu bar and at the same time press down the “Option” key on your keyboard.
Figure 15: Open File Library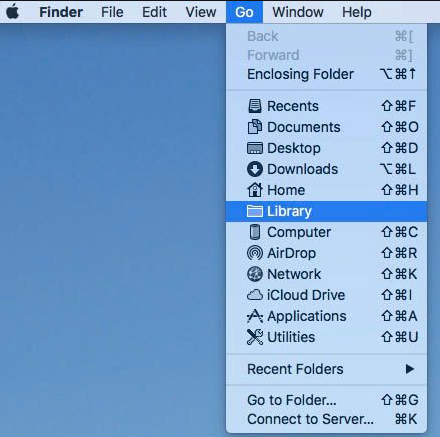
The directory location where the Juniper Secure Connect files are saved is displayed.
Figure 16: Juniper Secure Connect Directory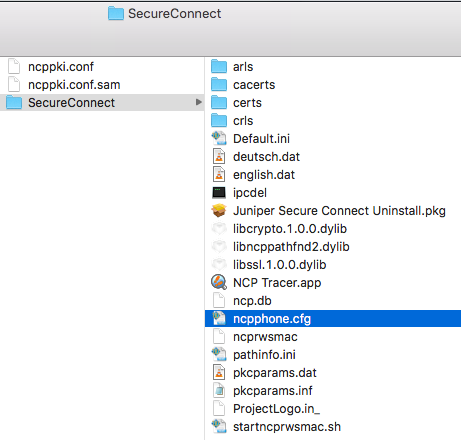
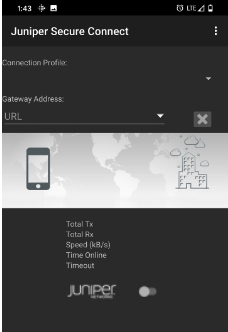
Android
Following are the steps to check the Juniper Secure Connect application logs on an Android device:
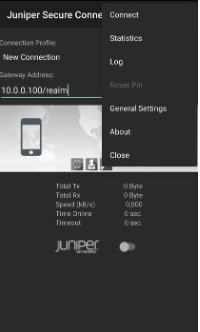
In the Juniper Secure Connect application menu, click the three vertical dots at the top right corner and select Log from the menu.
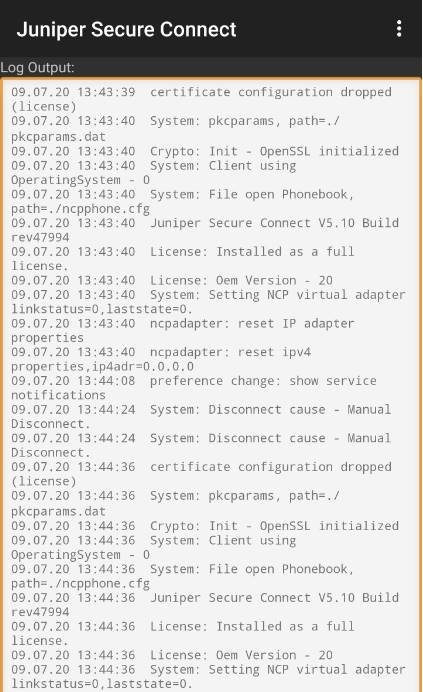
The log output window appears, displaying the log messages.
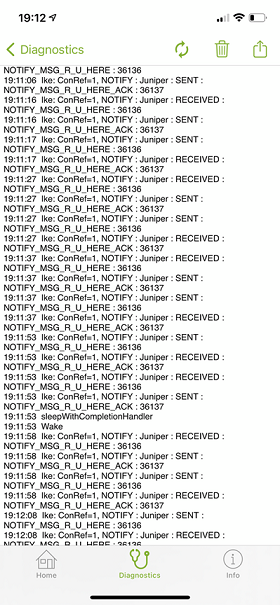
iOS
The log is continuously active in the background, even if the log window is closed. All the relevant Juniper Secure Connect communication events are saved in the log file. Navigate to Diagnostics > Debugging > Error Log to view the log messages. Click on the export icon right on top of the screen to send the log file through the offered applications.