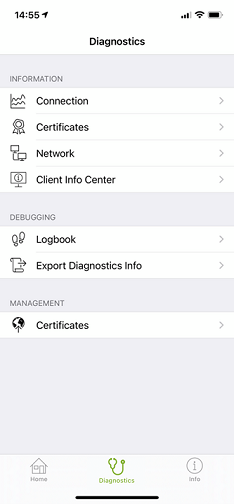
Diagnostics Menu
Juniper Secure Connect Diagnostics menu provides you various options to troubleshoot your VPN connection.
Diagnostics Menu Page
The Diagnostics page contains options related to troubleshooting as shown in Figure 1.
Connection Menu Option
To get the information related to current connection, choose Diagnostics > Information > Connection menu option. Figure 2 shows an example of connection related information for a VPN connection.
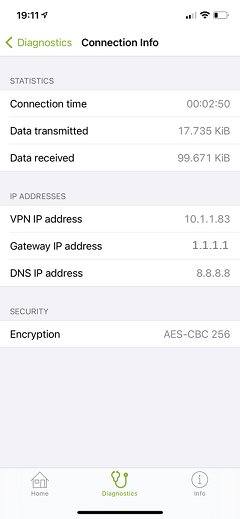
Table 1 shows the statistics, IP address, and security related information that Juniper Secure Connect displays about the current connection.
Connection Information |
Description |
|---|---|
Statistics |
|
Connection time |
Shows the time duration for which a user is connected with the same connection profile. Restarting the Juniper Secure Connect or changing the connection profile resets this value. |
Data transmitted |
Shows the data sent or transmitted over the VPN tunnel into the remote network while being connected to the same connection profile. Restarting the Juniper Secure Connect or changing the connection profile resets this value. |
Data received |
Shows the data received over the VPN tunnel into the remote network while being connected to the same connection profile. Restarting the Juniper Secure Connect or changing the connection profile resets this value. |
IP addresses |
|
VPN IP address |
Shows the private IP address of Juniper Secure Connect application. |
Gateway IP address |
Shows the gateway IP address of Juniper SRX Series Firewall. |
DNS IP address |
Shows the DNS IP address for Juniper Secure Connect application. |
Security |
|
Encryption |
Shows the encryption algorithm. |
Certificates Menu Option
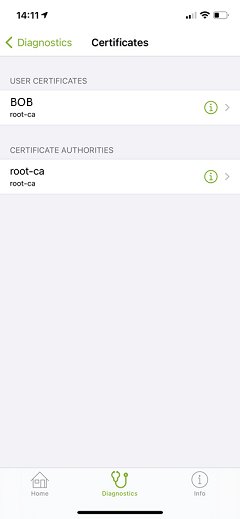
To get the information related to the certificates for the current connection, choose Diagnostics > Information > Certificates menu option. Figure 3 shows a sample imported certificate profile. Click on each certificate for more details of the certificate.
Network Menu Option
To get the network parameters for the network your iOS device is connected with, choose Diagnostics > Information > Network menu option. Figure 4 shows a sample network information of an iOS device.
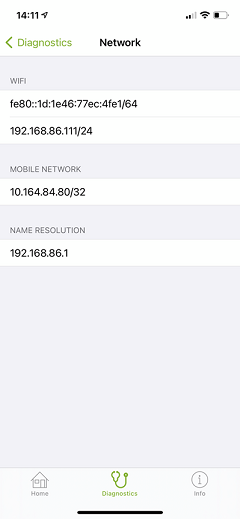
Table 2 shows the list of network parameters for an iOS device.
Network Parameter |
Description |
|---|---|
WiFi |
Shows the IP addresses assigned in the current connected WiFi network. |
Mobile network |
Shows the IP addresses assigned in the current connected mobile network. |
Name resolution |
Shows the DNS servers assigned in the current connected network. |
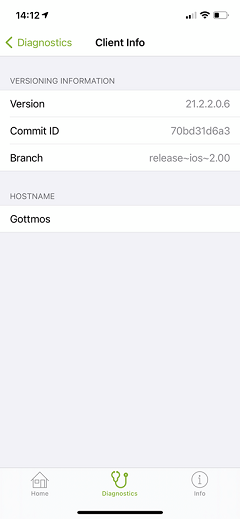
Client Info Center Menu Option
To get the information related to version information and hostname of your iOS device, choose Diagnostics > Information > Client Info Center menu option. Figure 5 shows a sample device information of an iOS device.
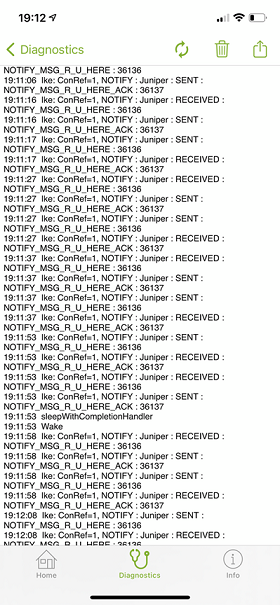
Error Log Menu Option
The log is continuously active in the background, even if the log window is closed. All the relevant Juniper Secure Connect communication events are saved in the log file. Navigate to Diagnostics > Debugging > Error Log to view the log messages. Click on the export icon right on top of the screen to send the log file through the offered applications.
Figure 6 shows a sample log message for an active VPN connection.
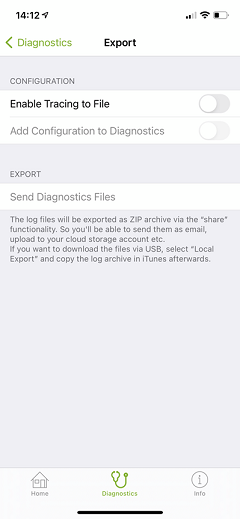
Export Diagnostics Info Menu Option
Navigate to Diagnostics > Debugging > Export Diagnostics Info menu option to archive and send the log file to the administrator through an e-mail or upload to your cloud storage, and so on. Optionally you can also add the configuration file generated on the device to your administrator along with the log file.
Figure 7 shows a sample Export page.
Certificates Import Menu Option
Certification Authority (CA) (also referred as the Issuer) creates and issues certificates using a PKI manager (software) and stores as a soft certificate. User certificates are stored as a PKCS#12 file (user.p12) in the installation path. CA Root certificates must have a .cer file extension and must be in DER format.
Execute the following command to export the certificate from the SRX Series Firewall:
request security pki local-certificate export certificate-id xxx type der filename /var/tmp/filename.cer
Following is an example of converting a PEM formatted/Base-64 certificate using OpenSSL.
openssl x509 -in /…/RootCA.pem -outform DER -out /…/RootCA.cer
Save the certificates in the application directory using files. On iOS email client, click and hold the certificate file until you see the Save to Files option. Now select Save to Files under Secure Connect folder location.
- Click the certificate of your choice to add to the iOS
keychain. Figure 8 shows an example
for successful importing of the certificates. Figure 8: Certificate Import Completed
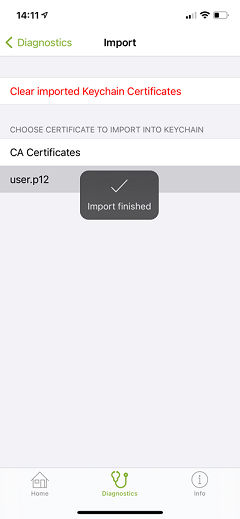
When the certificates have been imported into keychain, you can optionally view them under Diagnostics > Information > Certificates. At this page, you can also delete all imported certificates from the keychain by click on Delete Certificate Profiles.
We also recommend you to remove your user certificate from the local directory to secure the certificate.