
Juniper Security Director GUI Overview
Juniper Security Director provides an intuitive, GUI to help administrators monitor, configure, and manage network security. After a successful login, you are directed to the Monitor page by default. If you are a first-time user, onboarding or subscription-related pages might be displayed instead, based on assigned roles and permissions. The main navigation menu options and available actions vary based on your assigned access privileges.
The main components that you’ll use frequently on the GUI are:
-
Banner (top bar)
-
Main navigation menu (left pane)
Banner and GUI Elements
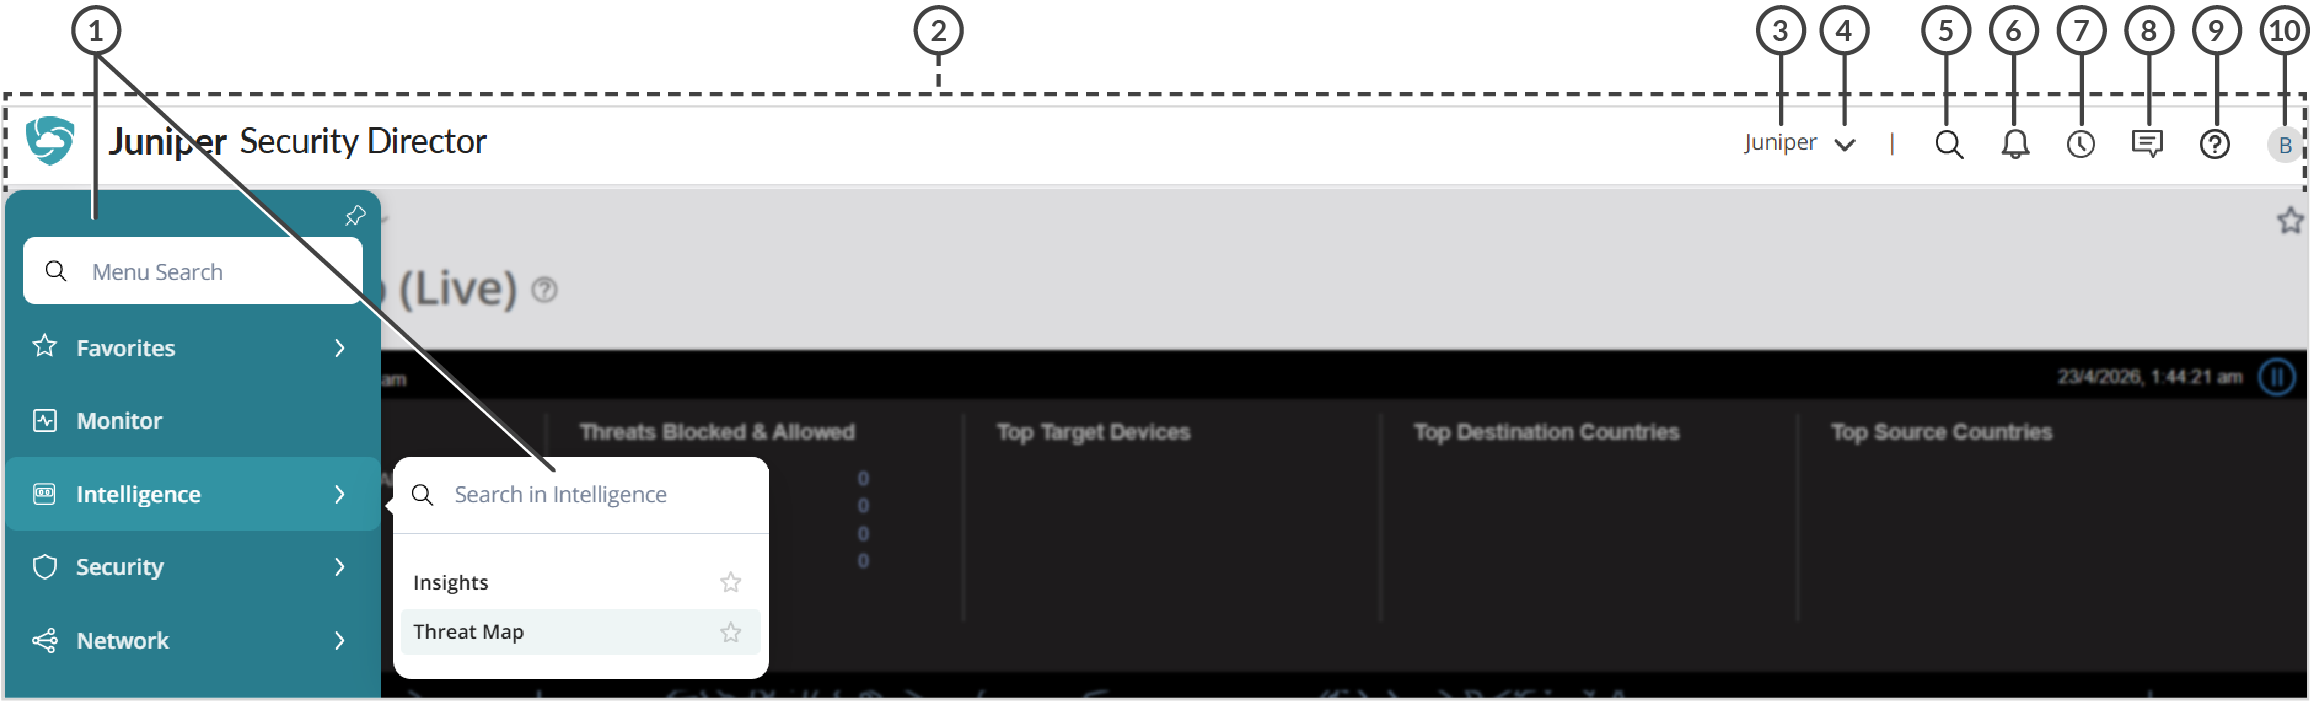
The banner is located at the top of the page with quick access to GUI elements that you’re likely to use regularly. See Figure 1 for a sample page showing the banner and GUI elements are explained in Table 1.
| Callout | GUI Element | Description |
|---|---|---|
|
1 |
Left pane - Menu bar and expanded menu search |
Search for a specific menu using full or partial keywords. |
|
2 |
Banner |
Access the frequently used icons and GUI elements. |
|
3 and 4 |
Organization name |
View the organization name that you are accessing. |
|
5 |
Global search |
Search for specific data, objects, or criteria such as:
Click the result to navigate to the specific page in the GUI. |
|
6 |
Alerts |
View event-based alerts generated by system events that match the respective configured alert definitions. The generated alerts help you to identify problems in the monitored network environment. Click Review All to view event-based alerts. |
|
7 |
Scheduler |
View all scheduled and running jobs in Juniper Security Director. A maximum of 5 recent jobs are listed. |
|
8 |
Send feedback |
Send feedback to the Juniper Security Director team for feature enhancements or new feature requests. |
|
9 |
Help (?) menu |
Click ? to access the help menu. The Need help? page is displayed, which provides links to:
|
|
10 |
User account icon |
Click the user account icon to:
|
Main Navigation Menu
The main navigation menu on the left side of the GUI is minimized by default. You can hover over or click the menu toggle icon to expand the menu and access all available features. An example of the expanded menu is shown in Figure 1.
Table 2 describes the menus available in the Juniper Security Director main navigation menu and provides a brief overview of each item.
| Menu | Description |
|---|---|
|
Monitor |
Monitor your network through customizable and interactive widgets. The dashboard enables you to select the data to be displayed on the dashboard. You can switch between general and security data. |
|
Intelligence |
Gain visibility into the key security domains and traffic patterns, including geographic areas representation of inbound and outbound traffic. |
| Security | Create, deploy, and monitor security policies. You can also manage shared objects, configure VPNs, and enable a wide range of security services. |
| Network | Create, edit, and monitor NAT policies and pools to control how internal and external network addresses are translated. |
| Inventory | Manage CSDS groups, customized configurations templates, devices, security packages, and the life cycle of images of all network devices. |
| Operations | Create, schedule, and manage alerts. You can also view and analyze security logs, and generate detailed reports on network activity and security events. |
| Admin | Manage system settings, user accounts, roles, licenses, and subscriptions. You can also handle device configurations, auditing, data management, backups, job scheduling, and overall system maintenance from a centralized administrative interface. |
We have redesigned the menu to make navigation simpler, more organized, and mobile-friendly. Table 1 shows the mapping between the old and new menu navigation. Menus have been consolidated for easier access, improved categorization of items, and enhanced accessibility.
| Old Menu | New Menu |
|---|---|
Breadcrumbs and Page‑Level GUI Elements
Each page includes breadcrumbs and other page-level GUI elements to help you quickly navigate pages and perform actions.
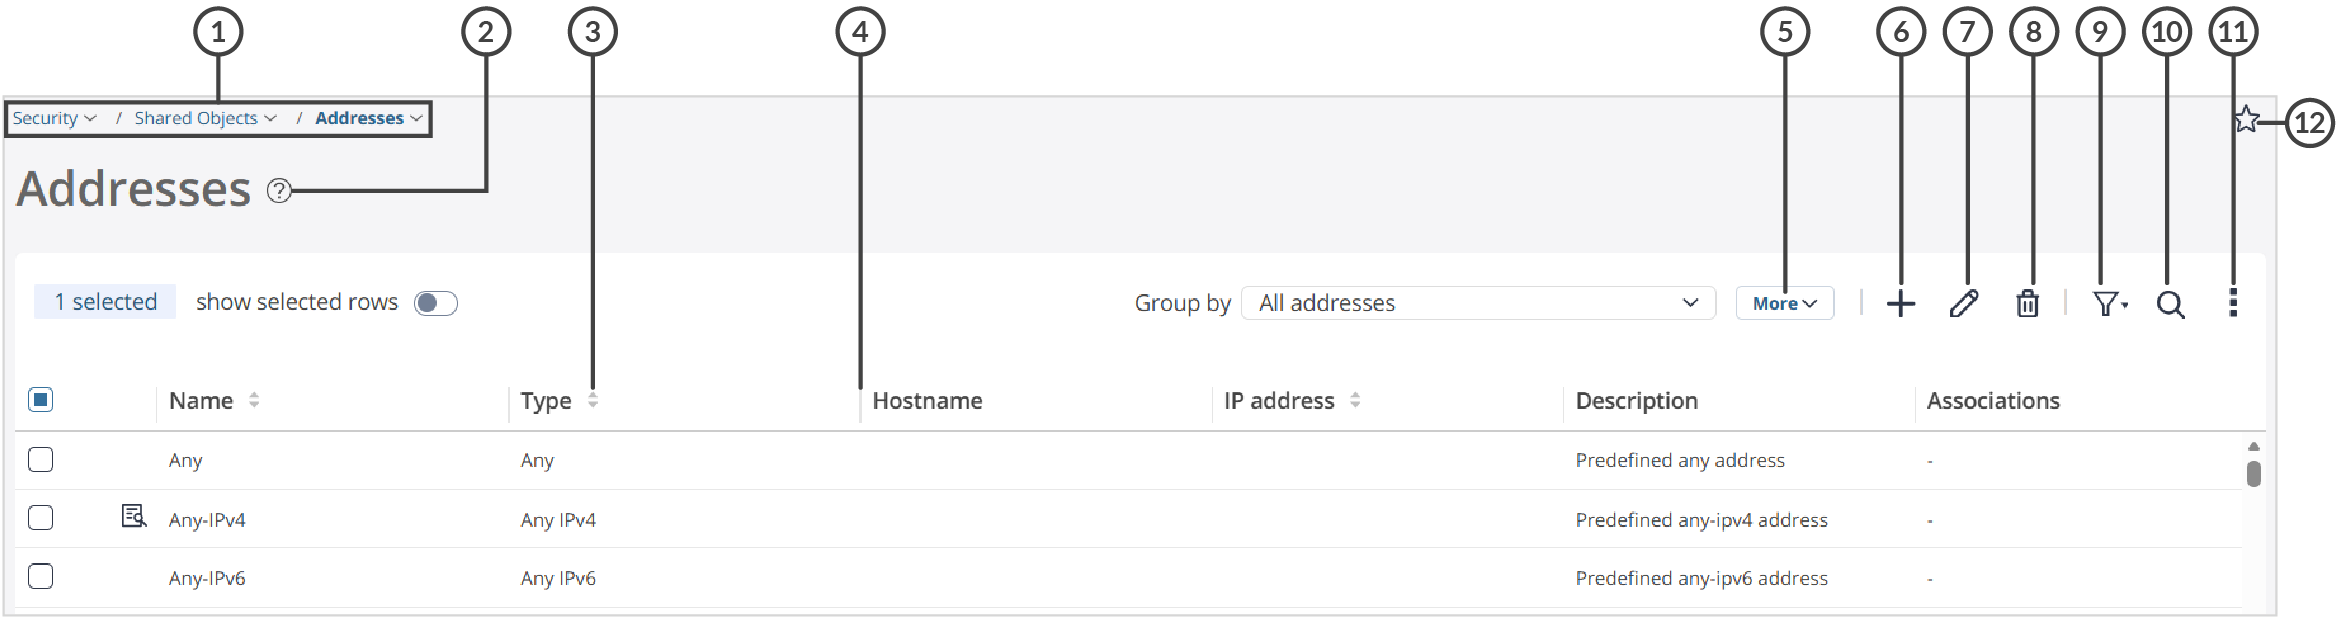
Figure 2 shows the breadcrumbs and other page-level GUI elements. Table 4 provides a high-level explanation of their functions.
| Callout | GUI Elements | Description |
|---|---|---|
|
1 |
Breadcrumbs |
Displays menu structure and provides an alternative way to navigate the menu. Click the down arrow next to a breadcrumb to access the menu entries at that menu level. |
|
2 |
Page Help icon |
Click or hover over ? to view help text for the page, then select More… to view the corresponding help topic within the GUI. |
|
3 |
Sort icon |
Click the sort icon next to a column label in a table to sort data for that column. The shaded part of the icon indicates whether the data is sorted in ascending or descending order. |
|
4 |
Column resize icon |
Move your mouse between two column headers until you see the column resize icon. Then right-click, hold, and drag the mouse to resize the column. |
|
5 |
More drop-down list |
Click to see additional page‑specific tasks that you can perform. |
|
6 |
Add or Create (+) icon |
Add or create an entity; for example, create a site. |
|
7 |
Edit (pencil) icon |
Modify an existing entity; for example, modify a site. |
|
8 |
Delete (trash can) icon |
Delete an entity; for example, delete a site. |
|
9 |
Filter (funnel) icon |
Hover over or click the filter icon to access the filtering menu. Apply one or more filters to the data in the table and, if needed, save the filters. |
|
10 |
Search (magnifying glass) icon |
Click to find specific data in the table. Enter one or more keywords and press Enter to filter the results. To reuse the search later, click Save to store it as a filter. To clear the search and display all data, click X. |
|
11 |
Column and Page preferences menu |
Click or hover over the vertical ellipsis to access the column and page preferences menu, then select or clear check boxes to show or hide table columns. |
|
12 |
Favorite icon |
Mark pages as favorites for quick access or remove previously saved favorites. |
Favorites
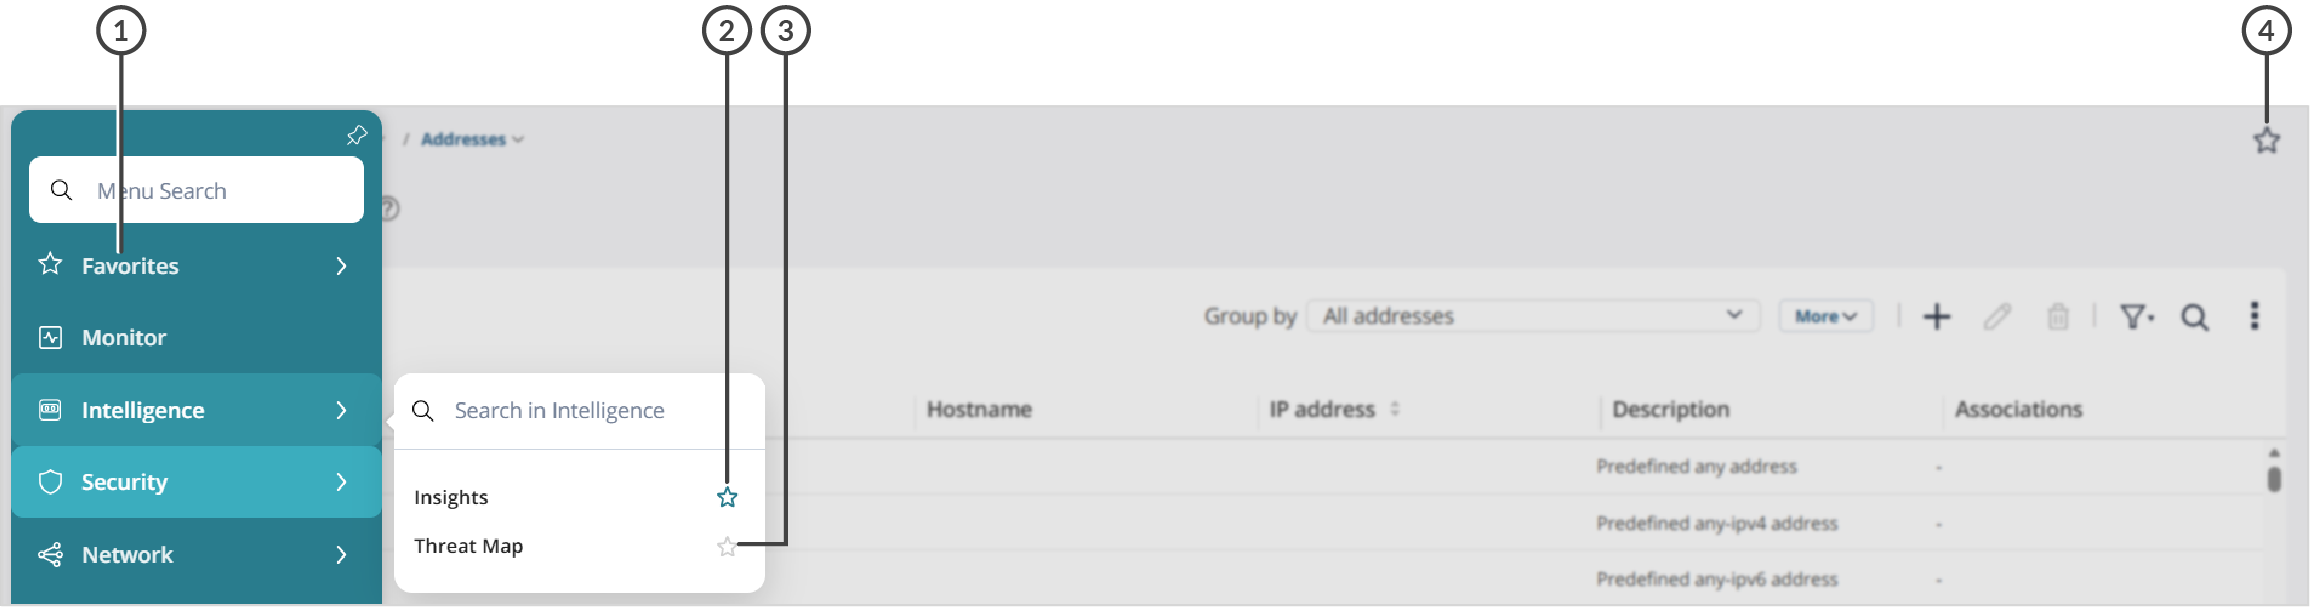
In Juniper Security Director GUI, you can mark frequently used pages as favorites to access them quickly. Figure 3 shows a sample page with the Favorites menu and related icons.
| Callout | GUI Elements | Description |
|---|---|---|
|
1 |
Favorites menu |
Shows all the pages you’ve saved for quick access. You can view, search, or remove your favorite pages. |
|
2 and 4 |
Add a page as favorite |
Click the star icon next to a menu item or at the top‑right corner of a page to add a page to favorites. The shaded (filled) outline star icon indicates that the page is saved and available in the Favorites menu for quick access. |
|
3 |
Page not marked as favorite or removed from favorites |
An empty (unshaded) star icon indicates that the page is not marked as a favorite or has been removed from favorites. To remove a saved page, click the shaded (filled) outline star icon in the Favorites menu, next to the menu item, or at the top‑right corner of the page. After the page is removed, it no longer appears in the Favorites menu. |