Threat Map Overview
Threat maps are a visual representation of cybersecurity incidents and threats occurring in real-time. Threat maps provide comprehensive security features, including real-time monitoring to track blocked and allowed threat events, and geographical insights to identify attacking countries.
The Juniper Security Director threat map provides a visualization of the geographic regions for incoming and outgoing traffic. You can use its color-coded visualizations for a quick threat analysis, while its centralized management interface allows streamlined oversight of the security policy lifecycle through customizable dashboards and reports.
Benefits
-
Real-time monitoring—View blocked and allowed threat events in real-time, which helps in identifying unusual activity that could indicate a possible attack.
-
Geographic insights—Find the country that is attacking your firewall devices the most, providing valuable geographic insights into potential threats.
-
Color-coded threats—Get a quick view of the total number of blocked and allowed threat events and individual counts for each event from the color-coded threats.
-
Top targeted devices and countries—Get a quick view of the top targeted devices, top destination countries, and top source countries, which help in identifying high-risk areas.
-
Centralized management—Manage all phases of the security policy life cycle using customizable dashboards and reports of the threat map, which is part of a centralized management interface.
Types of Threats Detected
Use the Threats Detected information to understand about the various types of threats that the threat map identifies, including details about threats that were successfully blocked and those that were permitted.
|
Threat Feed |
Detected Attack |
|---|---|
|
IPS threats |
Intrusion detection and prevention (IDP) attacks detected by the IDP module.
|
|
Virus |
Virus attacks detected by the antivirus engine.
|
|
Spam |
E-mail spam detected based on the blocklist of spam e-mails.
|
|
Screen |
Type of threat detected by SRX Series Firewalls.
|
How to Use the Threat Map
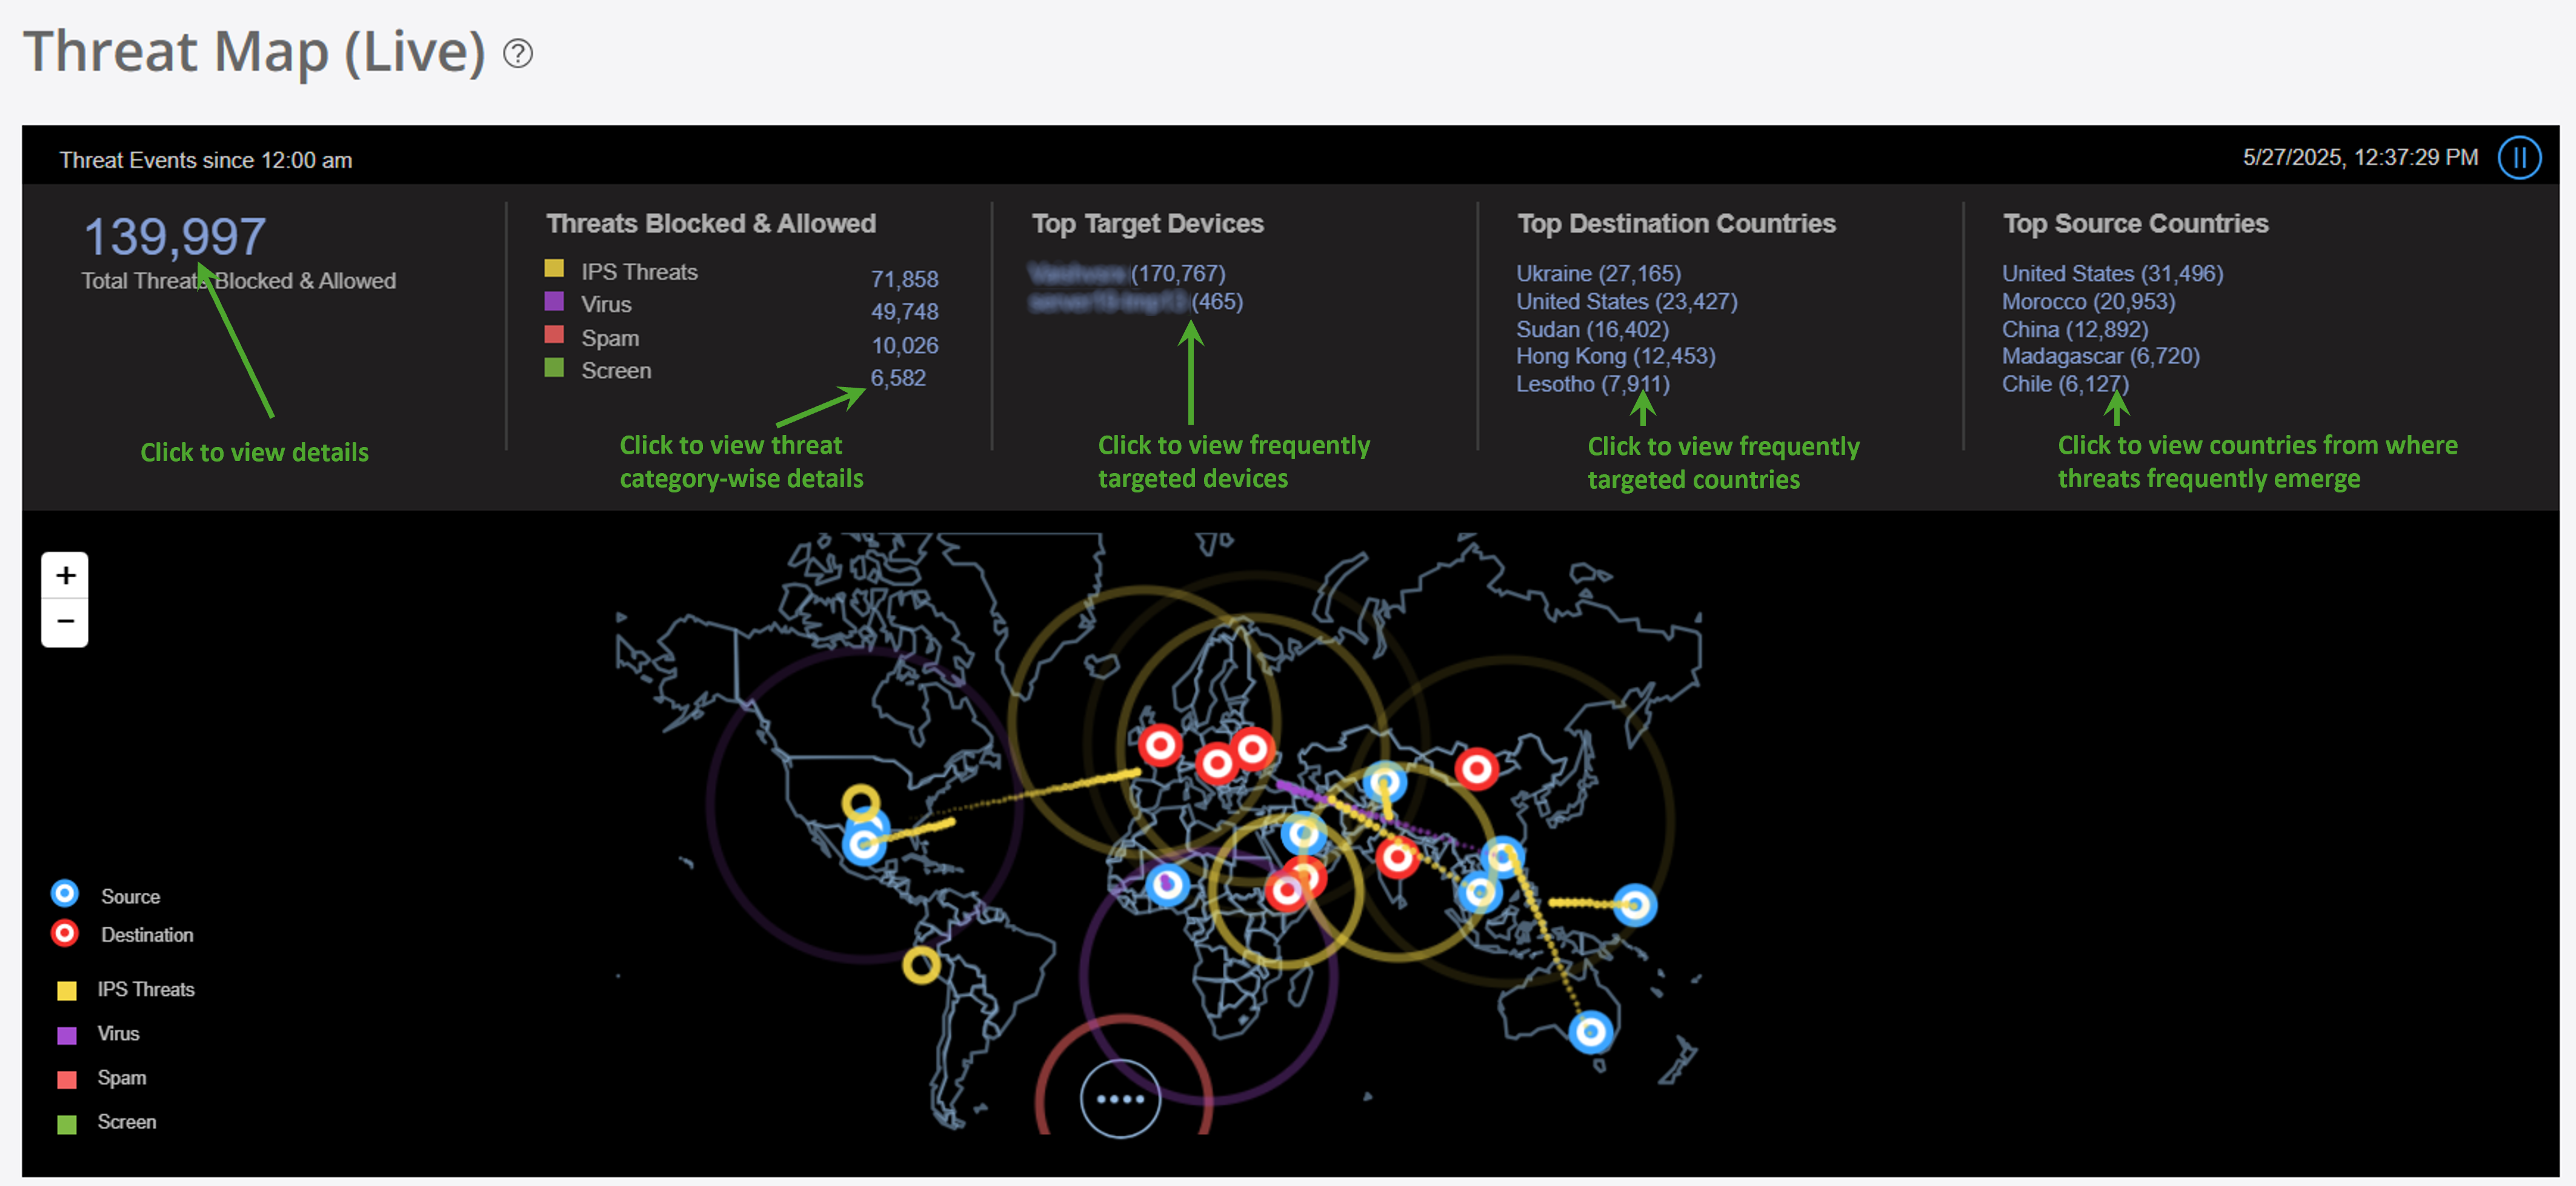
You can view the total blocked and allowed threats, the most frequently targeted devices, and the top destination and source countries of the threats on the Threat Map. Clicking the information on the threat map banner opens the relevant Juniper Security Director pages with more details about the threats.
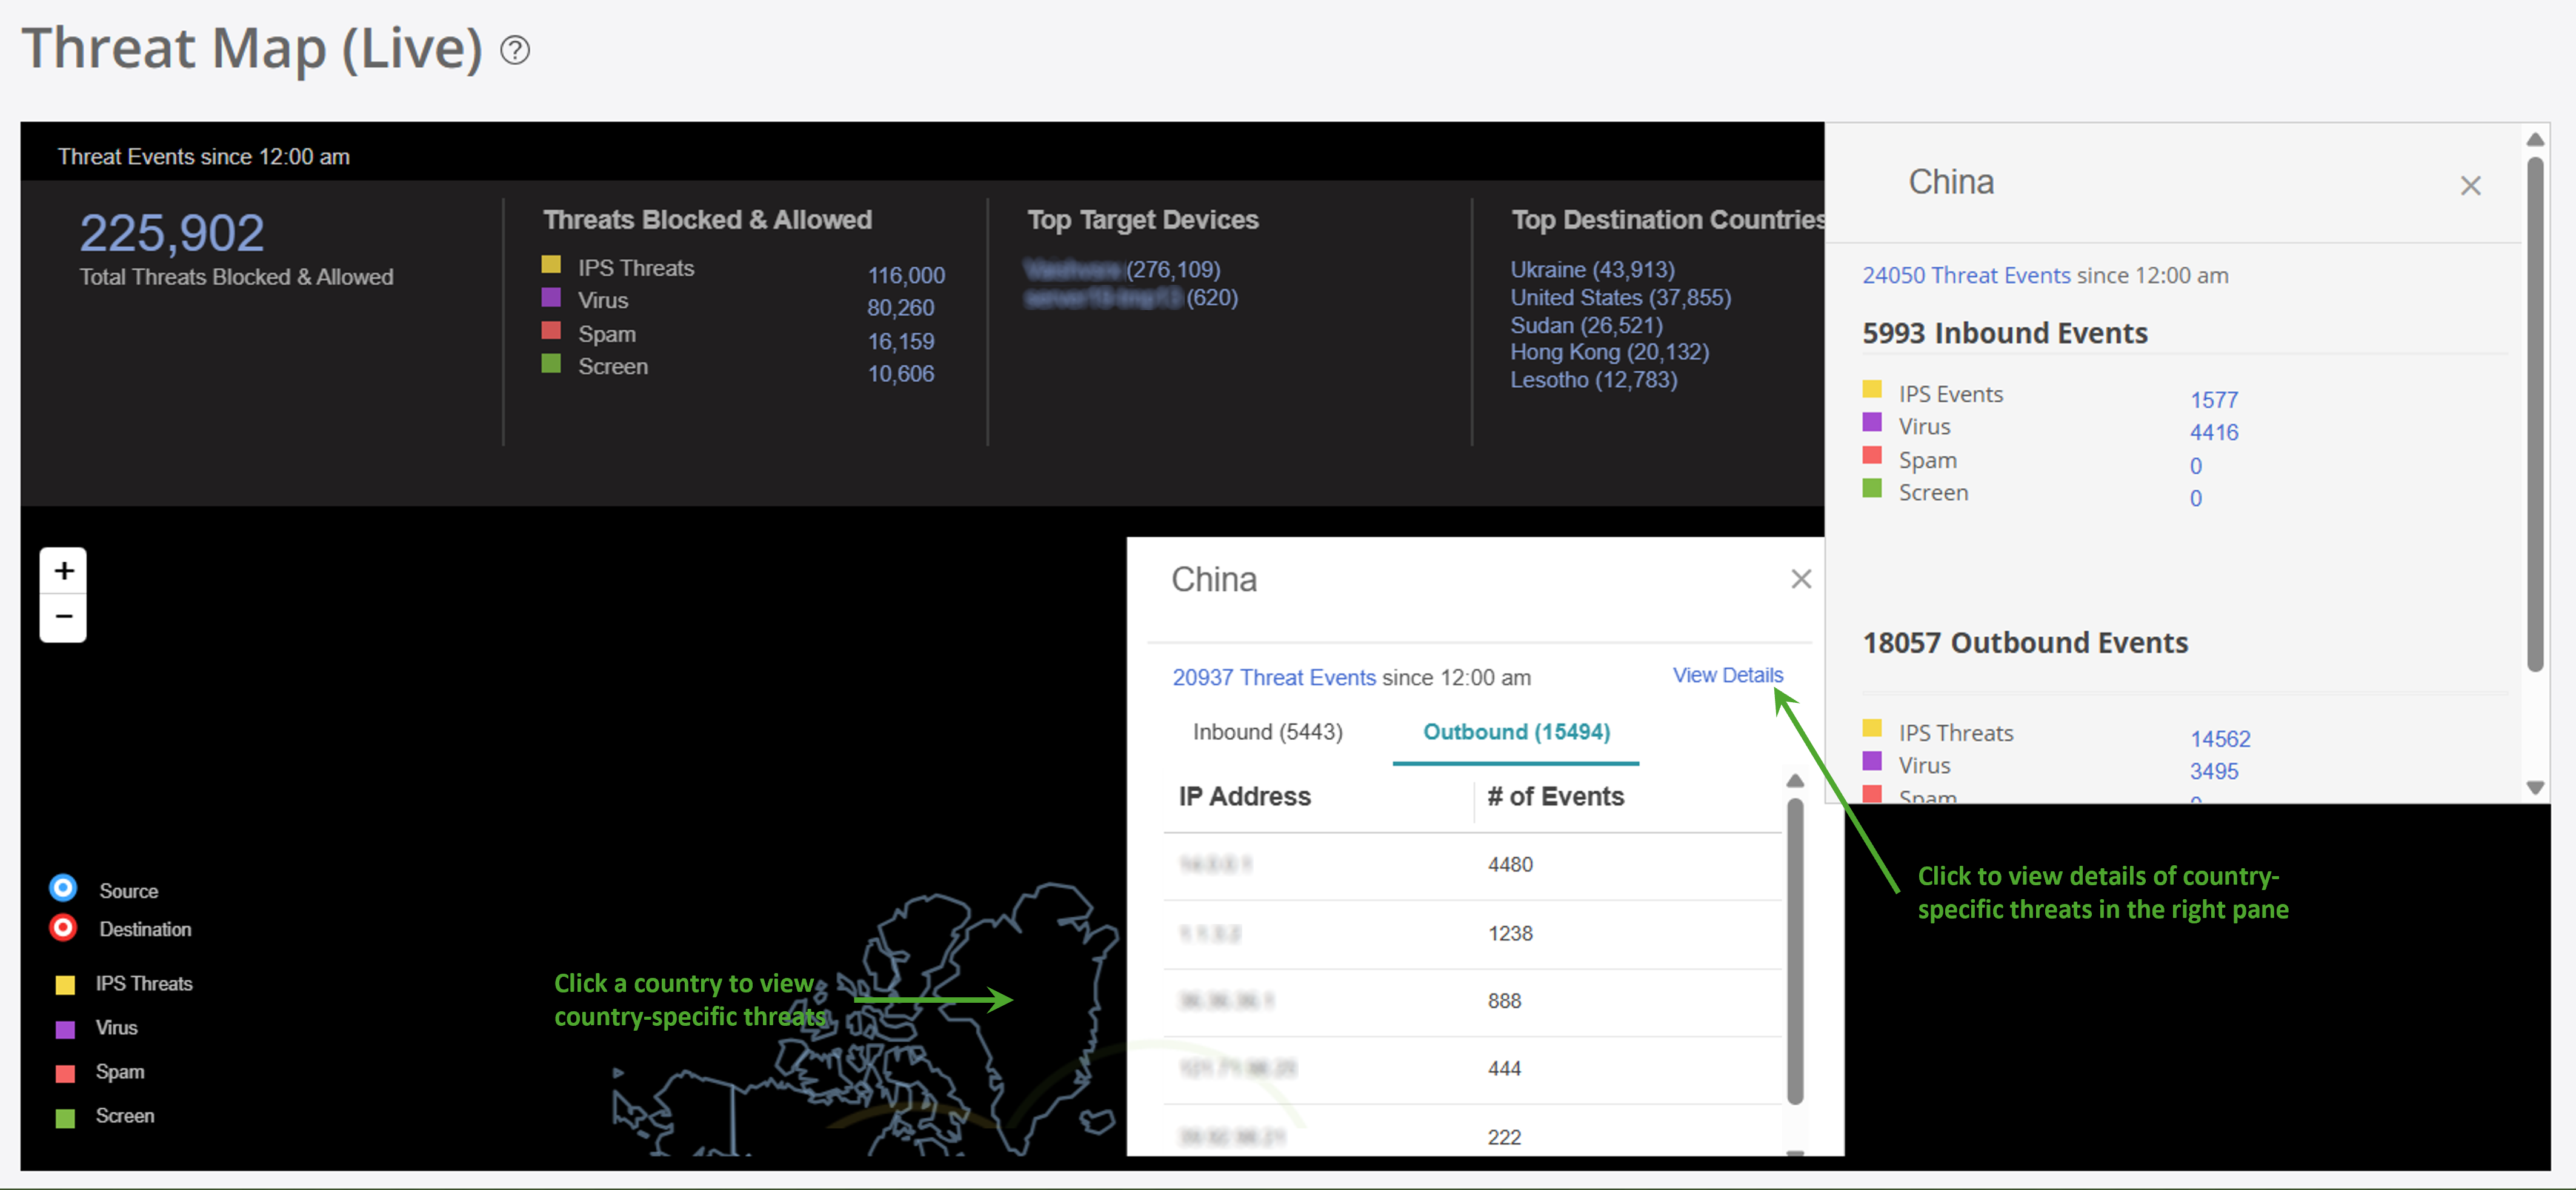
You can view a detailed analysis of threats by country, outlining the specific types of threats each country faces in Country-specific Details in Threat Map. You can also view blocked and allowed threat events based on feeds from IPS, antivirus, antispam engines, and screen attempts in the details.
Use the Threat Map Components to understand about the types of information you can view by clicking different areas on the threat map.
|
What You Can See |
How to See |
Where on the Threat Map |
|---|---|---|
|
Color-coded threat summary—A summary of the threat events:
|
See color-coded threats at the top of the page. |
Summary at the top of the threat map |
|
Location-specific threats—The number of threat events for the location. The threat count is useful to view unusual activity that could indicate a possible attack. |
Click a specific location to see the number of threat events for the location. |
Geographic location |
|
Threat feed-specific details—The threat event details from a specific threat feed. The data on the Threats page is filtered based on the threat you click. For example, if you click the threat count of the IPS threats, the filtered results display only the IPS threat logs. |
Click a threat in the summary to display the Threats page. |
Threat |
|
Source or destination-specific details—The threat event details specific to a source or detination point.
|
Click any individual source or destination point on the threat map. Click the attack type and see the filtered list of events from the Event Viewer. |
Source or destination point |
|
Country-specific threats—The details about the threat events for a specific country.
|
Click a country on the threat map. Click View Details to see more details about the country on the right panel, such as the total number of inbound and outbound threats for each event. |
Country |
|
Undefined threats—The undefined threat events. Threats with unknown geographical IP addresses are displayed as undefined. |
Click the pause icon ( |
Undefined threat events overlay |
Threat maps help enhance your security posture by giving you clear insights and a detailed visibility into application performance, all while reducing risk with automated threat detection and response.