Insights Overview
Visibility into the network environment offers actionable insights into performance, security, and reliability. By continuously analyzing data from devices, applications, and traffic flows, users can proactively detect anomalies, resolve issues, and refine performance.
Juniper Security Director Cloud offers comprehensive visibility across key security domains, such as, Applications, URL filtering, Threats, Users, Content Filtering, Anti-malware, SecIntel, DNS Security, IDP, and Screens. Insights are displayed using a color-coded bubble chart, where each bubble presents specific details about the selected category. The color and size variations help you analyze complex data and troubleshoot issues. You can switch to grid format for a tabular view.
Both the chart and grid display information sourced from syslog data.
Benefits
-
Threat detection and response—Detect anomalies using real-time insights and respond to threats before security-related issues escalate.
-
Performance optimization—Monitor traffic flows and application behavior to detect and resolve network congestion, misconfigurations, and underutilized resources—boosting overall network performance.
-
Operational efficiency—Prioritize security-related issues, automate responses, and reduce MTTR to reduce outages and troubleshoot faster.
-
Anomaly detection—Detect unusual spikes in DNS queries or requests to suspicious domains which indicate signal compromise and deviation.
-
Strategic planning—Plan your network architecture capacity and security-related investments using long-term insights into usage trends and threat patterns.
Before You Begin
-
Check the device subscriptions—To view data from devices and device groups, verify the license subscription status of your devices. You should verify both Juniper Security Director Cloud subscription and the SRX Series Firewall feature licenses. The subscription and the licenses determine which insight data and licensed features—such as SecIntel and IDP—you can view. See Device Subscriptions and Subscriptions Overview
SRX Series Firewall Feature License Juniper Security Director Cloud Subscription Description No Trial Subscription -
View application and user data insights.
-
Log retention is for 7days.
Yes SRX Series Firewall Management Subscription -
View insights from application data, user activity, and licensed features.
-
Log retention is calculated automatically based on the storage linked to the subscription.
Yes SRX Series Firewall Management Subscription and Storage Subscription -
View insights from application data, user activity, and licensed features.
-
Log retention is calculated automatically based on the storage linked to the subscription.
-
-
Check the security logs configurations—To view the monitoring and reporting data, configure devices to stream security logs to Juniper Security Director Cloud. You can view the Insights data only if Security Logs are configured on the revenue port. See Configure Security Logs.
-
Check Junos or Apptrack logs—All raw logs must be displayed on the All Security Events page and the Sessions page. See All Security Events Overview and Session Overview.
Application Insights
You can monitor the applications running on your network and protect your network against application-level threats. It provides visibility into which applications are consuming network resources, enabling you to manage traffic by applying policies, prioritizing critical applications, or blocking unauthorized ones.
The historical data is not available on the new Application Insights page. To view historical data, see the Sessions page and the All Security Events page on the UI.
To access this page, click .
View Top Application Details
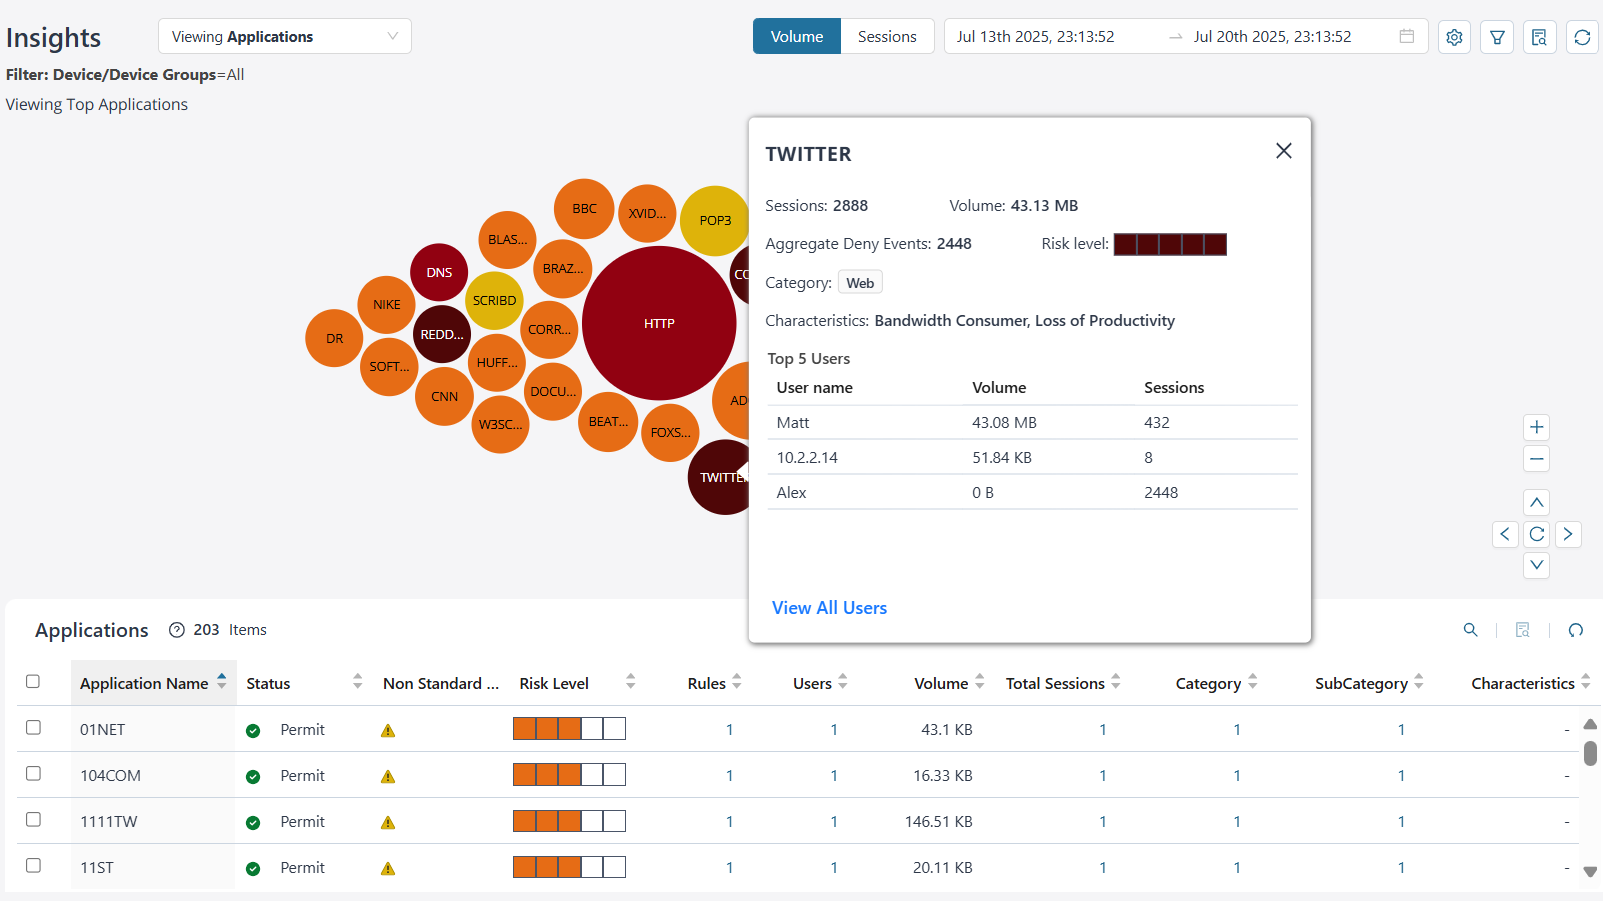
By default, you can view the top application's data for all devices and device groups based on the volume. The data is presented graphically as a zoomable bubble graph. Bubble sizes vary depending on the selected metric—either volume or session count. The data is refreshed automatically based on the selected time range.
Click the bubble to view the selected application details. You can view critical information such as the total number of sessions, the bandwidth consumed by the application, the sessions denied, the risk level, the category, and the characteristic. You can also view the top five users accessing the application. Click View All Users to navigate to the User Insights page.
| What You Can Do | How |
|---|---|
| View application data based on volume or sessions. | Select from the following options to view the application
data:
|
| View application data for a time range | Click the calendar ( The maximum time range is 14 days. |
| View application insights based on your settings |
|
| Filter application data | To view specific data, filter based on devices, device groups, or zones. To save filters:
To view data instantly based on devices, device groups or zones, select the values on the Filter page and click Apply. The data is refreshed on the bubble chart and the grid. Click Reset to clear the fields on the Filters page. |
| View summary of application insights | Click the View details ( |
| Reset all application filter | Click the Reset all filters ( |
You can also view data in a sortable grid format, which allows easy comparison across columns. You can sort the applications in an ascending or descending order based on application name, status, risk level, rules, users, volume, total sessions, category, subcategory, and characteristics.
If the data presented on the bubble chart is not visible within the grid, sort the grid by the appropriate column or use the search functionality to efficiently filter and retrieve the required information.
| Field | Description |
|---|---|
| Application Name | The name of the application. For example, Amazon, Facebook. |
| Status | Indicates the security policy action for the application— Permit, Reject, or Deny. |
| Non Standard Port | Indicates that the application is using a non standard port. |
| Risk level | The risk associated with the application—Critical, High,
Moderate, Low, and None. The risk levels are indicated by color
codes.
|
| Rules | The number of rules across devices where the application is
configured. Click the link in the Rules column to navigate to the Security Policies page. Click OK. |
| Users | The total number of users accessing the application. Click the link in the Users column to navigate to the User Insights page. |
| Volume | The bandwidth used by the application. |
| Total Sessions | The total number of application events generated by devices.
Click the link in the Total Sessions column to navigate to the Sessions page with the filter applied for detailed logs. Click OK. |
| Category | The category associated with the application signature. For
example, Web, infrastructure. Click the link in the Category column to view the category. |
| Subcategory | The subcategory associated with the application signature. For
example, social networking, news, advertisements. Click the link in the Subcategory column to view the subcategory. |
| Characteristics | The characteristics associated with the application signature.
For example, prone to misuse, bandwidth consumer, capable of
tunneling. Click the link in the Characteristics column to view the characteristics. |
URL Filtering Insights
URL filtering enhances visibility into network traffic by monitoring and controlling website access. It helps you defend against cyberthreat, enforce acceptable use policies, and better understand user behavior. By analyzing URL filtering logs and reports, you can detect security risks, refine network performance, and strengthen overall security posture.
To access this page, click and then from the Insights drop-down list, select URL Filtering.
View Top URL Categories
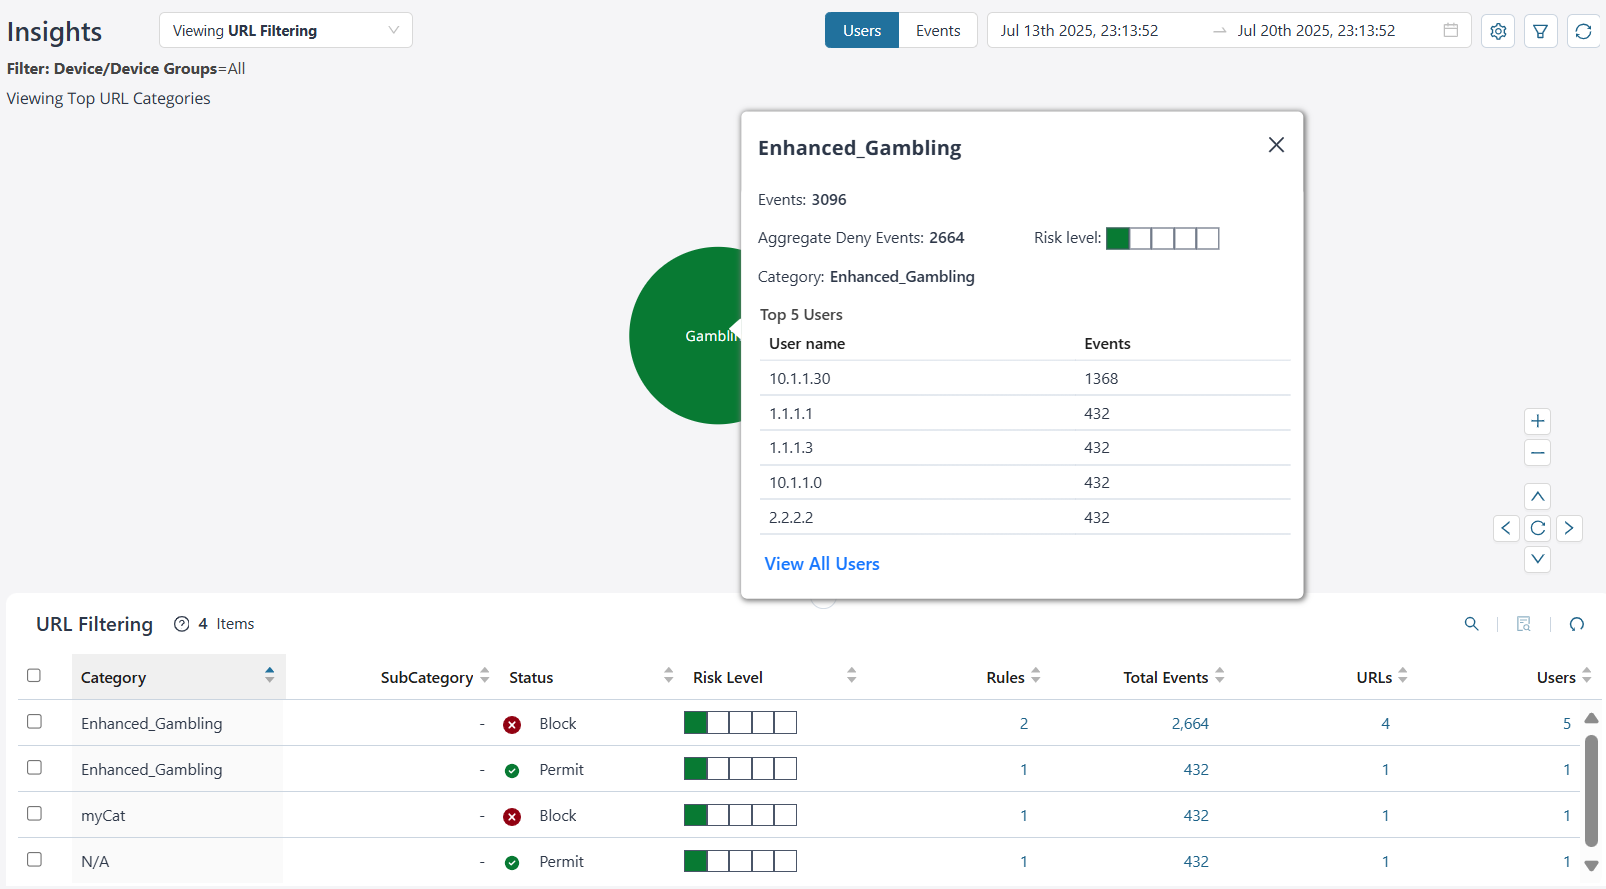
By default, you can view the top URL category data for all devices and device groups based on the users. The data is presented graphically as a zoomable bubble graph. Bubble sizes vary depending on the selected metric—either users or event count. The data is refreshed automatically based on the selected time range.
Click the bubble to view the selected URL category details. You can view critical information such as the number of URL category events generated for devices, the number of events denied, the risk level, the category, and the top five users accessing the URLs. Click View All Users to navigate to the User Insights page.
| What You Can Do | How |
|---|---|
| View URL categories based on users or events | Select from the following options to view the URL category
data:
|
| View URL category data for a time range | Click the calendar ( The maximum time range is 14 days. |
| View URL category insights based on your settings |
|
| Filter URL category data | To view specific data, filter based on devices, device groups, or zones. To save filters:
To view data instantly based on devices, device groups or zones, select the values on the Filter page and click Apply. The data is refreshed on the bubble chart and the grid. Click Reset to clear the fields on the Filters page. |
| Reset all URL category filter | Click the Reset all filters ( |
You can also view data in a sortable grid format, which allows easy comparison across columns. You can sort the URL categories in an ascending or descending order based on category, status, risk level, rules, total events, volume, URLs, and users.
If the data presented on the bubble chart is not visible within the grid, sort the grid by the appropriate column or use the search functionality to efficiently filter and retrieve the required information.
| Field | Description |
|---|---|
| Category | The name of the URL category. For example, gambling, news. |
| Subcategory | The name of the subcategory. For example, social networking. |
| Status | The status of the URL category—Permit or Deny |
| Risk Level | The risk associated with the URL category—Critical, High,
Moderate, Low, and None. The risk levels are indicated by color
codes.
|
| Rules | The number of rules across devices where the URL category is
configured. Click the link in the Rules column to view the list of profile names. |
| Total Events | The total number of URL category events generated by devices.
Click the link in the Total Events column to navigate to the Sessions page with the filter applied for detailed logs. |
| URLs | The total number of URLs for a specific category and
subcategory. Click the link in the URLs column to view the list of URLs. |
| Users | The total number of users accessing the URLs. Click the link in the Users column to navigate to the User Insights page. |
Threats Insights
Threat delivers real-time and historical threat visibility. Threat visibility in network monitoring is crucial for early threat detection and effective incident response. By providing a clear view of network traffic and behavior, you can identify anomalies, malicious activity, and potential vulnerabilities to proactively mitigate risks and minimize damage from security incidents.
To access this page, click and then from the Insights drop-down list, select Threats.
View Top Threat Details
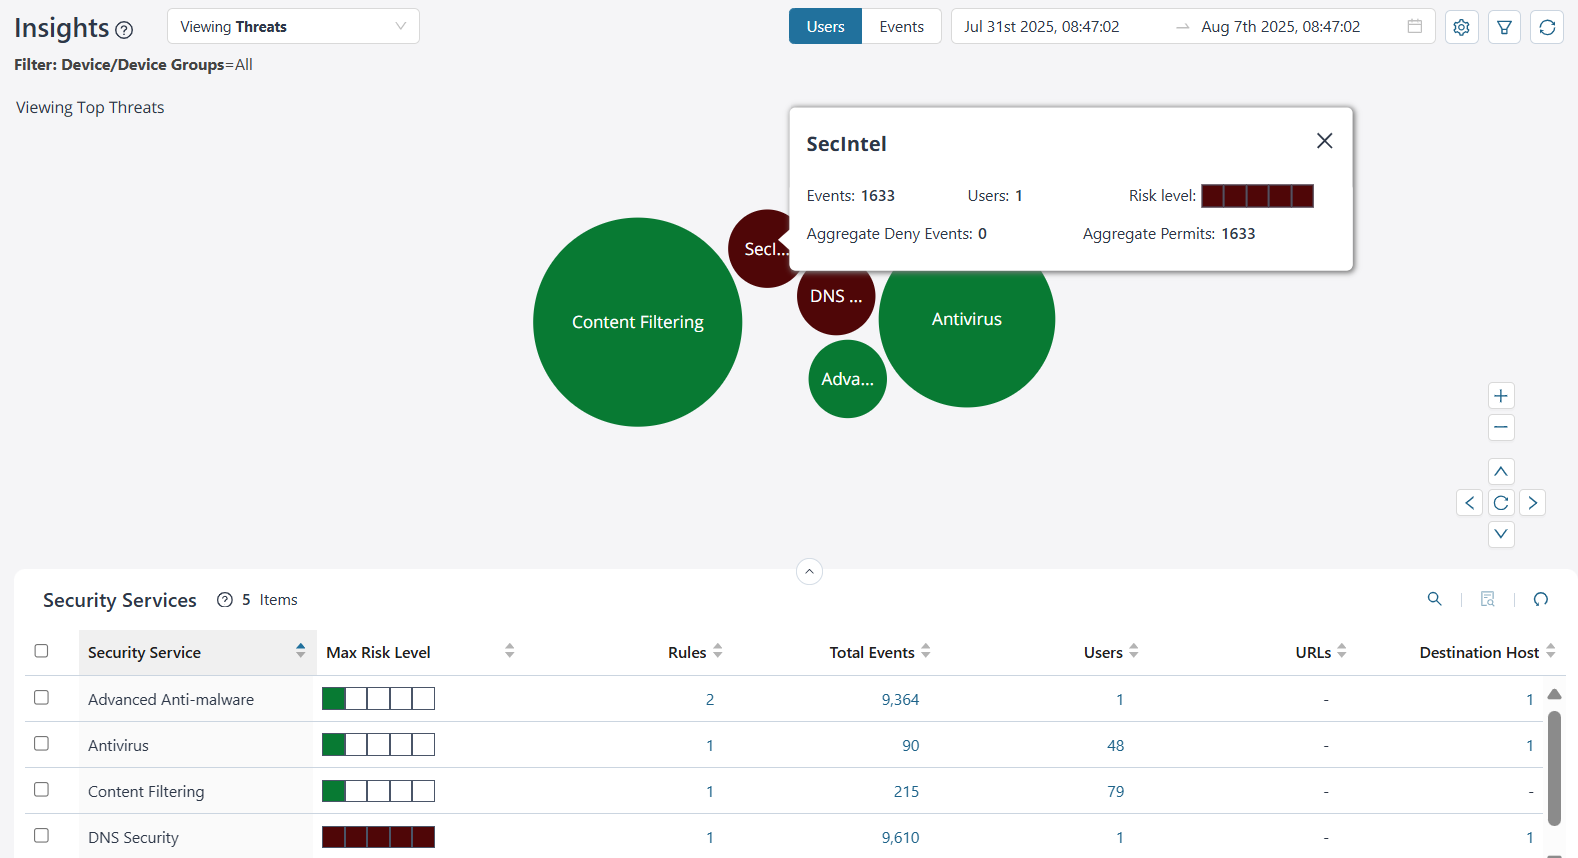
By default, you can view the top threat data for all devices and device groups based on the users. The data is presented graphically as a zoomable bubble graph. Bubble sizes vary depending on the selected metric—either users or events count. The data is refreshed automatically based on the selected time range.
Click the bubble to view the selected threat details. You can view critical information such as the total number of threat events, the users impacted by the threat, the aggregate threat events that were denied and permitted, and the risk level of the threat. The bandwidth consumed is shown for content filtering security service only.
| What You Can Do | How |
|---|---|
| View threat data based on users or events. | Select from the following options to view the threat data:
|
| View threat data for a time range | Click the calendar ( The maximum time range is 14 days. |
| View threat insights based on your settings |
|
| Filter threat data | To view specific data, filter based on devices, device groups, or zones. To save filters:
To view data instantly based on devices and device groups or zones, select the values on the Filter page and click Apply. The data is refreshed on the bubble chart and the grid. Click Reset to clear the fields on the Filters page. |
| Reset all threat filter | Click the Reset all filters ( |
You can also view data in a sortable grid format, which allows easy comparison across columns. You can sort threats in an ascending or descending order based on the security service, status, risk level, rules, total events, users, source host, and destination host.
If the data presented on the bubble chart is not visible within the grid, sort the grid by the appropriate column or use the search functionality to efficiently filter and retrieve the required information.
| Field | Description |
|---|---|
| Security Service | The type of threat. For example, IDP, Antivirus. |
| Max Risk Level | The risk associated with the threat—Critical, High, Moderate,
Low, and None. The risk levels are indicated by color codes.
|
| Rules | The number of rules configured across devices for the security
service. Click the link in the Rules column to view the list of rule names or profile names configured for the security policy. |
| Total Events | The total threat events generated by device. Click the link in the Total Events column to navigate to the All Security Events page with the filter applied for detailed logs. Click OK. |
| Users | The total number of users accessing the security services.
Click the link in the Users column to navigate to the User Insights page. |
| URLs | The source IP address from where the threat originated. Click the link in the URLs column to view the URL for the security services. |
| Destination Host | The target IP address to which the threat is destined. Click the link in the destination host column to display the destination IP addresses. |
User Insights
User visibility provides identity-based analytics that correlate security events with individual users.
The historical data is not available on the new User Insights page. To view historical data, see the Sessions page and the All Security Events page on the UI.
To access this page, click and then from the Insights drop-down list, select User.
View Top User Details
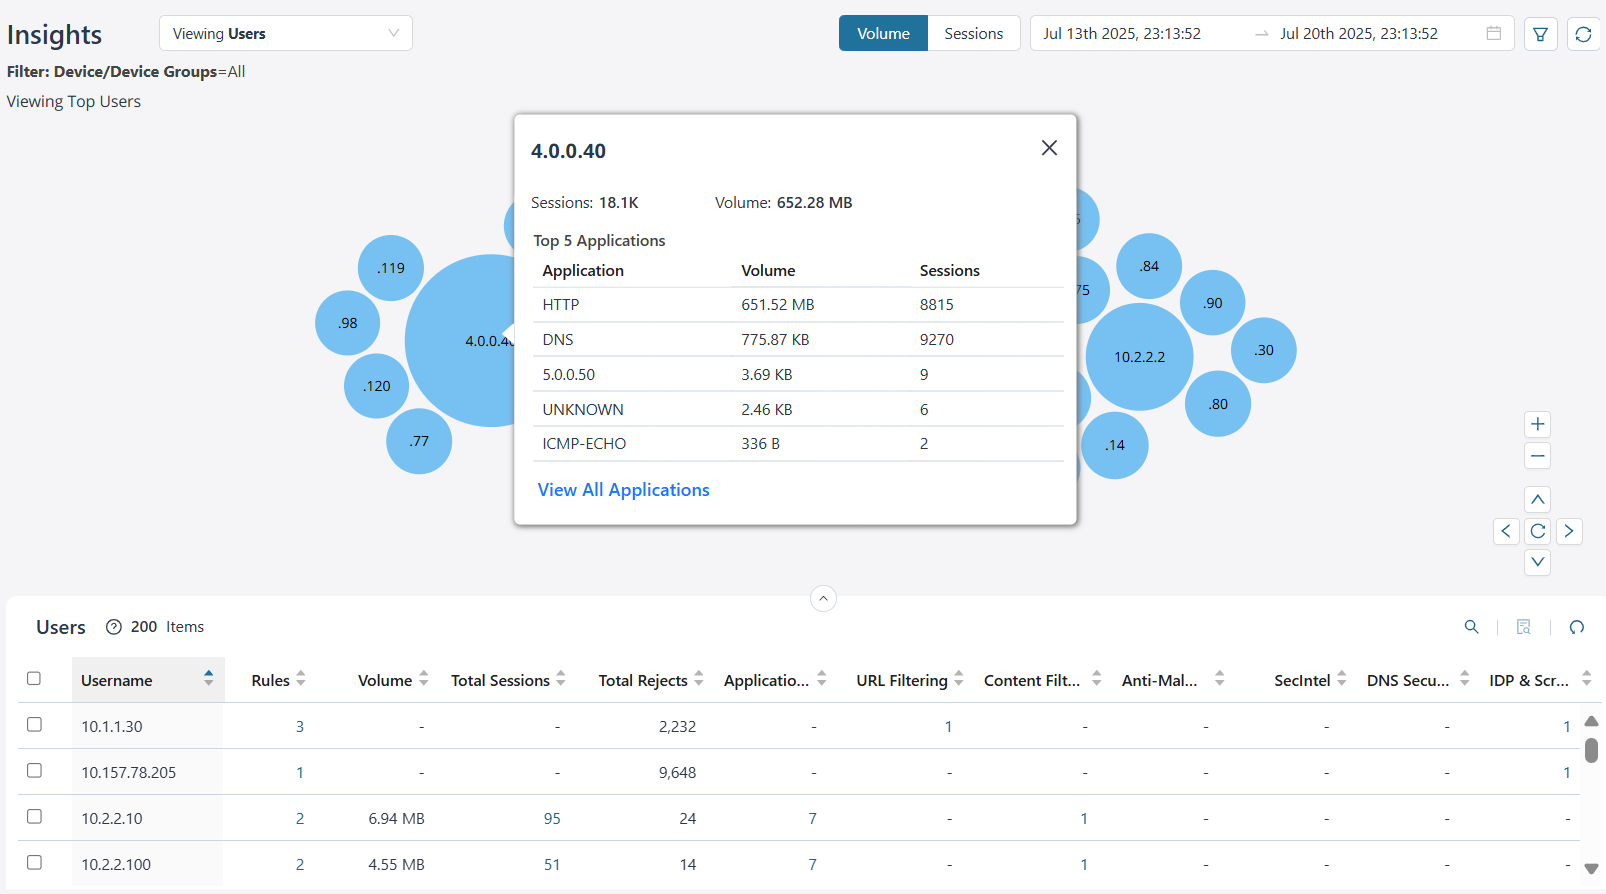
By default, you can view the top users' data for all devices and device groups based on the volume. The data can be presented graphically as a zoomable bubble graph. Bubble sizes vary depending on the selected metric—either volume or session count. The data is refreshed automatically based on the selected time range.
Click the bubble to view the selected user details. You can view critical information such as the total number of events, the bandwidth consumed, and the top five applications accessed by the user. Click View All Applications to navigate to the Application Insights page.
| What You Can Do | How |
|---|---|
| View users based on volume or sessions | Select from the following options to view the user data:
|
| View user data for a time range | Click the calendar ( The maximum time range is 14 days. |
| Filter user data | To view specific data, filter based on devices, device groups, or zones. To save filters:
To view data instantly based on devices and device groups or zones, select the values on the Filter page and click Apply. The data is refreshed on the bubble chart and the grid. Click Reset to clear the fields on the Filters page. |
| Reset all user filter | Click the Reset all filters ( |
You can also view data in a sortable grid format, which allows easy comparison across columns. You can sort users in an ascending or descending order based on the username, rules, volume, total sessions, total rejects, applications, URL filtering, content filtering, anti-malware, SecIntel, DNS Security, IDP and screens.
If the data presented on the bubble chart is not visible within the grid, sort the grid by the appropriate column or use the search functionality to efficiently filter and retrieve the required information.
| Field | Description |
|---|---|
| Username | The name of the user or source IP address accessing the application. |
| Rules | The number of rules across devices where the user is
configured. Click the Rules link to view the list of policies. |
| Volume | The bandwidth consumed by the user. |
| Total Sessions | The total number of sessions generated by devices for the given
user. Click the link in the Total Sessions column to navigate to the Sessions page for detailed logs. Click OK. |
| Total Rejects | The total number of deny and reject events for the user across all threats and sessions. |
| Applications | The number of applications accessed by a specific user. Click the link in the Application column to navigate to the Application Insights page. |
| URL Filtering | The number of URL categories accessed by a specific user. Click the link in the URL Filtering column to navigate to the URL Filtering Insights page. |
| Content Filtering | The number of content filters accessed by a specific
user. Click the link in the Content Filtering column to navigate to the Content Filtering Insights page. |
| Anti-Malware | The number of anti-malwares accessed by the user. Click the link in the Anti-Malware column to navigate to the Anti-Malware Insights page. |
| SecIntel | The number of SecIntel categories accessed by the user. Click the link in the SecIntel column to navigate to the SecIntel Insights page. |
| DNS Security | The number of DNS Security categories accessed by the
user. Click the link in the DNS Security column to navigate to the DNS Security Insights page. |
| IDP | The number of IDP services accessed by the user. Click the link in the IDP column to navigate to the IDP Insights page. |
Content Filtering Insights
Content filtering offers more than just blocking unwanted websites—it provides deep visibility and actionable insights into how users interact with digital content across a network.
To access this page, click and then from the Insights drop-down list, select Content Filtering.
Top Content Filter Details
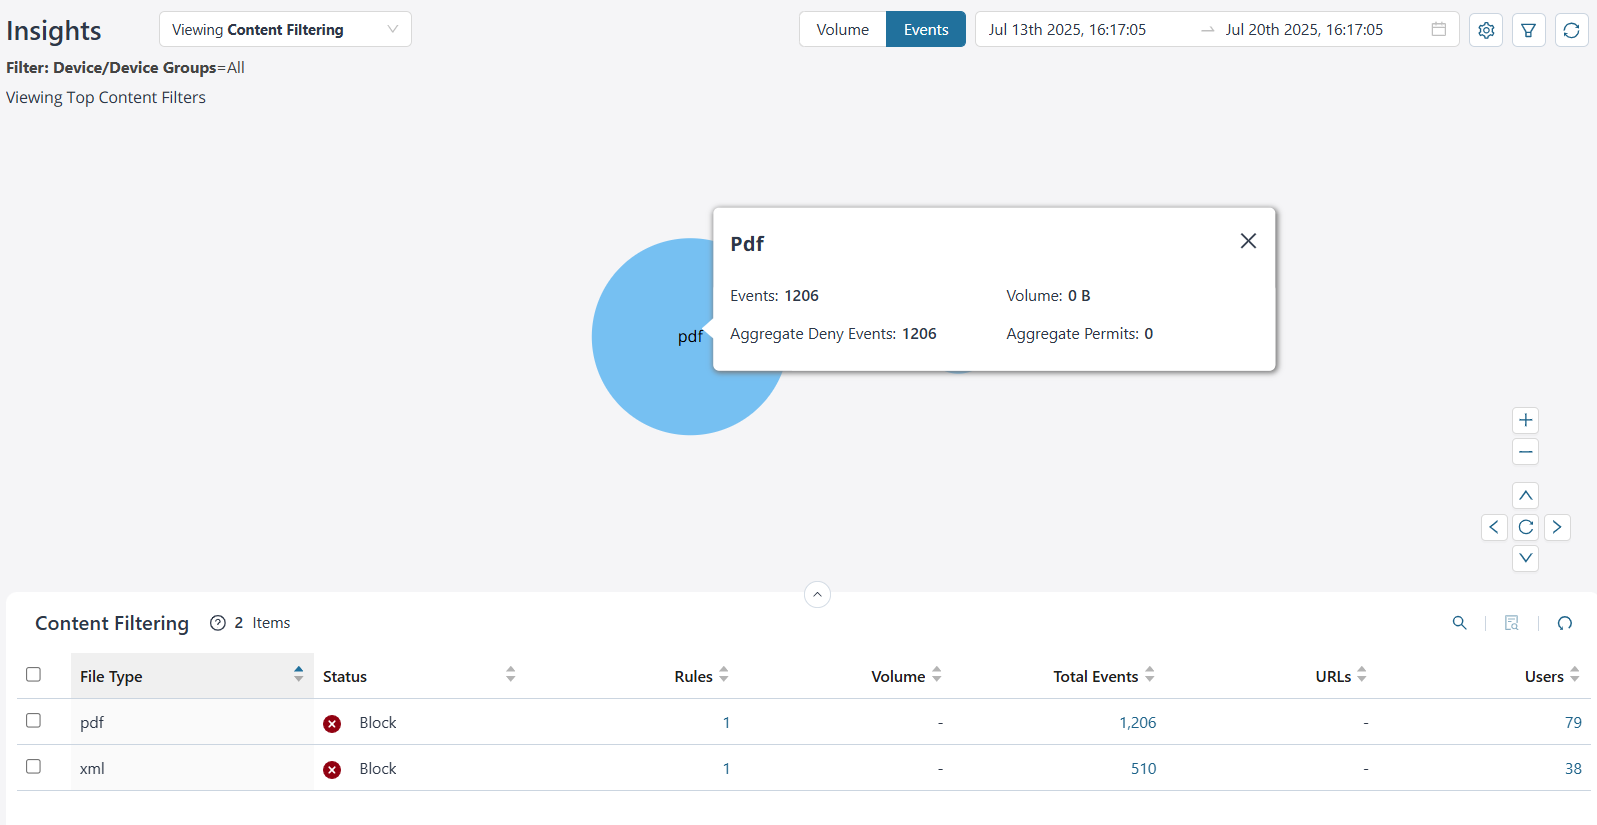
By default, you can view the top content filter data for all devices and device groups based on the volume. The data is presented graphically as a zoomable bubble graph. Bubble sizes vary depending on the selected metric—either volume or events count. The data is refreshed automatically based on the selected time range.
Click the bubble to view the selected content filter file type details. You can view the total number of events generated for a file type, the bandwidth consumed, the aggregate denied and permitted events for a file type.
| What You Can Do | How |
|---|---|
| View content filter insights based on volume or events | Select from the following options to view the content filter
data:
|
| View content filter data for a time range | Click the calendar ( The maximum time range is 14 days. |
| View content filter insights based on your settings |
|
| Filter data for content filter | To view specific data, filter based on devices, device groups, or zones. To save filters:
To view data instantly based on devices, device groups or zones, select the values on the Filter page and click Apply. The data is refreshed on the bubble chart. Click Reset to clear the fields on the Filters page. |
| Reset all filter for content filter | Click the Reset all filters ( |
You can also view data in a sortable grid format, which allows easy comparison across columns. You can sort the content filtering data in an ascending or descending order based on file type, status, rules, volume, total events, URLs, and users.
If the data presented on the bubble chart is not visible within the grid, sort the grid by the appropriate column or use the search functionality to efficiently filter and retrieve the required information.
| Field | Description |
|---|---|
| File Type | The content filter file type. For example, PDF, XML. |
| Status | The status of the configured content filter—All, Block, Close Client, Close Client Server, Close Server, No Action. |
| Rules | The number of rules across devices where content filtering file
type is configured. Click the link in the Rules column to view the list of profile names. |
| Volume | The bandwidth consumed by the content filter file type. |
| Total Events | The total number of events generated by devices. Click the link in the Total Events column to navigate to the All Security Events page for detailed logs. Click OK. |
| URLs | The total number of URLs for specific file type. Click the link in the URLs column to view the list of URLs. |
| Users | The total number of users accessing the specific file
type. Click the link in the Users column to navigate to the User Insights page. |
Anti-Malware Insights
Anti-malware offers malware detection, prevention, and remediation. Effective network monitoring integrates anti-malware insights to detect, analyze, and respond to malicious behavior in real-time.
To access this page, click and then from the Insights drop-down list, select Anti-Malware.
Top Anti-Malware Details
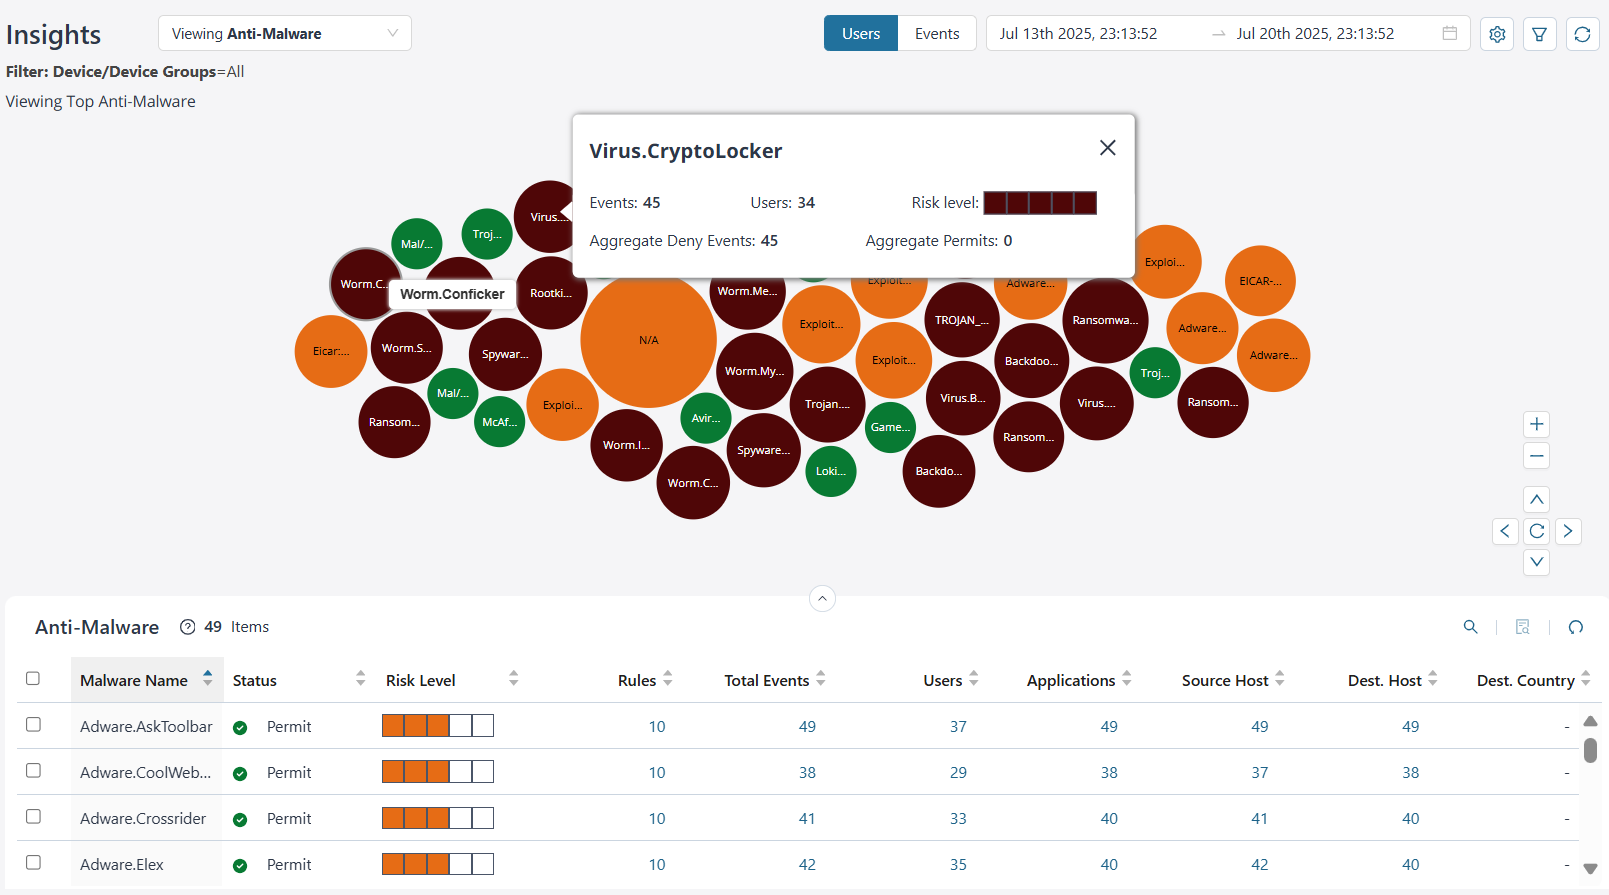
By default, you can view the top anti-malware, the anti-virus, and the ATP file scan data for all devices and device groups based on the users. The data is presented graphically as a zoomable bubble graph. Bubble sizes vary depending on the selected metric—either users or events count. The data is refreshed automatically based on the selected time range.
Click the bubble to view the selected malware details. You can view the total events generated by devices, the total users impacted by the malware, the risk associated, the number of malwares denied, or permitted.
| What You Can Do | How |
|---|---|
| View anti-malware data based on users or events | Select from the following options to view anti-malware data:
|
| View anti-malware data for a time range | Click the calendar ( The maximum time range is 14 days. |
| View anti-malware insights based on your settings |
|
| Filter anti-malware data | To view specific data, filter based on devices, device groups, or zones. To save filters:
To view data instantly based on devices, device groups, or zones, select the values on the Filter page and click Apply. The data is refreshed on the bubble chart and the grid. Click Reset to clear the fields on the Filters page. |
| Reset all filter | Click the Reset all filters ( |
You can also view data in a sortable grid format, which allows easy comparison across columns. You can sort the anti-malware data in an ascending or descending order based on malware name, status, risk level, rules, total events, users, source host, destination host, and destination country.
If the data presented on the bubble chart is not visible within the grid, sort the grid by the appropriate column or use the search functionality to efficiently filter and retrieve the required information.
| Field | Description |
|---|---|
| Malware Name | The name of the malware. |
| Status | The status of the malware—All, Block, Deny, Permit, Unknown |
| Risk Level | The risk associated with the malware—Critical, High, Moderate,
Low, and None. The risk levels are indicated by color codes.
|
| Rules | The number of rules across devices where the malware is
configured. Click the link in the Rules column to view the list of rules. |
| Total Events | The total number of malware events generated by the
devices. Click the Total Events link to navigate to the All Security Events page with the filter applied for detailed logs. Click OK. |
| Users | The total number of users who triggered the anti-malware
event. Click the link in the Users column to navigate to the Users Insights page. |
| Applications | The number of HTTP files scanned for the configured
period. Click the link in the Applications column to navigate to the Application Insights page. |
| Source Host | The source host IP addresses where the malware
originated. Click the link in the Source Host column to view the list of source host IP addresses. |
| Destination Host | The destination host IP addresses where the malware is
destined. Click the link in the Destination Host column to view the list of destination host IP addresses. |
| Destination Country | The country where malware is destined. Click the link in the Destination Country column to view the list of destination countries. |
SecIntel Insights
In a threat environment marked by constant evolution, integrating SecIntel into network monitoring elevates both visibility and responsiveness. SecIntel provides enriched context about adversary tactics, techniques, and infrastructure—transforming raw data into actionable intelligence. SecIntel leverages global threat feeds to enhance contextual visibility.
To access this page, click and then from the Insights drop-down list, select SecIntel.
Top SecIntel Details
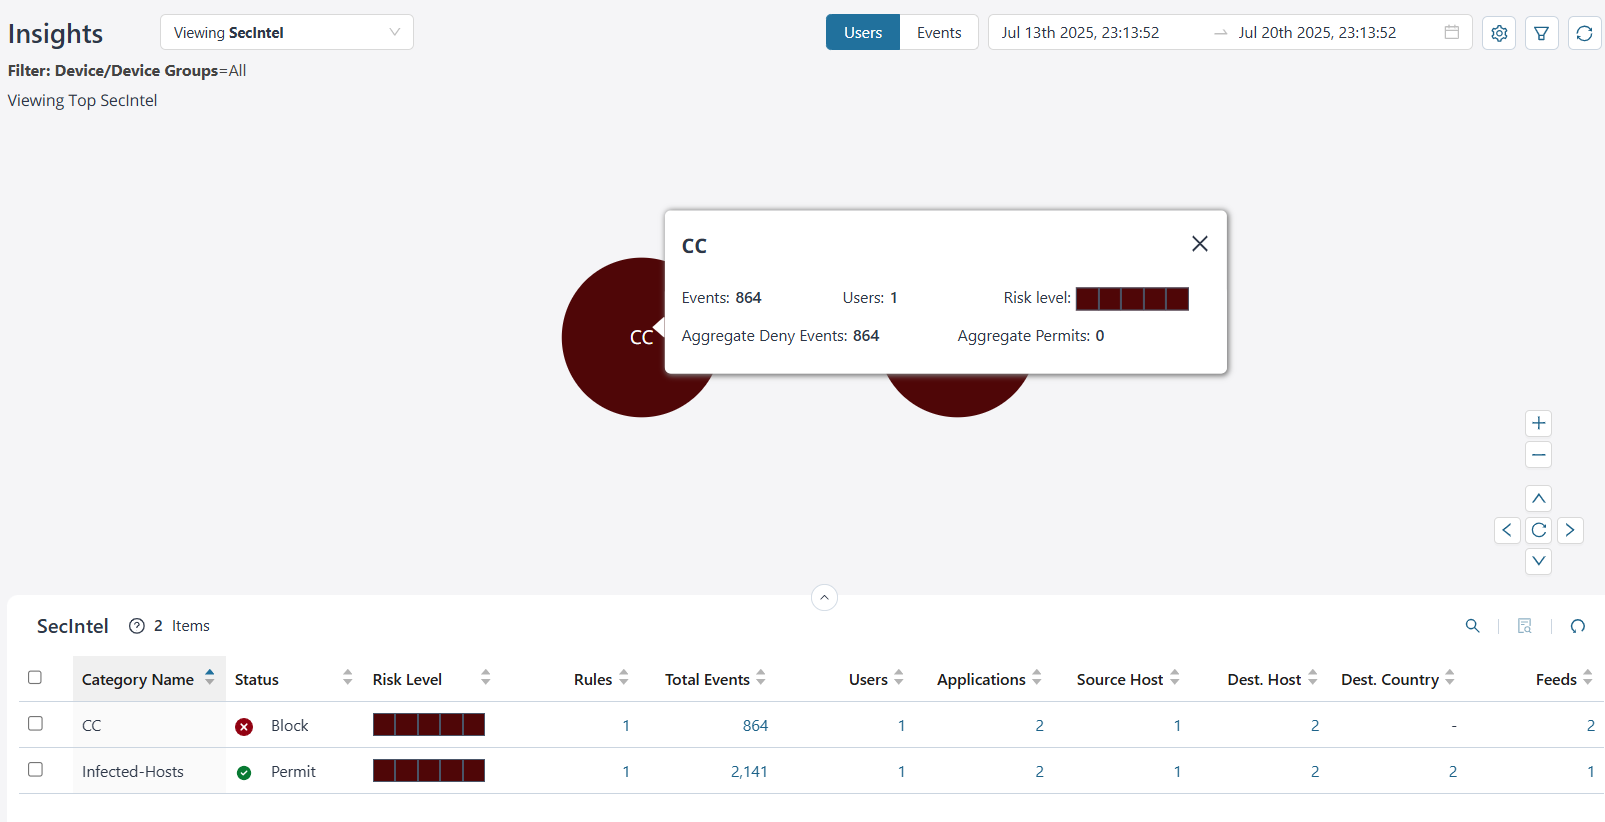
By default, you can view the top SecIntel data for all devices and device groups for each user. The data is presented graphically as a zoomable bubble graph. Bubble sizes vary depending on the selected metric—either users or event count. The data is refreshed automatically based on the selected time range.
Click the bubble to view the number of events generated for the SecIntel category, the numbers of users impacted, the associated risk, the number of events denied, and the number of events permitted.
| What You Can Do | How |
|---|---|
| View SecIntel data based on users or events | Select from the following options to view the SecIntel data:
|
| View SecIntel data for a time range | Click the calendar ( The maximum time range is 14 days. |
| View SecIntel insights based on your settings |
|
| Filter SecIntel data | To view specific data, filter based on devices, device groups, or zones. To save filters:
To view data instantly based on devices, device groups or zones, select the values on the Filter page and click Apply. The data is refreshed on the bubble chart and the grid. Click Reset to clear the fields on the Filters page. |
| Reset all SecIntel filter | Click the Reset all filters ( |
You can also view data in a sortable grid format, which allows easy comparison across columns. You can sort the SecIntel data in an ascending or descending order based on the category name, status, risk level, rules, total events, users, source host, destination host, and destination country.
If the data presented on the bubble chart is not visible within the grid, sort the grid by the appropriate column or use the search functionality to efficiently filter and retrieve the required information.
| Field | Description |
|---|---|
| Category Name | The SecIntel category name. For example, Block-list. |
| Status | The status of the SecIntel category—All, Permit |
| Risk Level | The risk associated with the SecIntel category—Critical, High,
Moderate, Low, and None. The risk levels are indicated by color
codes.
|
| Rules | The number of rules across devices where the SecIntel category is
configured. Click the link in the Rules column to view the list of rules. |
| Total Events | The total number of events generated by devices for the SecIntel
category. Click the link in the Total Events page to navigate to the All Security Events page for detailed logs. Click OK. |
| Users | The number of users impacted by the SecIntel category. Click the link in the Users column to navigate to the Users Insights page. |
| Applications | Indicates application, for example, DHCP. Click the link in the Application column to navigate to the Application Insights page. |
| Source Host | The number of source hosts where the SecIntel category
originated. Click the link in the Source Host column to view the number of source host IP addresses. |
| Destination Host | The number of destination hosts where the SecIntel category is
targeted. Click the link in the Destination Host column to view the list of destination host IP addresses. |
| Destination Country | The number of destination countries where the SecIntel category
is targeted. Click the link in the Destination Country column to view the destination country names. |
| Feeds | The unique identifier for a threat feed. The feed names are used
to organize and manage various threat intelligence sources. Click the link in the Feeds column to view the feeds. |
DNS Security Insights
DNS security insights play a vital role in modern network monitoring by enabling proactive analysis of DNS traffic. This visibility helps detect malicious domains, prevent data exfiltration, and uncover indicators of compromise in real time. By scrutinizing DNS query patterns and responses, you can identify anomalies, diagnose performance congestion, and strengthen the overall security posture of your infrastructure. Enhanced DNS visibility ensures greater reliability, responsiveness, and protection across network resources.
To access this page, click and then from the Insights drop-down list, select DNS Security.
View DNS Security Details
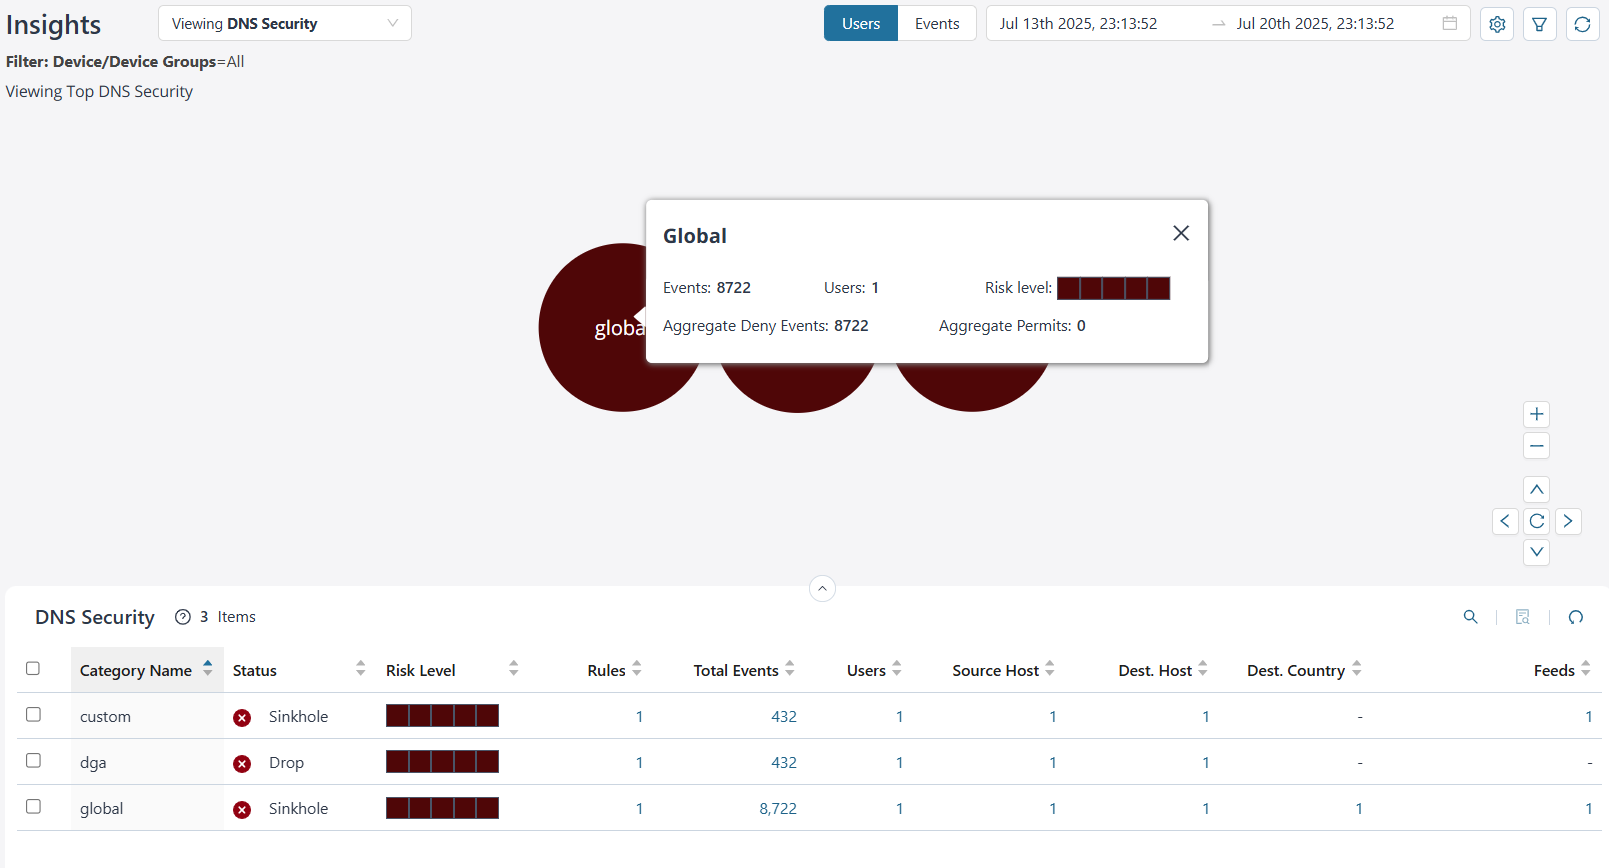
By default, you can view the top DNS Security data for all devices and device groups for each user. The data is presented graphically as a zoomable bubble graph. Bubble sizes vary depending on the selected metric—either users or events count. The data is refreshed automatically based on the selected time range.
Click the bubble to view the total number of events generated for the DNS Security, the total number of users using DNS Security category name, the risk associated, the total DNS security category events denied, and the total DNS security events permitted.
| What You Can Do | How |
|---|---|
| View DNS Security data based on users or events | Select from the following options to view the DNS Security
data:
|
| View DNS Security data for a time range | Click the calendar ( The maximum time range is 14 days. |
| View DNS Security insights based on your settings |
|
| Filter DNS Security data | To view specific data, filter based on devices, device groups, or zones. To save filters:
To view data instantly based on devices, device groups or zones, select the values on the Filter page and click Apply. The data is refreshed on the bubble chart and the grid. Click Reset to clear the fields on the Filters page. |
| Reset all DNS Security filter | Click the Reset all filters ( |
You can also view data in a sortable grid format, which allows easy comparison across columns. You can sort the DNS Security in an ascending or descending order based on category name, status, risk level, rules, total events, users, source host, destination host, and destination country.
If the data presented on the bubble chart is not visible within the grid, sort the grid by the appropriate column or use the search functionality to efficiently filter and retrieve the required information.
| Field | Description |
|---|---|
| Category Name | The name of the DNS category. |
| Status | The status of the DNS queries. |
| Risk Level | The risk associated with the DNS Security category—Critical,
High, Moderate, Low, and None. The risk levels are indicated by
color codes.
|
| Rules | The total number of rules configured for the DNS category across
all devices. Click the link in the Rules column to view the list of rules. |
| Total Events | The total number of events generated by devices for the DNS
Security category. Click the link in the Total Events column to navigate to the All Security Events page for detailed logs. Click OK. |
| Users | The total number of users querying the DNS security
category. Click the link in the Users column to navigate to the User Insights page. |
| Source Host | The source IP address from where the DNS security query was
initiated. Click the link in the Source Host column to view the list of source host IP addresses. |
| Destination Host | The destination IP address to which the DNS security query was
targeted. Click the link in the Destination Host column to view the list of destination host IP addresses. |
| Destination Country | The destination country to which the DNS security query was
targeted. Click the link in the Destination Country column to view the list of destination countries. |
| Feeds | Provides information about malicious or potentially dangerous
domain names. Click the link in the Feeds column to view the list of Feeds. |
IDP Insights
IDP enhances visibility by monitoring network traffic, analyzing user behavior, detecting anomalies and malicious activities. This visibility helps you identify vulnerabilities, respond to threats in real-time, and strengthen your overall security posture.
To access this page, click and then from the Insights drop-down list, select IDP.
View IDP Details
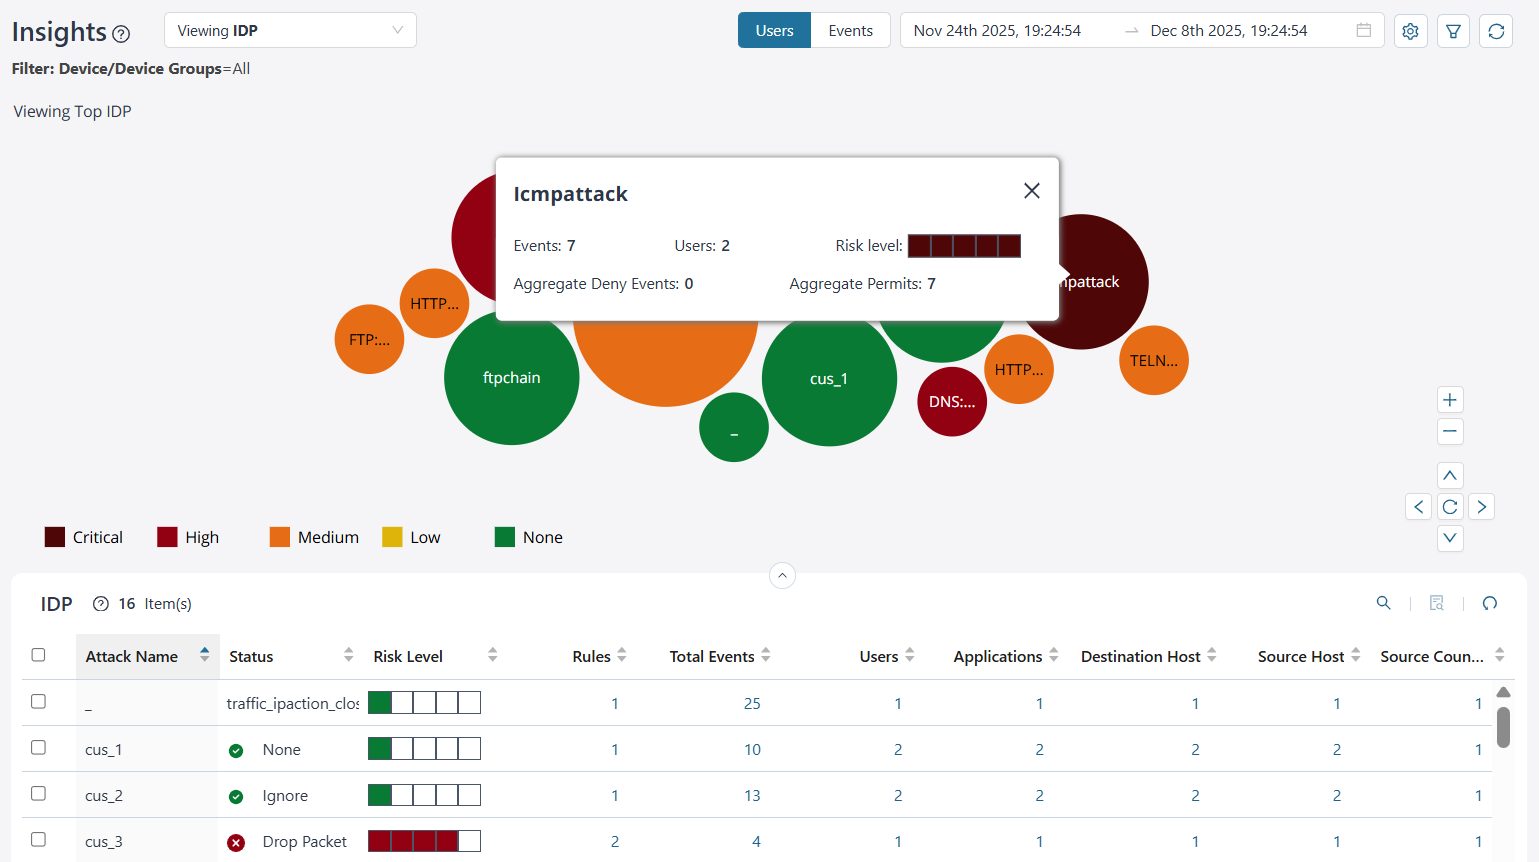
By default, you can view the top IDP attack data for all devices and device groups for each user. The data is presented graphically as a zoomable bubble graph. Bubble sizes vary depending on the selected metric—either users or event count. The data is refreshed automatically based on the selected time range.
Click the bubble to view the total number of events generated by devices for the IDP attack, the total number of users, the risk level of the attack, the aggregate events denied, and the aggregate events permitted.
| What You Can Do | How |
|---|---|
| View IDP data based on users or events | Select from the following options to view the IDP attack data:
|
| View IDP data for a time range | Click the calendar ( The maximum time range is 14 days. |
| View IDP insights based on your settings |
|
| Filter IDP data | To view specific data, filter based on devices, device groups, or zones. To save filters:
To view data instantly based on devices, device groups or zones, select the values on the Filter page and click Apply. The data is refreshed on the bubble chart and the grid. Click Reset to clear the fields on the Filters page. |
| Reset all IDP filter | Click the Reset all filters ( |
You can also view data in a sortable grid format, which allows easy comparison across columns. You can sort the IDP data in an ascending or descending order based on attack name, status, risk level, rules, total events, users, applications, destination host, source host, and source country.
If the data shown in the bubble chart is not visible in the grid, sort the grid by the relevant column or use the search function to quickly filter and locate the required information.
| Field | Description |
|---|---|
| Attack Name | The name of the IDP attack. |
| Status | Indicates the action taken in response to an IDP attack, as recorded in the syslog. For example, DROP_PACKET, LOG, CLOSE_CLIENT. |
| Risk Level | The risk associated with the attack—Critical, High, Moderate,
Low, and None. The risk levels are indicated by color codes.
|
| Rules | The number of rules configured for the attack name across
devices. Click the link in the Rules column to view the rules. |
| Total Events | Indicates the total number of syslog events captured when an
attack is detected across devices. Click the link in the Total Events column to navigate to the All Security Events page for detailed logs. |
| Users | The number of users impacted by the attack. Click the link in the Users column to navigate to the User Insights page. |
| Applications | Indicates applications, such as HTTP and HTTPs. Click the link in the Applications column to view the application names. |
| Destination Host | The destination IP address to which the attack was
destined. Click the link in the Destination Host column to view the list of destination host IP addresses. |
| Source Host | The source IP address from where the attack originated. Click the link in the Source Host column to view the list of source host IP addresses. |
| Source Country | Shows the country of origin for the attack, as determined by
Geo-IP lookup. The source IP is mapped using IANA IP allocation data
to identify its geographical location. Click the link in the Source Country column to view the source countries. |
Screens Insights
Screens allow you to view real-time network traffic, identify performance congestion, and detect security threats.
To access this page, click and then from the Insights drop-down list, select Screens.
View Screens Details
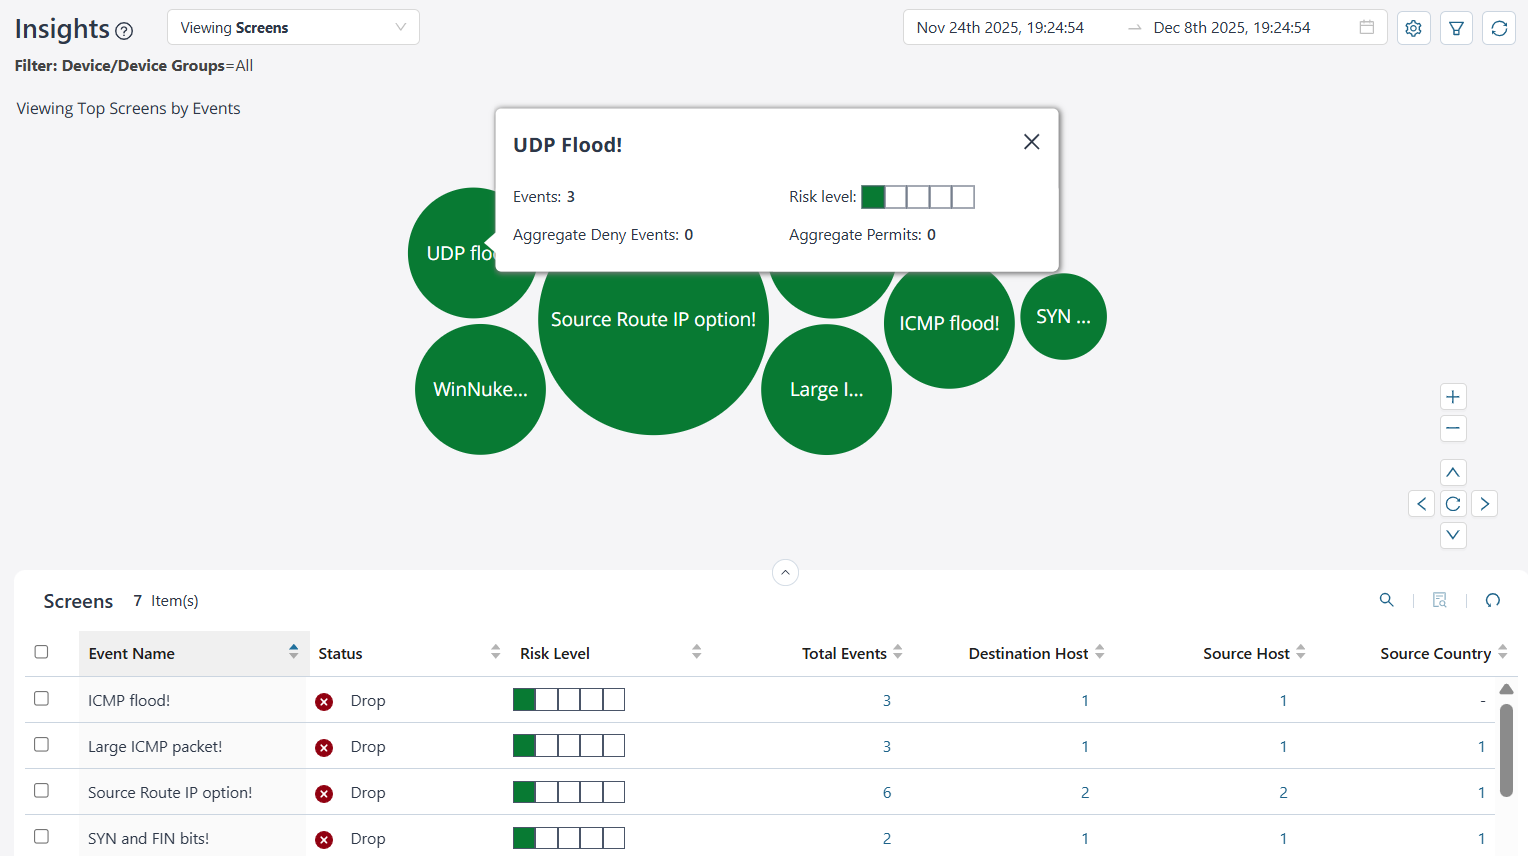
By default, you can view the top Screens data for all devices and device groups based on the number of events. The data is presented graphically as a zoomable bubble graph. Bubble sizes is based on event count. The data is refreshed automatically based on the selected time range.
Click the bubble to view the total number of events generated by devices for the Screens event, the risk level of the attack, the aggregate events denied, and the aggregate events permitted.
| What You Can Do | How |
|---|---|
| View Screens data based on event count | By default, the bubble chart displays data based on the number of events generated by devices and device groups. |
| View Screens data for a time range | Click the calendar ( The maximum time range is 14 days. |
| View Screens insights based on your settings |
|
| Filter Screens data | To view specific data, filter based on devices, device groups, or zones. To save filters:
To view data instantly based on devices, device groups or zones, select the values on the Filter page and click Apply. The data is refreshed on the bubble chart and the grid. Click Reset to clear the fields on the Filters page. |
| Reset all Screens filter | Click the Reset all filters ( |
You can also view data in a sortable grid format, which allows easy comparison across columns. You can sort the Screens data in an ascending or descending order based on the event name, status, risk level, total events, destination host, source host, and source country.
If the data shown in the bubble chart is not visible in the grid, sort the grid by the relevant column or use the search function to quickly filter and locate the required information.
| Field | Description |
|---|---|
| Event Name | The name of the Screens event. |
| Status | Indicates the action taken in response to a Screen event, as recorded in the syslog. For example, DROP_PACKET, LOG, CLOSE_CLIENT. |
| Risk Level | The risk associated with the event—Critical, High, Moderate, Low,
and None. The risk levels are indicated by color codes.
|
| Total Events | Indicates the total number of syslog events captured across
devices. Click the link in the Total Events column to navigate to the All Security Events page for detailed logs. |
| Destination Host | The destination IP address to which the event was
destined. Click the link in the Destination Host column to view the list of destination host IP addresses. |
| Source Host | The source IP address from where the event originated. Click the link in the Source Host column to view the list of source host IP addresses. |
| Source Country | Shows the country of origin for the event, as determined by
Geo-IP lookup. The source IP is mapped using IANA IP allocation data
to identify its geographical location. Click the link in the Source Country column to view the source countries. |