Equipment View
The Equipment View window provides detailed information on the chassis, cards, ports, and interfaces on any given router. It can be accessed by right clicking on a node in the Map window and selecting View > Equipment View. There are two types of views in Equipment View, accessible by clicking on the appropriate tabs at the top of the window: Logical View and Tabular View.
Logical View
Logical View provides a schematic representation of the hardware at the node. Empty, occupied, and designated template slots are distinguished by different colors which can be customized as described later in this chapter.
Connected and disconnected ports are distinguished by the symbols next to the port name. Connected ports have a colored bar in the circle, whose color can be customized in the Options window. A port is considered connected here if there is a link in the bblink file associated with this port (Network > Elements > Links). Left clicking on a port will popup a translucent window showing detailed information about the port.
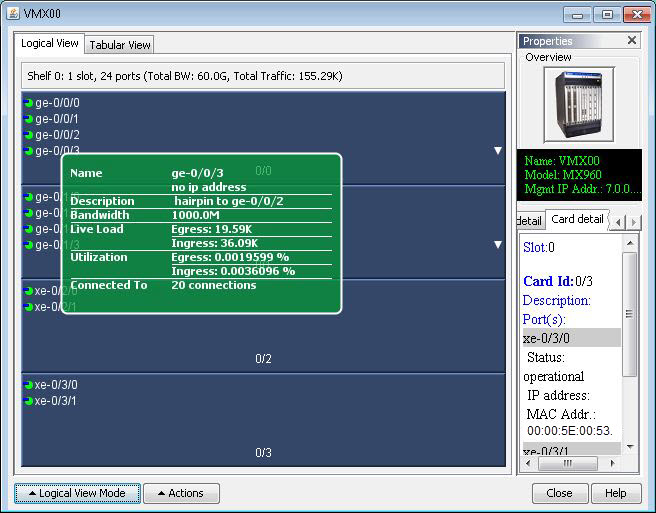
Additional detailed port information can be displayed by right clicking on the port and selecting an option from the table below. The available options may vary depending on the network model:
Field |
Description |
|---|---|
Show Demand |
Selecting this will open the Demands window to display all demands going through the port. |
Show Link |
Selecting this will open the Links window to display all links connected to the port. |
Show Demands in Card |
Selecting this will open the Demands window to display all demands going through the card. |
Show Links in Card |
Selecting this will open the Links window to display all links connected to the card. |
Card Connections View |
This displays ca view of the card along with all the links attached to the card and the nodes on the other end of those links. |
Display Card Details |
This displays details about the card in the Properties pane to the right. |
Display Port Details |
This displays details about the port in the Properties pane to the right. |
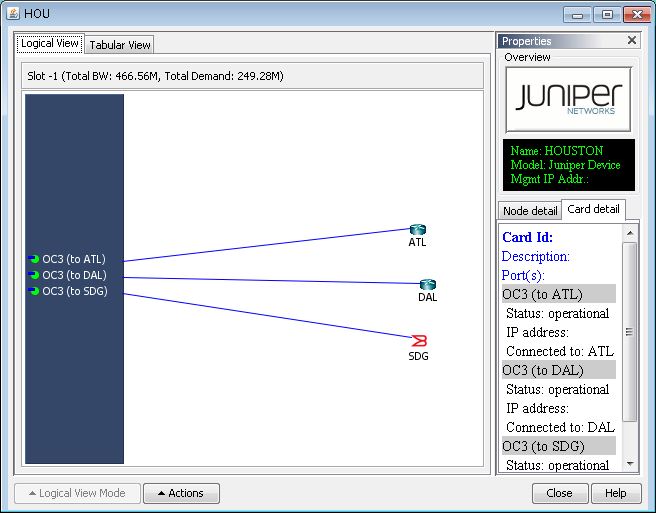
Logical View Mode Button
Clicking on the Logical View Mode button will open a menu through which you may customize the window.
Menu Item |
Description |
|---|---|
Show Color Legend |
This displays the color legend used for this window. |
Show Fullname |
This displays the full names of the ports in each slot |
Hide Metrics |
This causes only the port name to be displayed next to each port. |
Show Demand Egress, Ingress |
This causes the total egress and ingress demand bandwidth to be displayed next to each port. |
Show Utilizations |
This causes a horizontal bar graph representing total port utilization to be displayed next to each port. |
Show Empty Slots |
Selecting this displays all unused slots. De-selecting this will hide all unused slots. |
Show Pre-planned Slots |
If template slots have been defined, selecting this displays these slots. |
Slot Orientation |
This controls how slots or displayed. Vertical displays slots on top of each other, while Horizontal displays slots side by side. |
Slot Ordering |
This controls how slots are ordered. Ascending will order slots from lowest index to highest index, while Descending will order slots from highest index to lowest index. |
Logical Port Connections |
This displays VLANs that are connected to the card. |
Highlight VLAN ID |
This item is available only if there are VLANs connected to the card, and will highlight the VLANs if they exist. |
Highlight VRF Membership |
This item is available only if there are VRF Memberships defined on the card, and will highlight the relevant ports. |
Highlight VR Membership |
This item is available only if there are VR Memberships defined on the card, and will highlight the relevant ports. |
Tabular View
Tabular View can be accessed by clicking on the Tabular View tab at the top of the Equipment View window. This displays the Hardware Model information for the node in tabular form. The top pane of Tabular View displays a summary of interface types and bandwidth information. The bottom pane lists all ports and interfaces in a sortable table along with their attributes and related information.
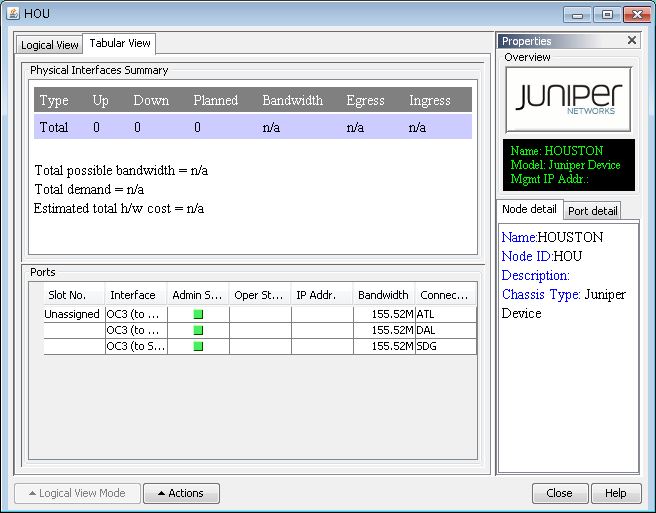
You can use the Actions button to bring up a menu through which various Hardware Model related actions can be carried out. These actions are useful when you are interested in viewing additional information about the particular node or modifying various properties on the node.
Menu Item |
Description |
|---|---|
Node Detail |
Opens up the standard Node window for the current node to display additional information. |
Highlight |
Highlights the node in the Map window. |
Show Config |
Open the config file for the current node in a text editor. |
Save As Template |
This allows you to save the Hardware Model for the current node as a Template in a client side xml file. This Template can later be imported and applied to additional nodes. |
Hardware Template |
Opens the Hardware Modeling Template window through which you may apply an existing template to the current node. |
Prints a report of the current hardware information. |
|
Report |
Saves a text report of the current Hardware Model information for the current node to the client. |
Refresh using SNMP |
Refreshes the Hardware Model information of the current node using SNMP data. You must be connected to the device and have the necessary login information to use this option. |
Refresh using CLI |
Refreshes the Hardware Model information of the current node using CLI data from Cisco and Juniper Networks hardware. You must be connected to the device and have the necessary login information to use this option. The commands issued during CLI refresh are as follows: Cisco hardware:
Juniper Networks hardware:
|
Hide Properties Pane |
Hides the Properties Pane normally displayed on the right side of the Equipment View window. |
Options |
Opens an Options window that allows you to set various options related to how Hardware Model information is visually presented in the Equipment View window. |
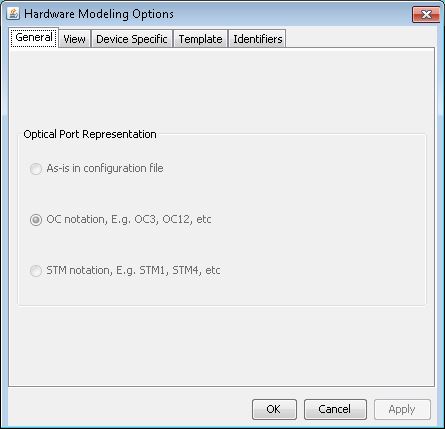
Various options related to how information is visually displayed in the Equipment View window can be customized in the Hardware Modeling Options window, accessible through the Actions button in the Equipment View window by selecting Options.
General Tab
In the General tab of the Hardware Modeling Options window, you may choose how optical ports are represented in the Equipment View by selecting an option in the Optical Port Representation field. In the bottom half of the window, you can customize what type of information is displayed in the bottom table of Tabular View.
View Tab
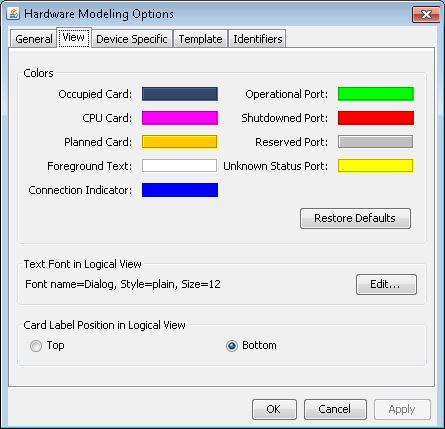
The View tab of the Hardware Modeling Options window allows you to customize various color, font and text position properties in Logical View. To change the color of a property, simply click on the color bar and a new window will pop up from which a new color for property can be chosen. The font used to display information in Logical View can also be changed here by clicking the Edit button. The position of the card label in Logical View can be customized to be shown either on the top or bottom of the card.
Device Specific Tab
Cisco IOS XR, Ignore preconfigured ports in Hardware Model: An interface that does not yet exist may be configured using the “interface preconfigure” command. Those interfaces are included by default with status “planned”. If this Ignore option is selected, those interfaces will not be displayed and the port counts may decrease as a result.
Template Tab
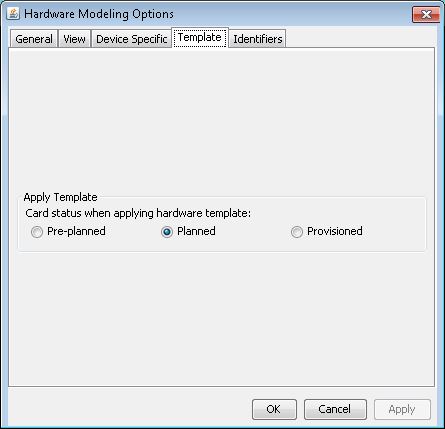
Apply Template: Here you can also specify the default state to be used when applying card templates.
Identifiers Tab
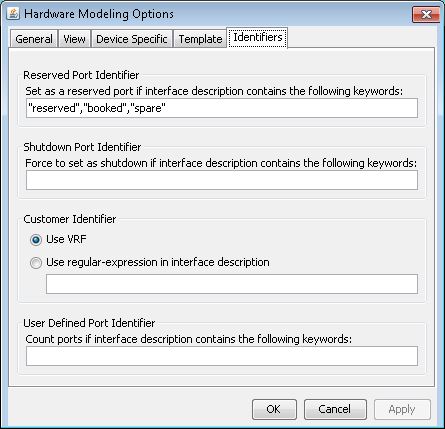
Reserved Port Identifier: For the Device Usage Report, if the interface description contains one of the strings in this comma separated list, that interface is interpreted as a reserved port. Note that the Reserved Ports column can be added to the report display by right-clicking the table header and selecting Table Options.
Reserved Port Identifier: For the Device Usage Report, if the interface description contains one of the strings in this comma separated list, that interface is interpreted as a reserved port. Note that the Reserved Ports column can be added to the report display by right-clicking the table header and selecting Table Options.
Customer Identifier: For the Customer Usage report, interfaces are associated with customers based on the interface description field. For example, to match a number sequence in interface comments of the format,
cust####...,use the expression, cust([0-9]+).*User Defined Port Identifier: Suppose you want to count the number of interfaces in a line card containing a particular keyword in its description. Add the desired strings in a comma-separated list, each surrounded by quotations marks, similar to the Reserved Port Identifier format. Select the Line Cards report, right-click the table header, and select Table Options to add a column for each keyword, to see the number of interfaces containing that keyword.
The Properties Pane
The Properties Pane is displayed on the right side of the Equipment View window and contains useful information about the card and ports in the chassis. It provides an overview of the hardware, node details, and card details. The Properties Pane can be closed by clicking the [x] button on the top right and shown through clicking the Actions button and selecting Show Properties Pane.
