Viewing Demands Through a Tunnel
To view all demands routed over a tunnel, right-click over the tunnel and select Show Demands Routed on Tunnel.
In the Demands window, examine the Current Route column which indicates the path taken bythe demands. Open and closed brackets in the path indicate where a tunnel is entered and exited.
Figure 1: Demands
(or Flows) Routed Through a Particular Tunnel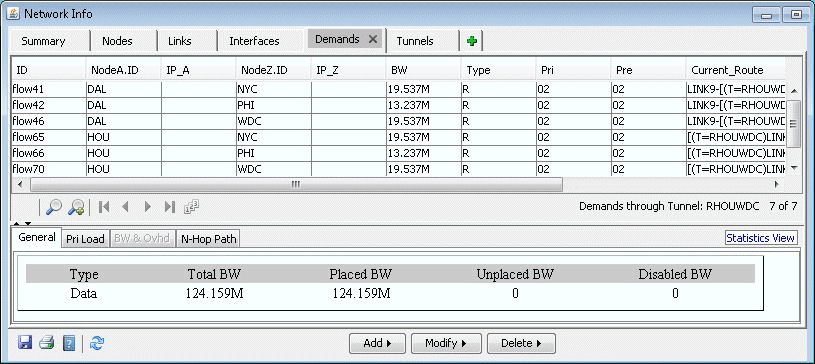
In Figure 1, the selected demand between HOU and NYC. has the route HOU[--DAL--CHI--]WDC--PHI--NYC, indicating that the demand traversed a tunnel from Houston (HOU) to Washington D.C. (WDC).
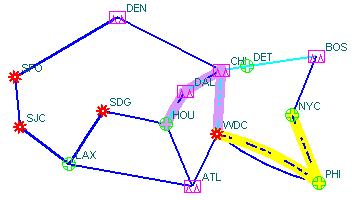
Clicking on “Show Path” displays the path of the demand on the map. Notice that a purple color is used to indicate the portion where the demand is travelling through a tunnel.
Figure 2: Path of Demand Through a Tunnel