Configure a Rule Using Flow Sensor
With the flow ingest settings complete, you can now create a rule using flow as the sensor.
This example rule includes three elements:
-
A flow sensor that uses the NetFlow v10 IPv4 template
-
Six fields capturing data of interest
-
A trigger that indicates when traffic flow is higher or lower than expected
See the usage notes at the end of this section for more detail on what has been configured.
-
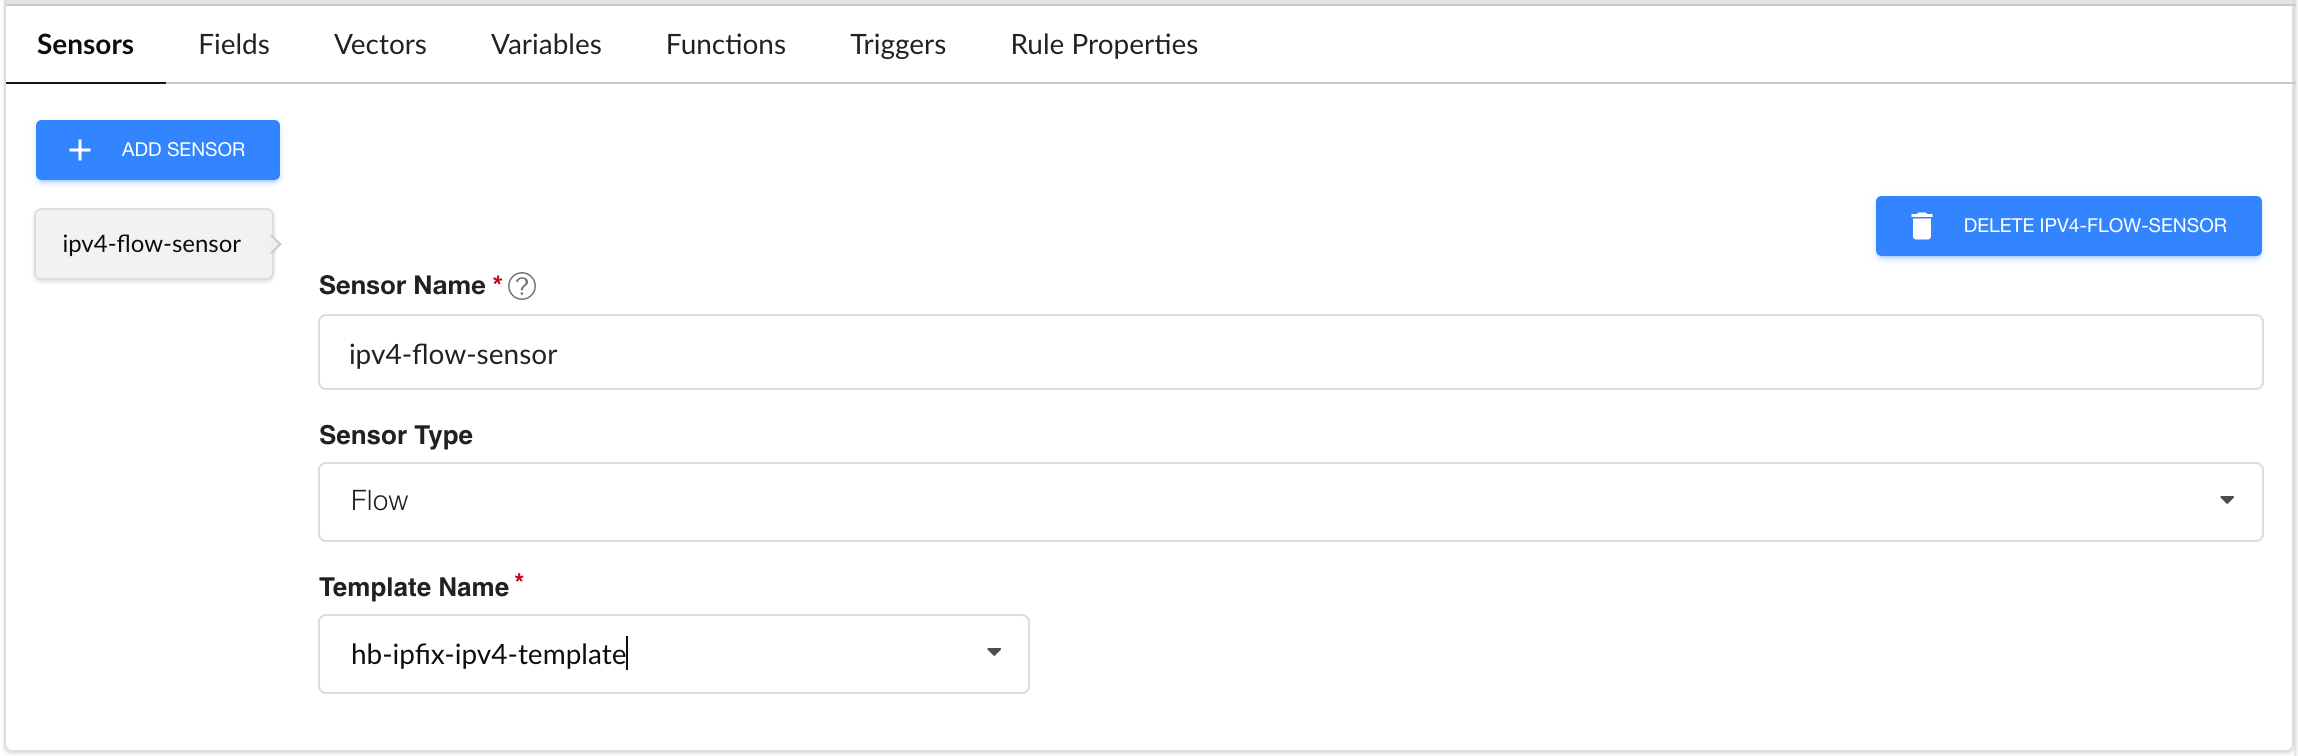
Click the + Add Sensor button and enter the
following parameters in the Sensors tab:
-
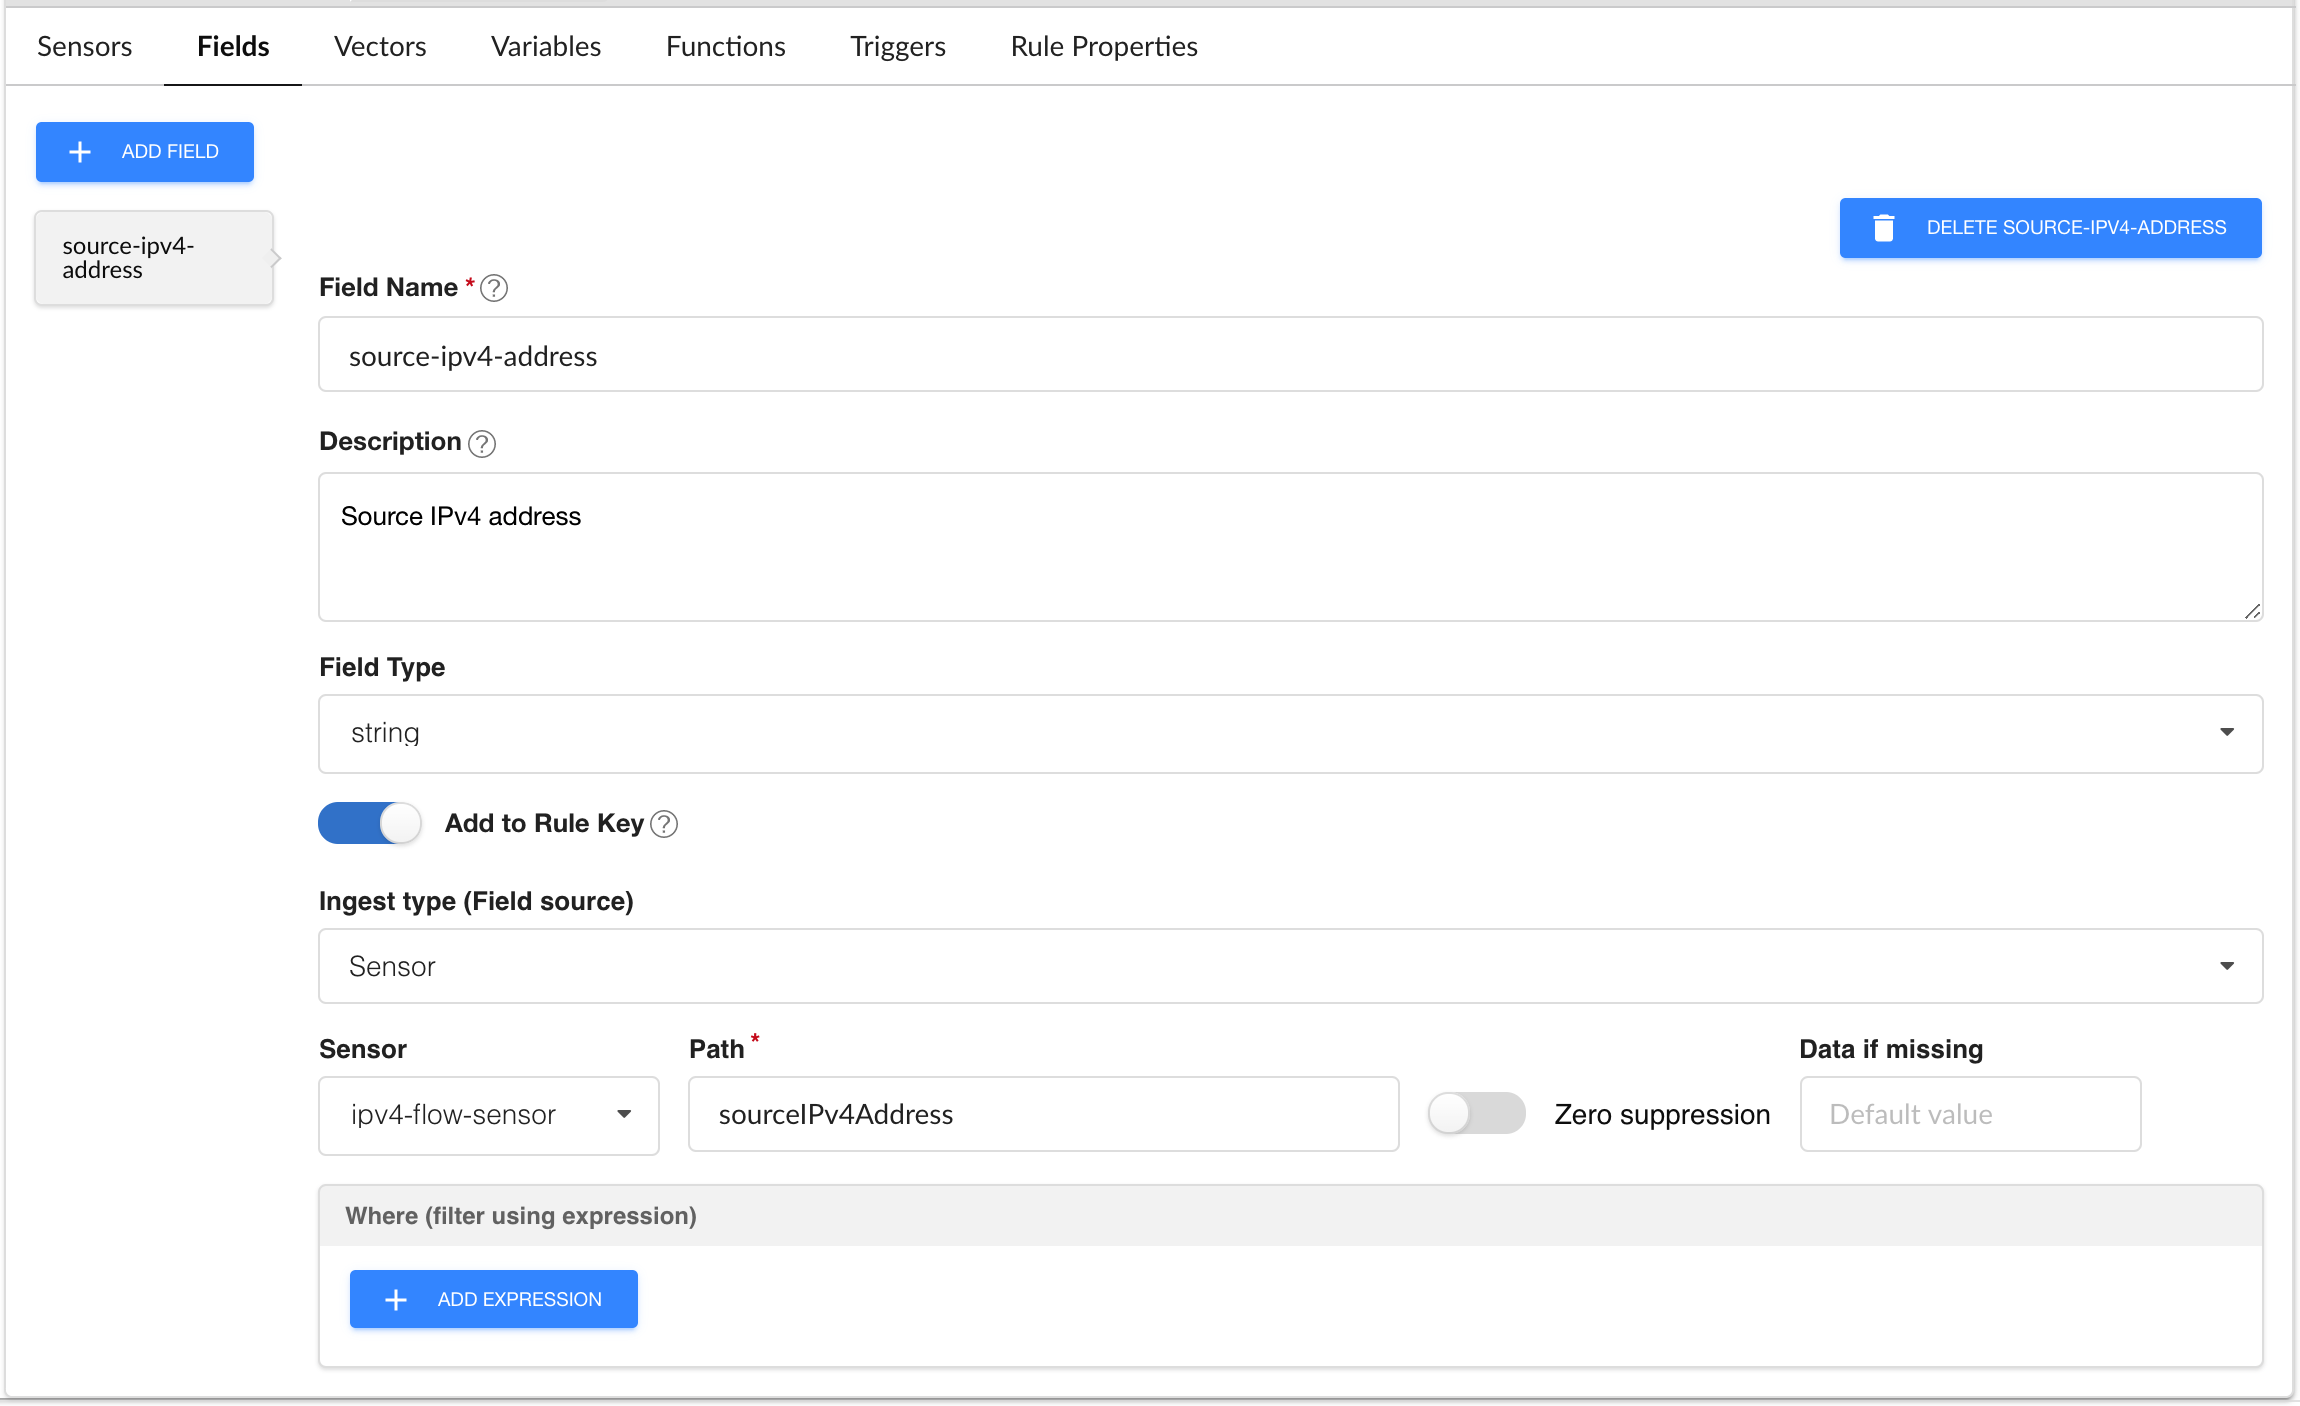
Now move to the Fields tab, click the + Add Field button and enter the following parameters to configure the first
field, source-ipv4-address:
-
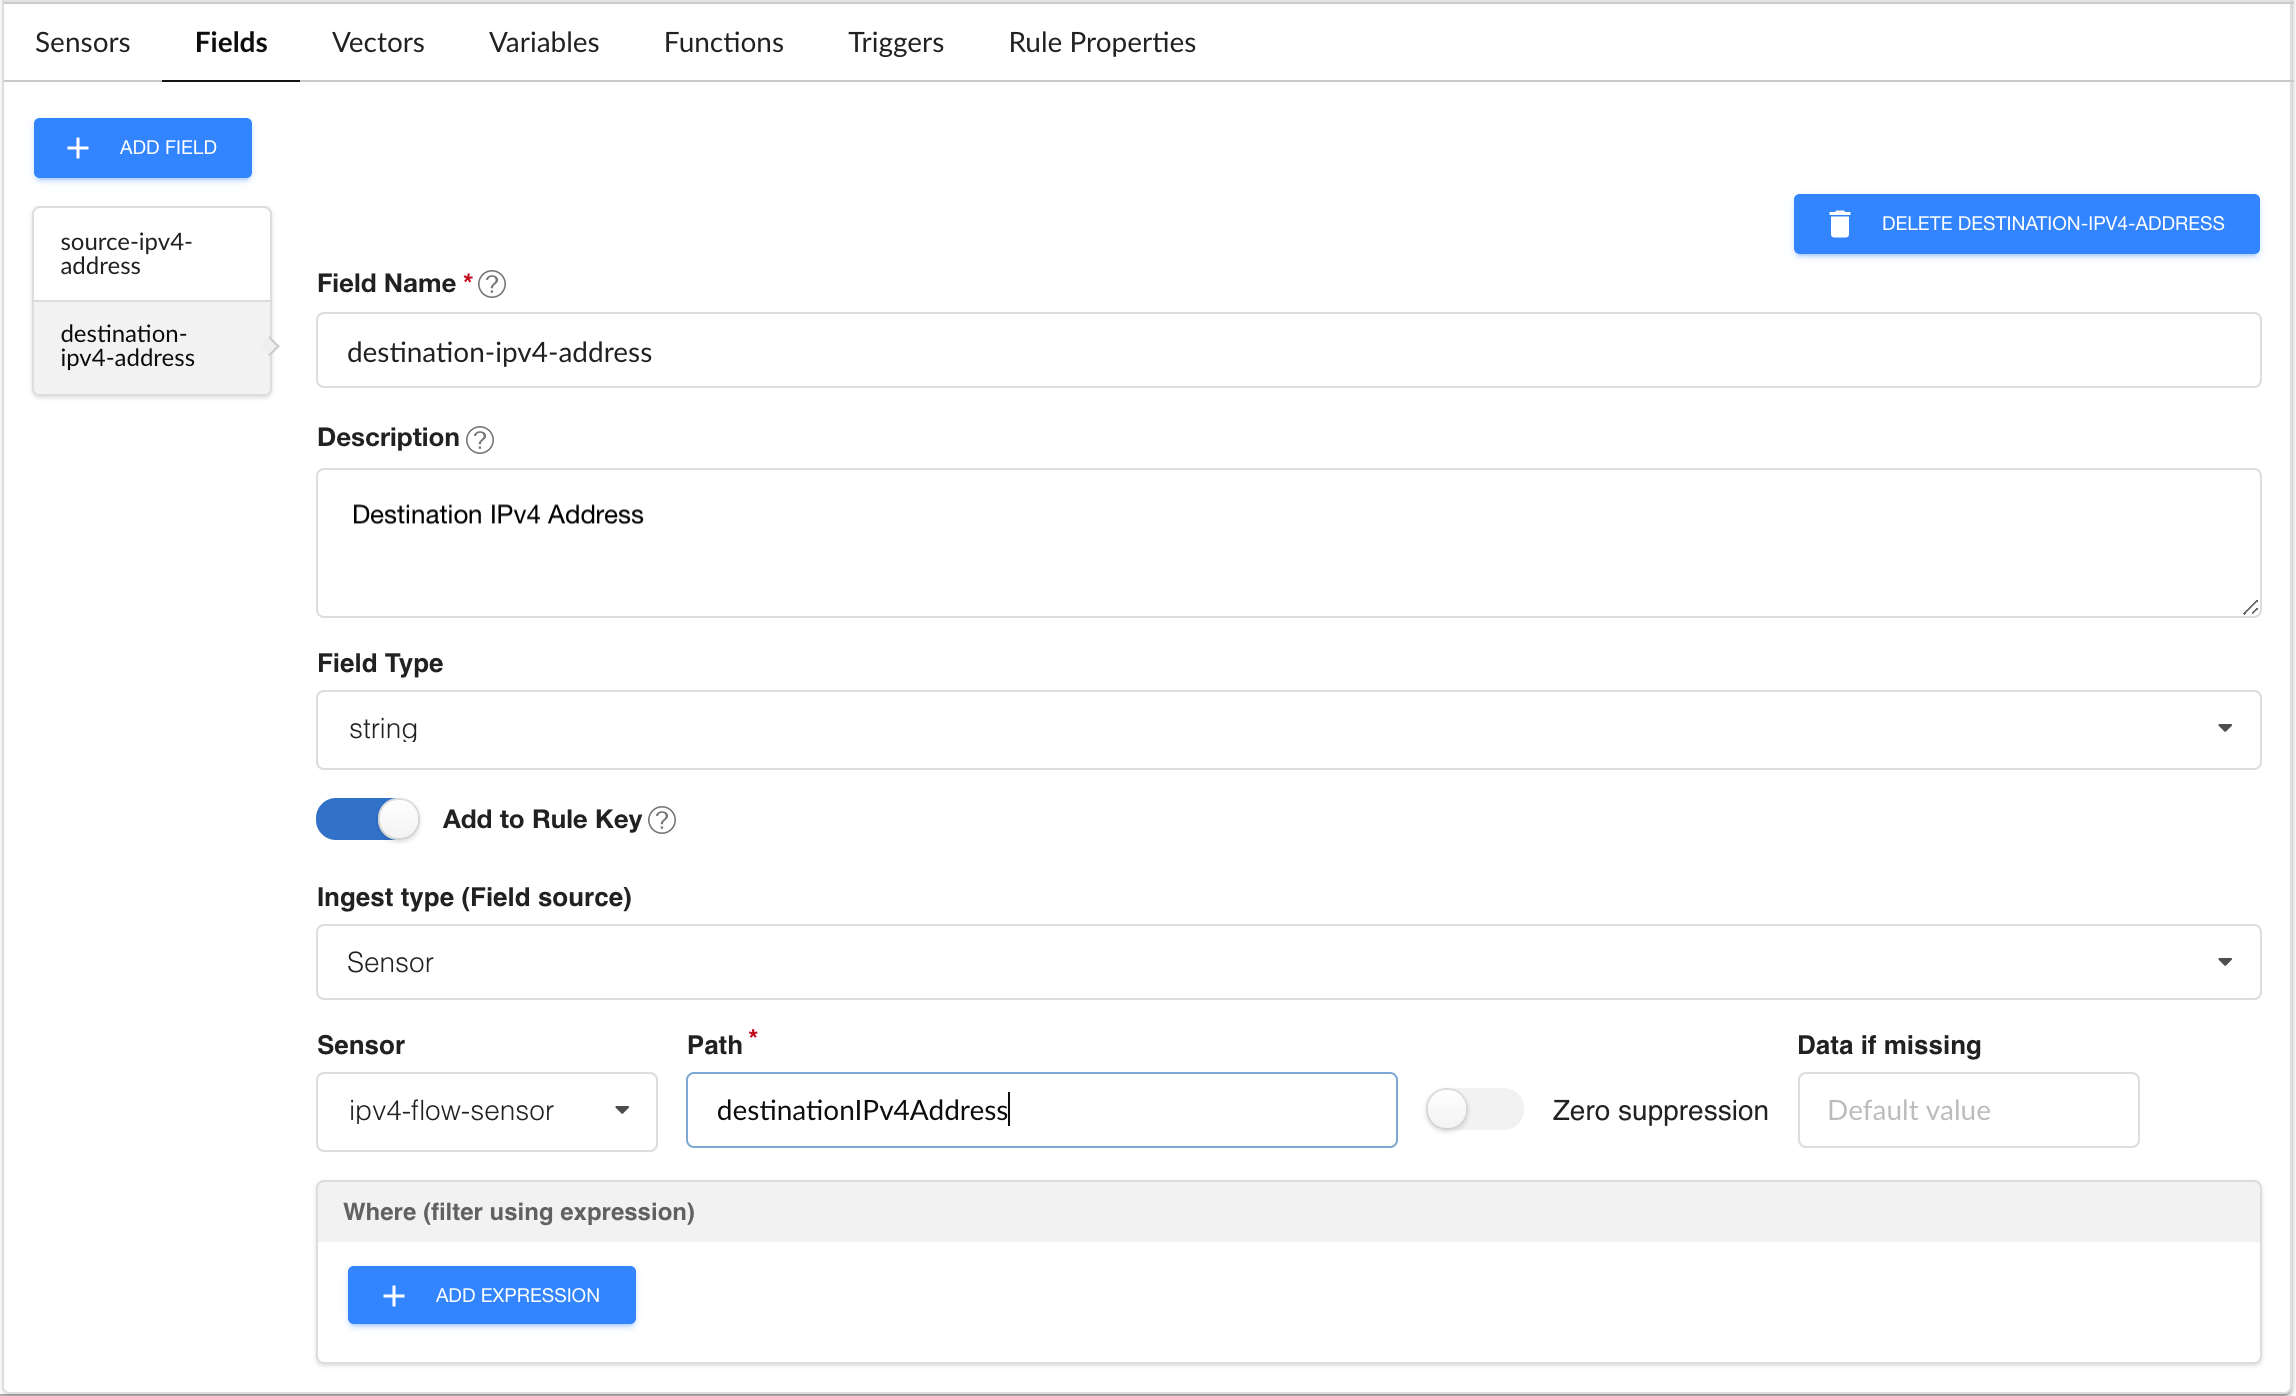
Click the + Add Field button again and enter
the following parameters to configure the second field, destination-ipv4-address:
-
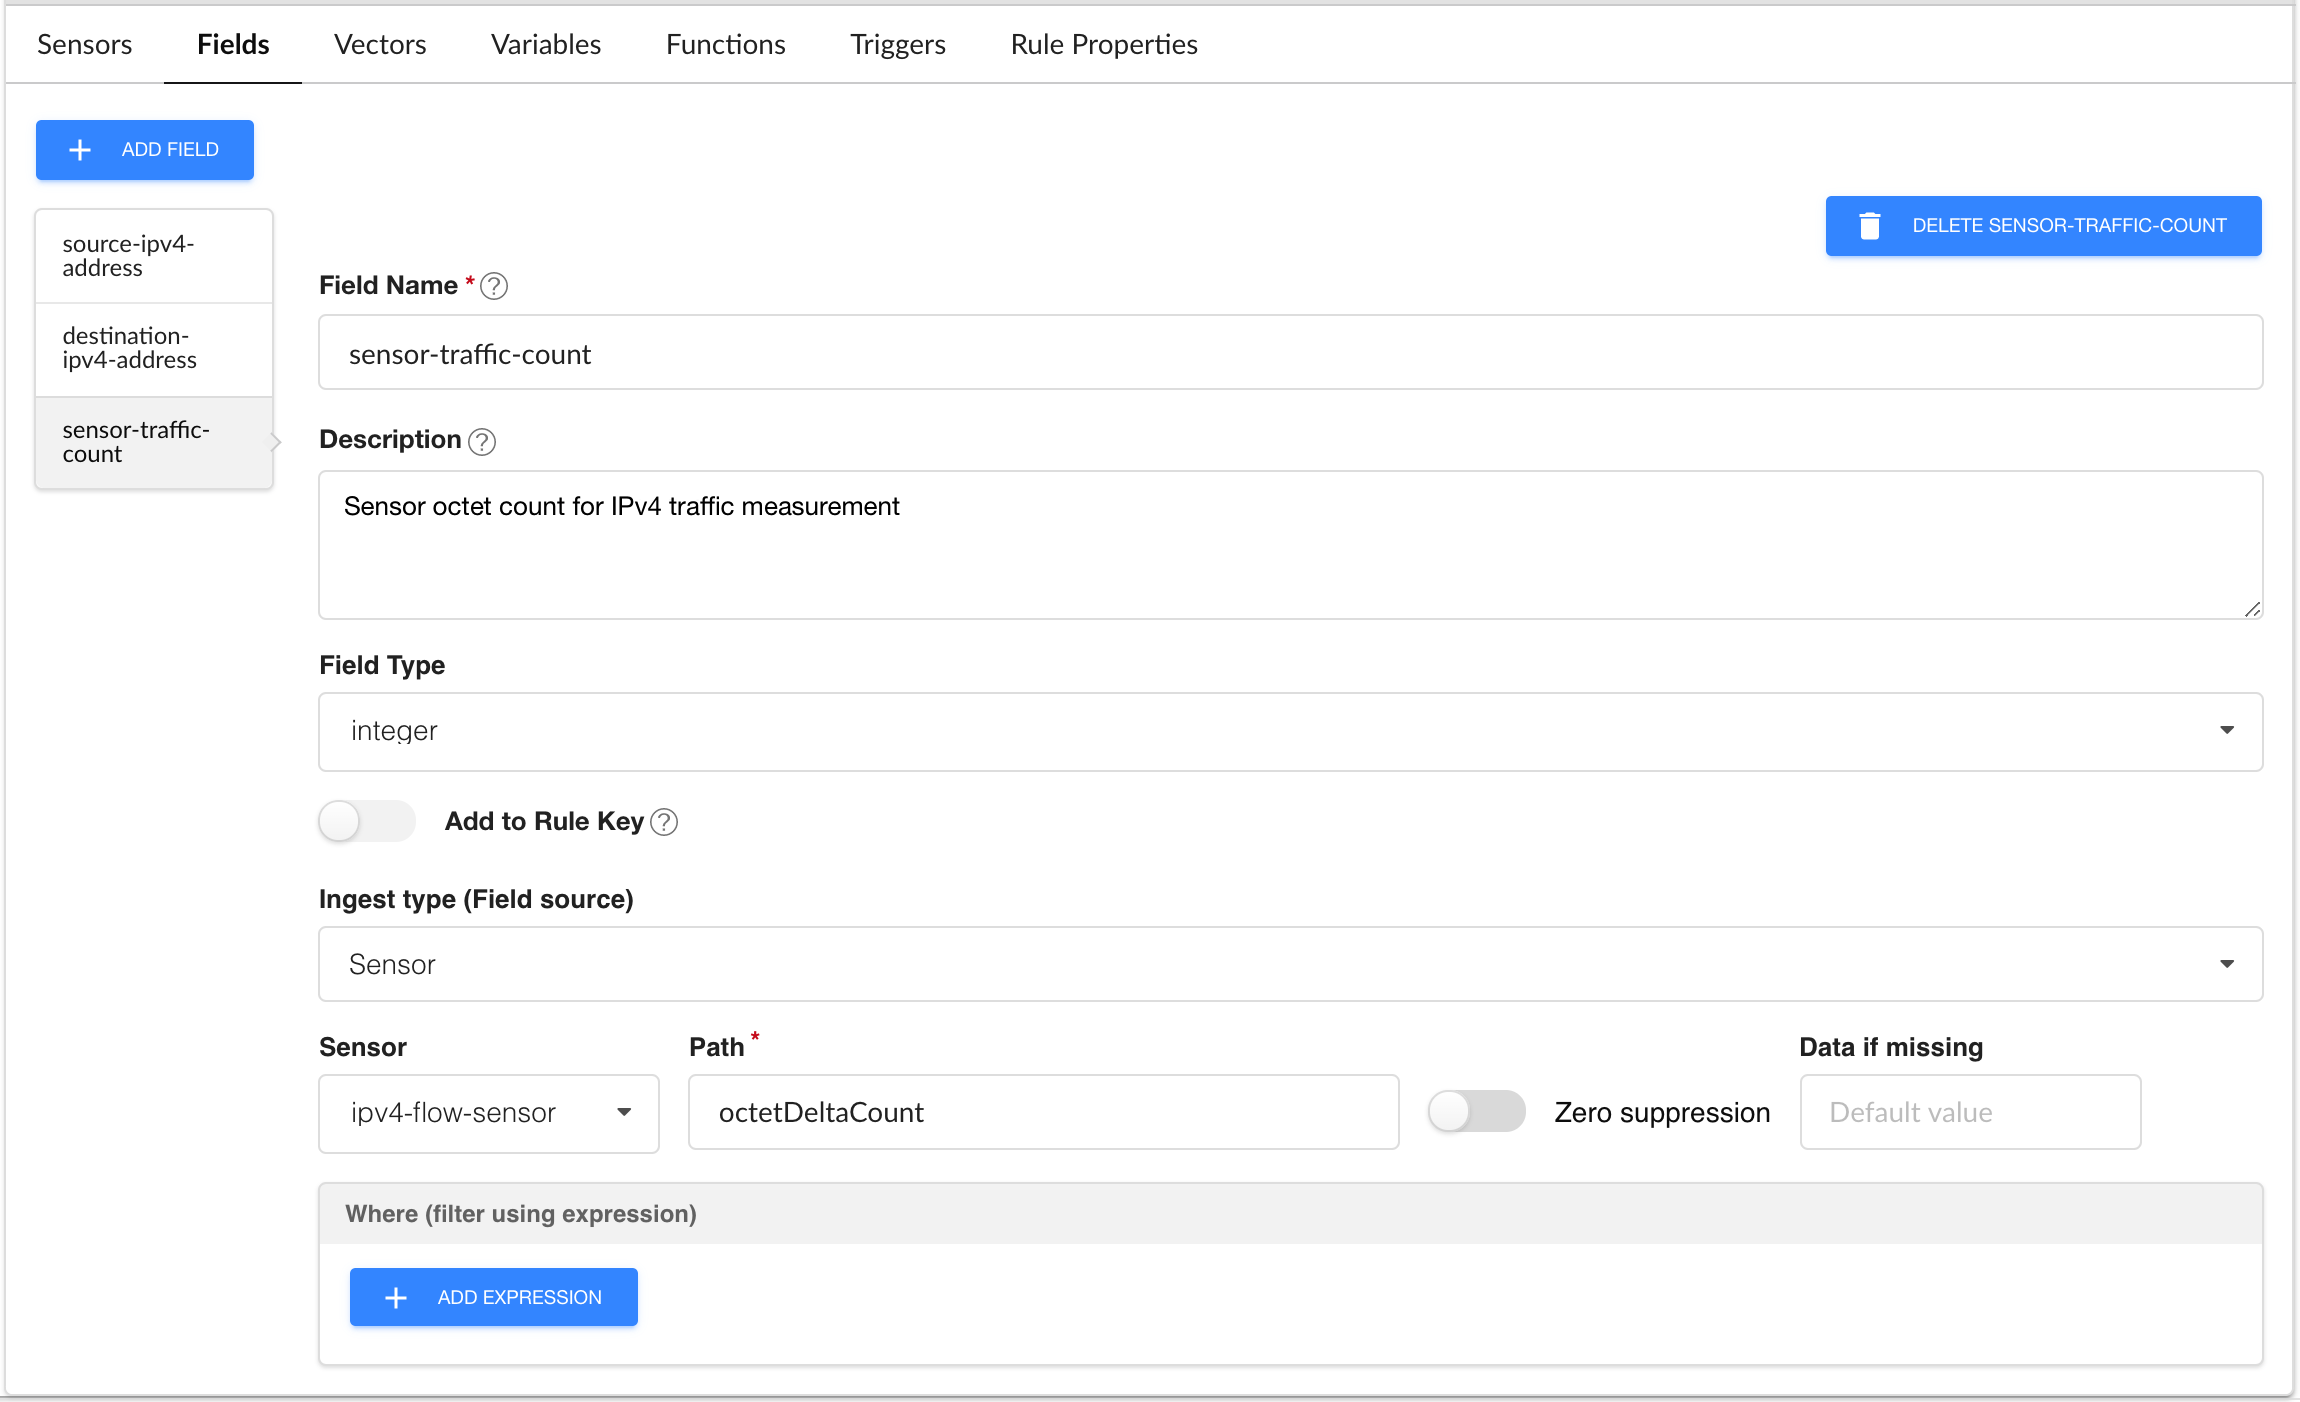
Click the + Add Field button again and enter
the following parameters to configure the third field, sensor-traffic-count:
-
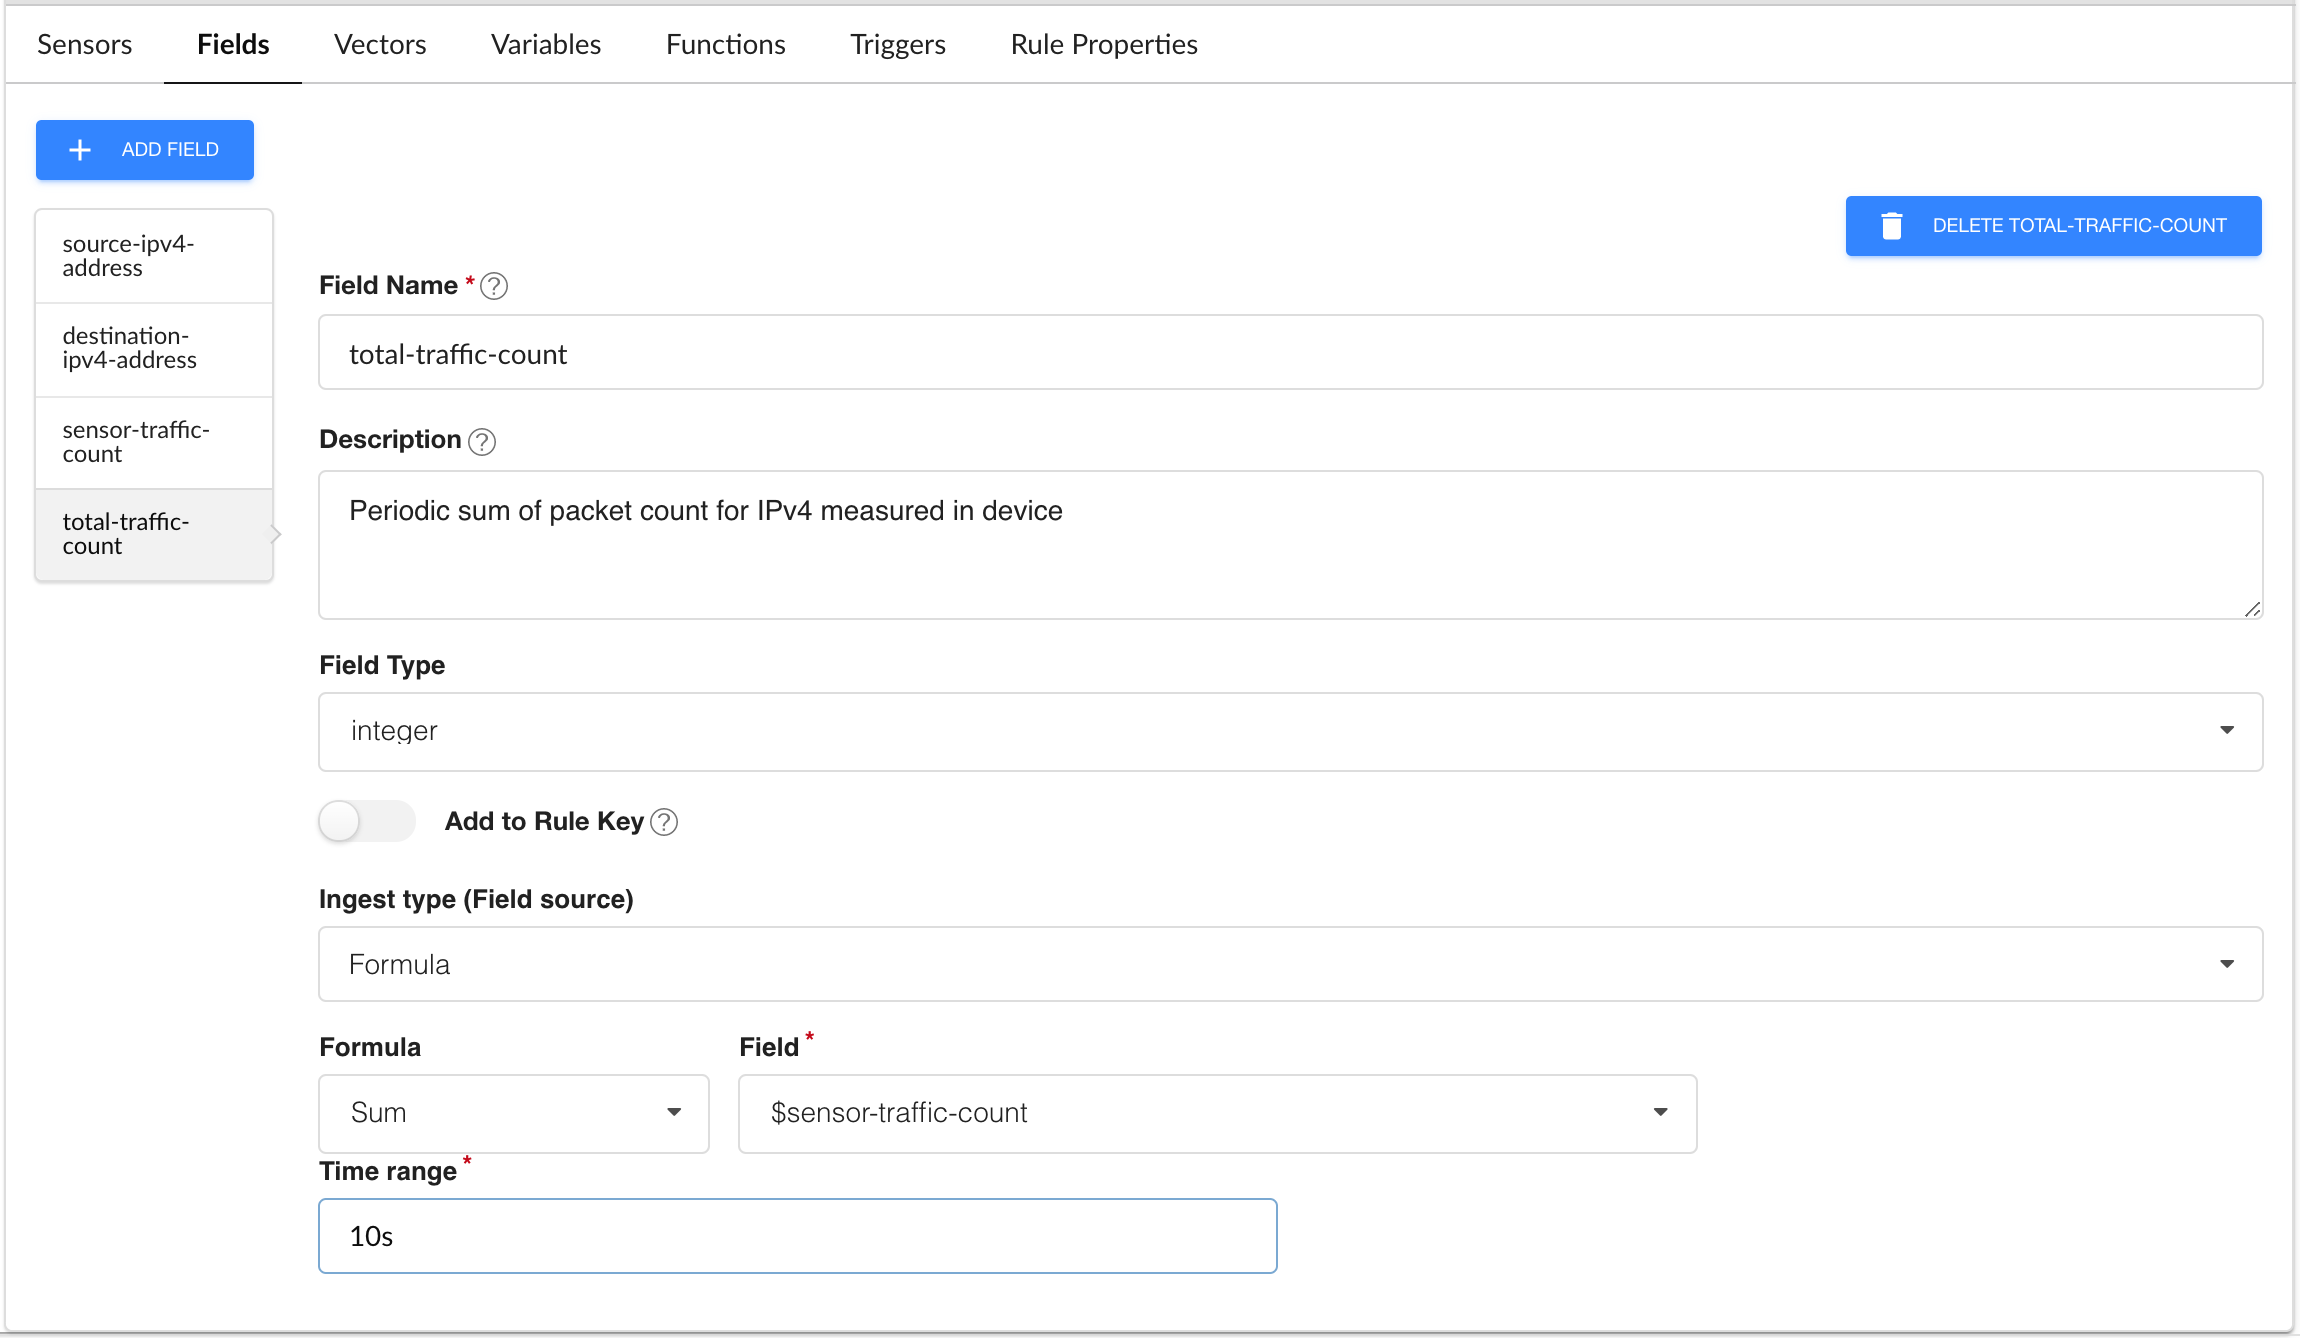
Click the + Add Field button again and enter
the following parameters to configure the fourth field, total-traffic-count:
-
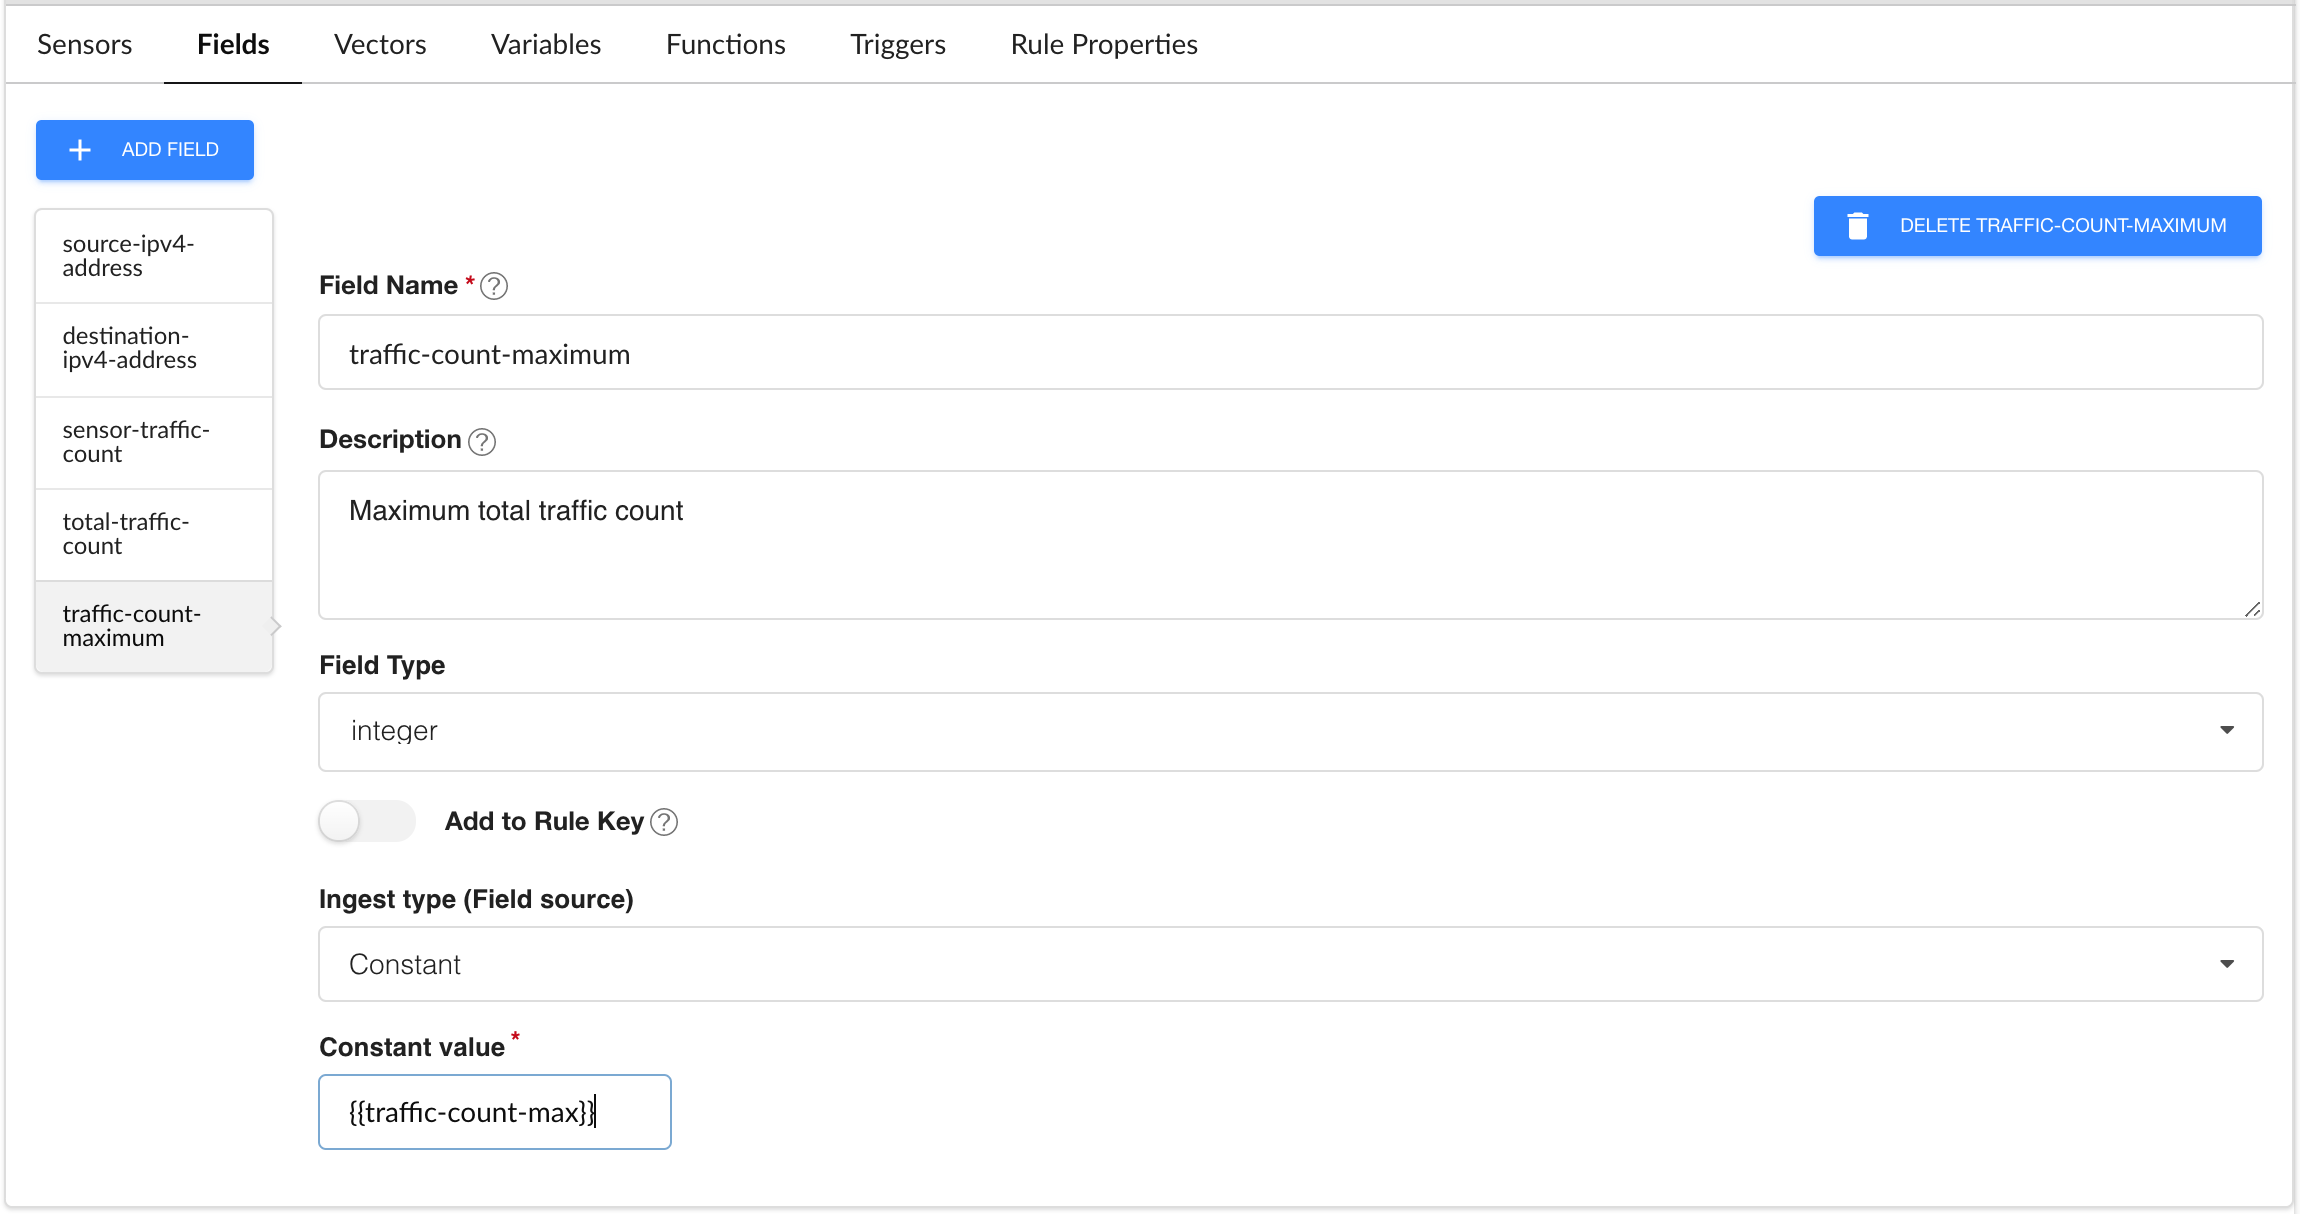
Click the + Add Field button again and enter
the following parameters to configure the fifth field, traffic-count-maximum:
-
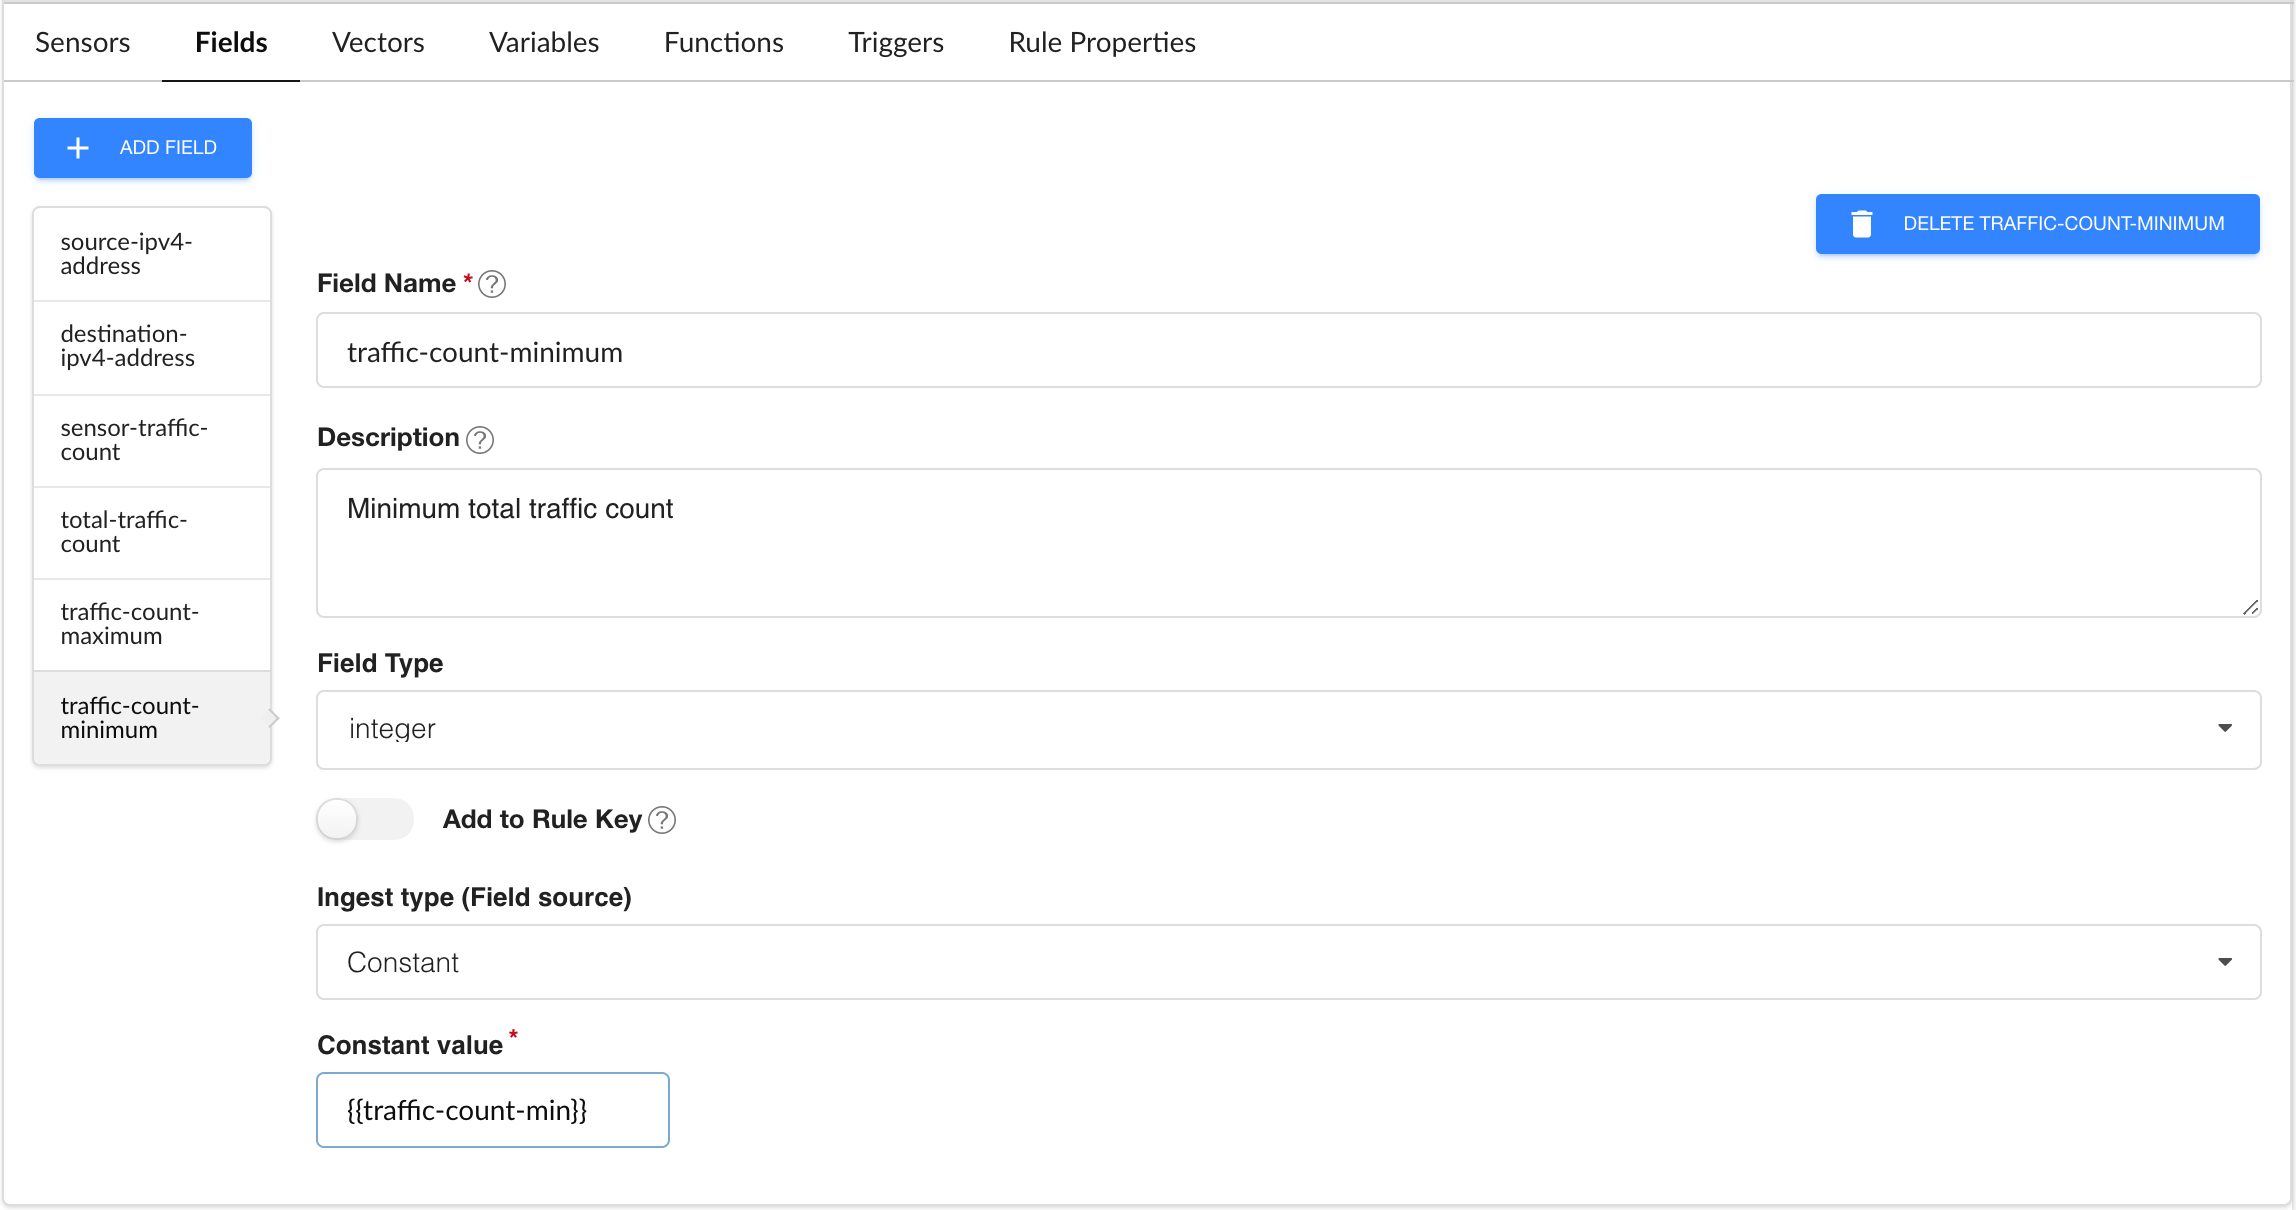
Click the + Add Field button once more and
enter the following parameters to configure the sixth field, traffic-count-minimum:
-
As the last step for the fields configuration, set the
field aggregation time-range value to 10s:

-
Now move to the Variables tab, click the + ADD VARIABLE button and create the traffic-count-max and traffic-count-min variables that are the constants for
the traffic-count-maximum and traffic-count-minimum fields, respectively.
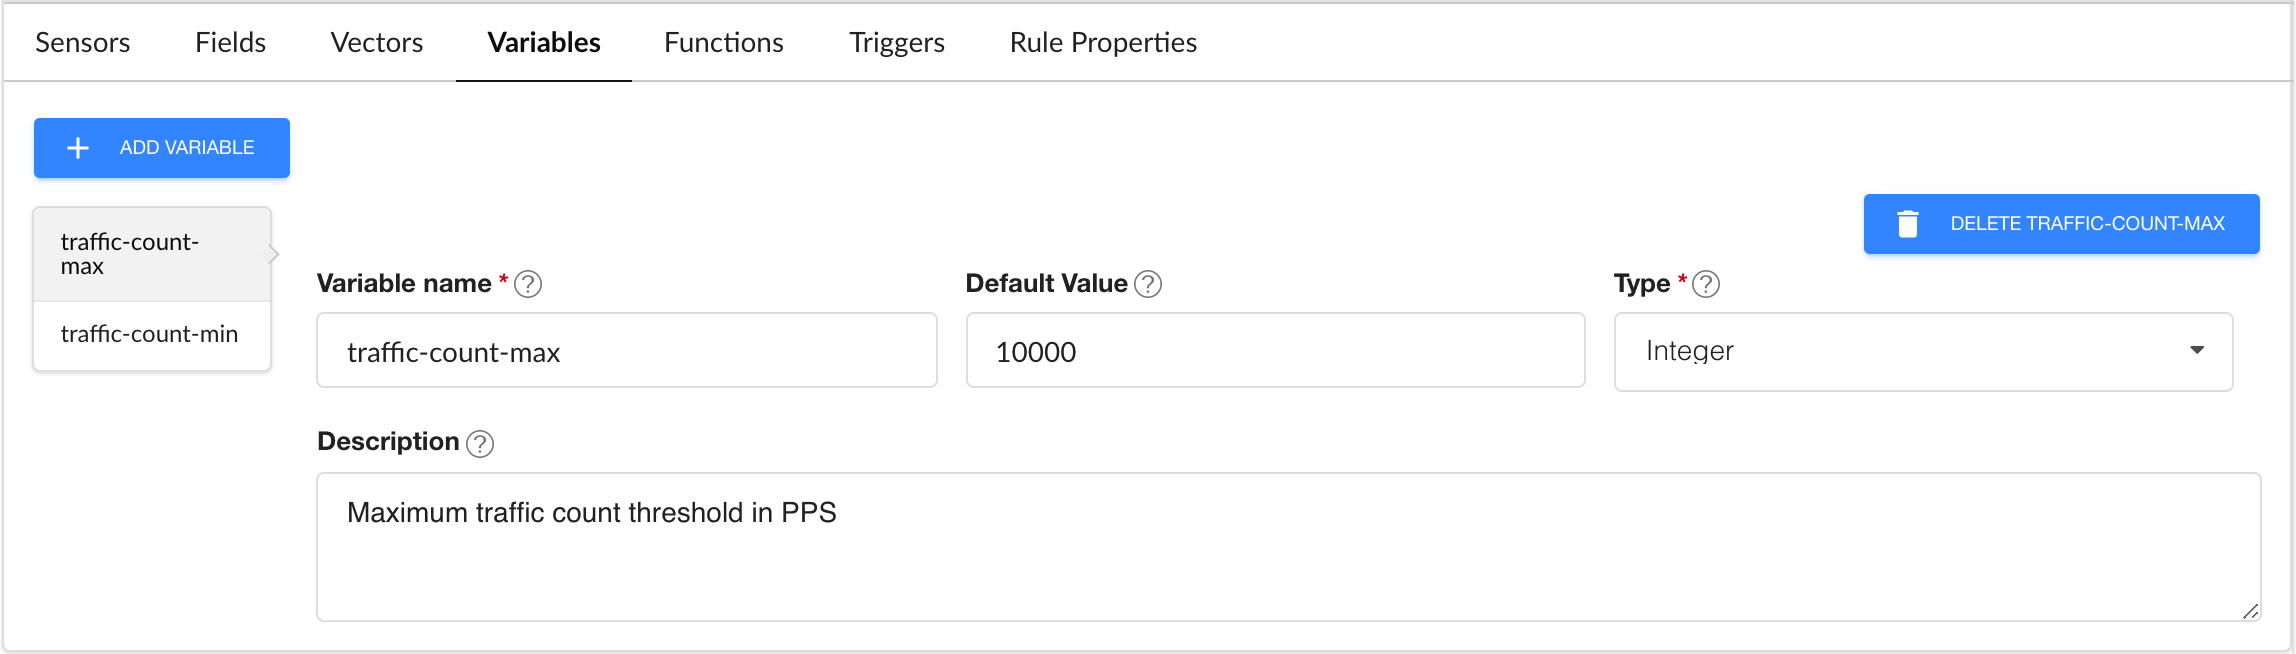 Note:
Note:Only the definition for the traffic-count-max is shown graphically. Choose an appropriate Default Value when configuring both traffic-count-max and traffic-count-min variables. The value shown above is for testing purposes only and may not be appropriate for your network.
-
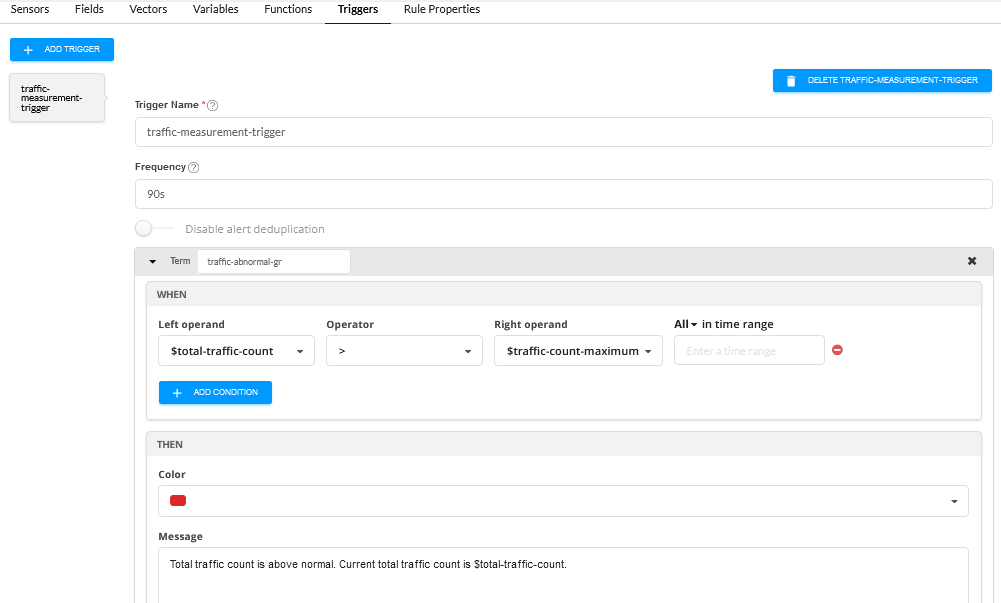
Now move to the Triggers tab, click the + Add trigger button and enter the following parameters to configure a trigger
called traffic-measurement-trigger:
Usage Notes:
-
Sensor Tab:
-
The sensor name ipv4-flow-sensor is user-defined
-
The sensor type is flow
-
The sensor uses the predefined template hb-ipfix-ipv4-template
-
-
Variables Tab:
-
The variables traffic-count-max and traffic-count-min are statically configured integers. In this case the values represent Bytes per second
-
These values are referenced in fields traffic-count-maximum and traffic-count-minimum and provide a reference point to compare against the total-traffic-count field
-
-
Fields Tab:
-
Six fields are defined; some fields are used in the trigger settings while one field is referenced within another field
-
The field names are user-defined fields (UDF)
-
Fields source-ipv4-address, destination-ipv4-address, and sensor-traffic-count are extracting information from the flow sensor input
-
Path values for these fields identify specific values from the NetFlow messages, using naming according to IPFIX Information Elements
-
Fields source-ipv4-address and destination-ipv4-address have the Add to rule key setting enabled, indicating that this field should be shown as a searchable key for this rule on the device health pages
-
Field total-traffic-count - sums the IPv4 packet count from the sensor-traffic-count field every 10 seconds
-
The fields traffic-count-maximum and traffic-count-minimum are simply fixed values; the values are derived from the variables defined above
-
Field aggregation time-range - typically set to a value higher (longer) than individual field time range settings with the aim of reducing the frequency of information being sent to the database
-
-
Triggers Tab:
-
The trigger name traffic-measurement-trigger is user-defined.
-
frequency 90s - Paragon Insights compares traffic counts every 90 seconds
-
In the term traffic-abnormal-gr:
-
When $total-traffic-count (the periodic count of incoming IPv4 traffic) is greater than $traffic-count-maximum (2500 Bps), show red and the message: “Total traffic count is above normal. Current total traffic count is : $total-traffic-count”.
-
-
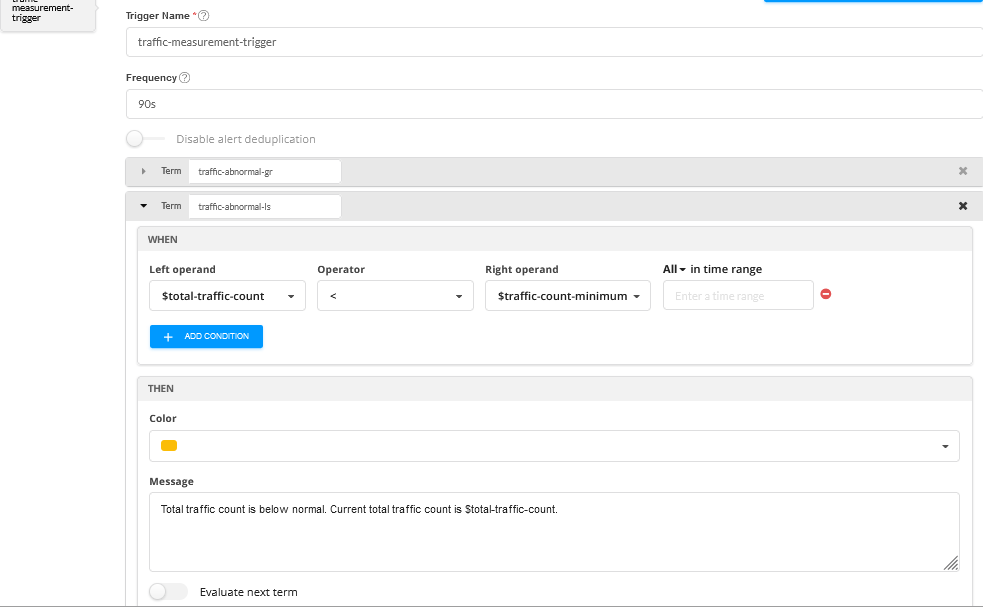
In the term traffic-abnormal-ls:
-
When $total-traffic-count (the periodic count of incoming IPv4 traffic) is less than $traffic-count-minimum (500 Bps), show yellow and the message: “Total traffic count is below normal. Current total traffic count is : $total-traffic-count”.
-
-
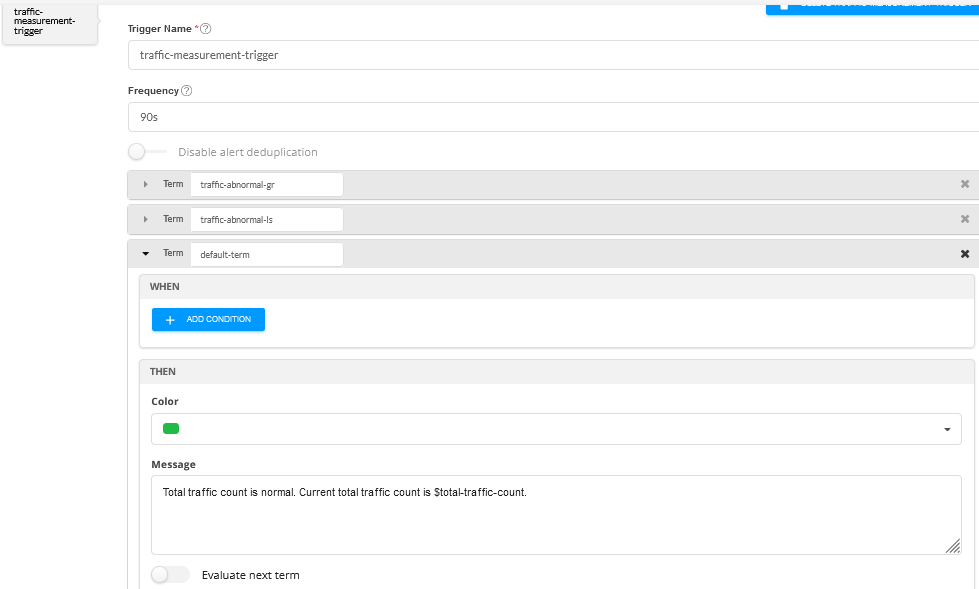
In the term default-term:
-
Otherwise, show green and the message: “Total traffic count is normal. Current total traffic count is : $total-traffic-count”.
-