NorthStar Controller Web UI Overview
You have two options for the NorthStar Controller Web UI:
-
Classic—this option, also known as the Ext UI, is available for all releases. Ext refers to the Extended Javascript (ExtJS) framework upon which this UI is based.
-
New—this option is available starting in release 6.2.0.
To switch between the two UI options, see Switching Between the Classic and New UI. This document shows screenshots from a mix of the two UIs.
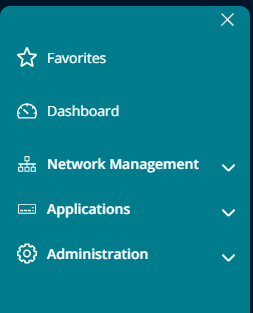
The NorthStar Controller web UI has the following menus and sub-menus:
-
Favorites
-
Dashboard
-
Network Management: Includes sub-menus for Topology, Nodes, Analytics, and Provisioning.
-
Applications: Includes sub-menus for Bandwidth Calendar. EPE Planner, Network, Events, Path Optimization, Reports, and Maintenance.
-
Administration: Includes sub-menus for Analytics, Authentication, Device Profile, License, Subscribers, System Health, System Settings, Task Scheduler, Transport Controller, Topology Filter, and Users.
Figure 1 shows the navigation bar (or left-nav bar) that appears on the left side of each page. From this bar, you can select the different menu items and sub-menus. You can access the sub-menus by clicking the down arrows.
The availability of some functions and features is dependent on user group permissions.
If you have certain pages that you use frequently, you can save them to Favorites in the left-nav bar for quick access.
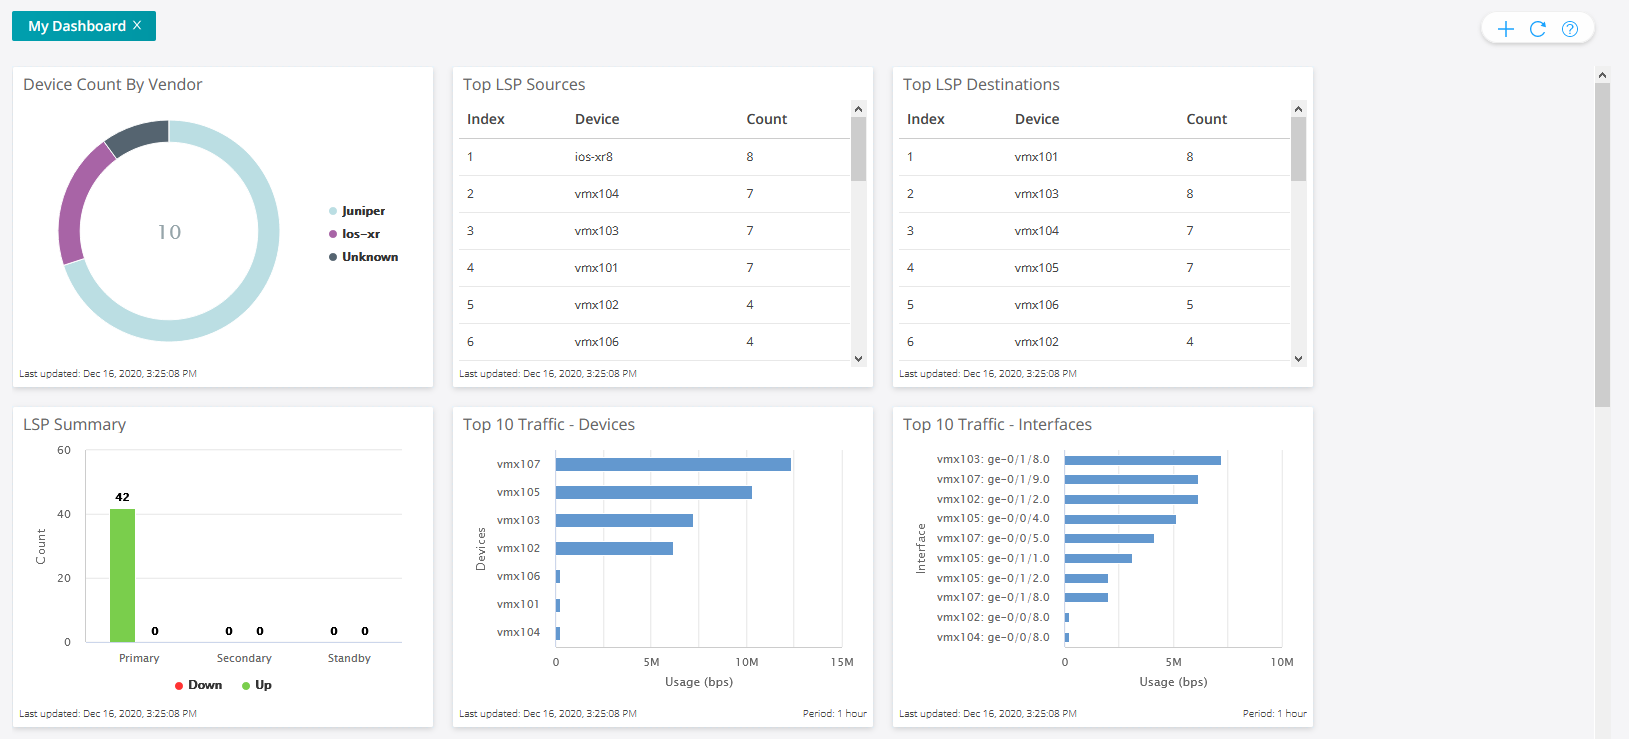
The Dashboard (landing page) shows the network status and statistics information in the form of widgets. This page is displayed when you first log in to the web UI. Figure 2 shows a sample of the available widgets.
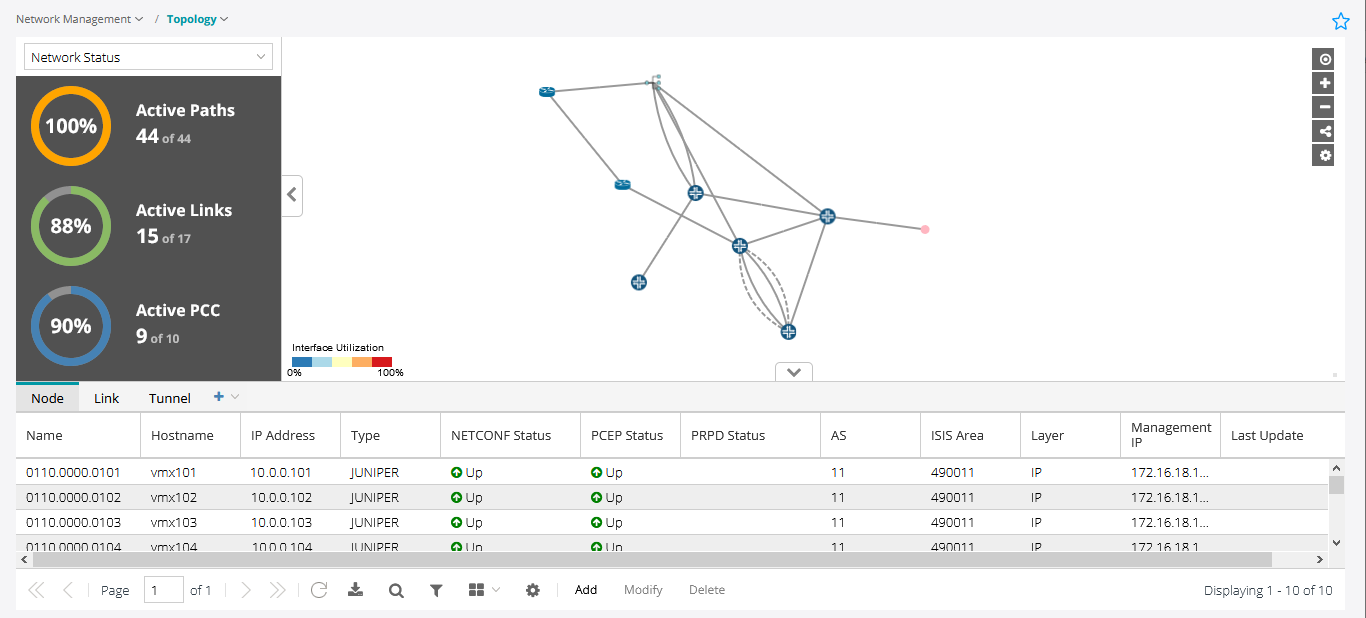
The Network Management > Topology page is the main work area for the live network you load into the system.
Figure 3 shows an example of the Topology page.
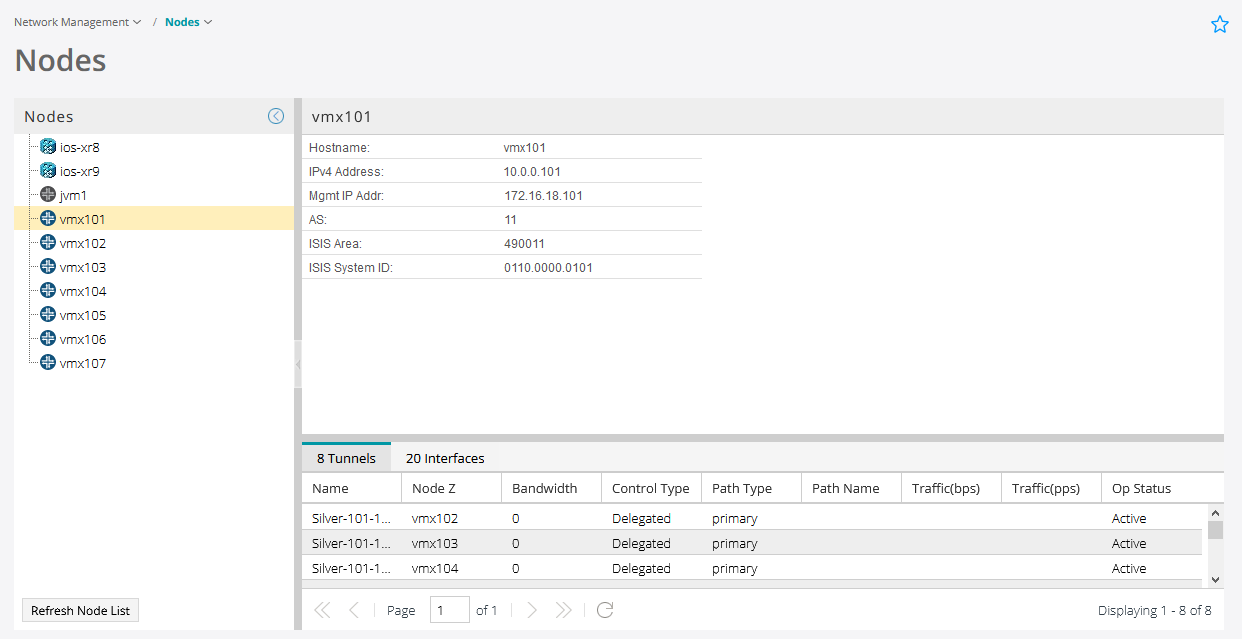
The Network Management > Nodes page, shown in Figure 4, displays detailed information about the nodes in the network. With this view, you can see node details, tunnel and interface summaries, groupings, and geographic placement (if enabled), all in one place.
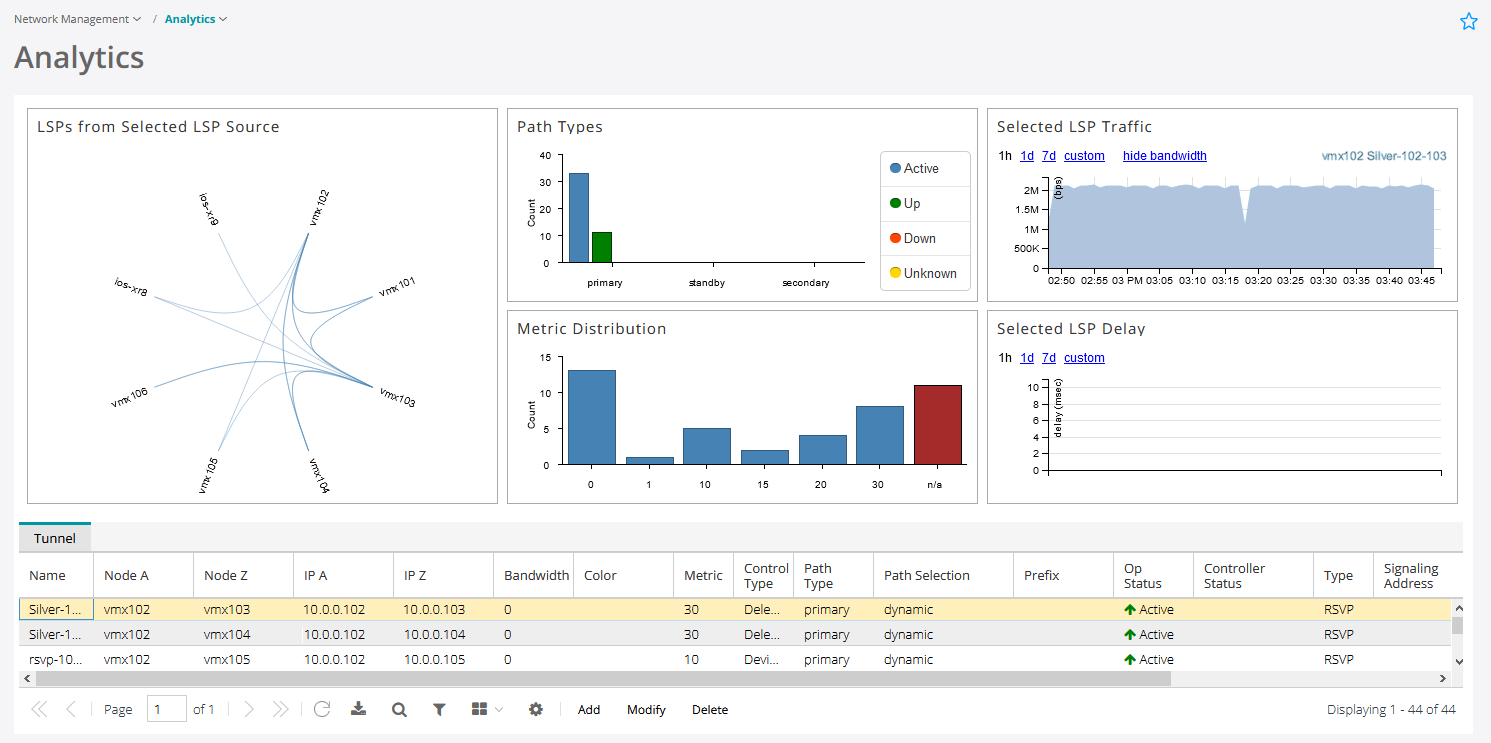
The Network Management > Analytics page , shown in Figure 5, provides a collection of quick-reference widgets related to analytics.
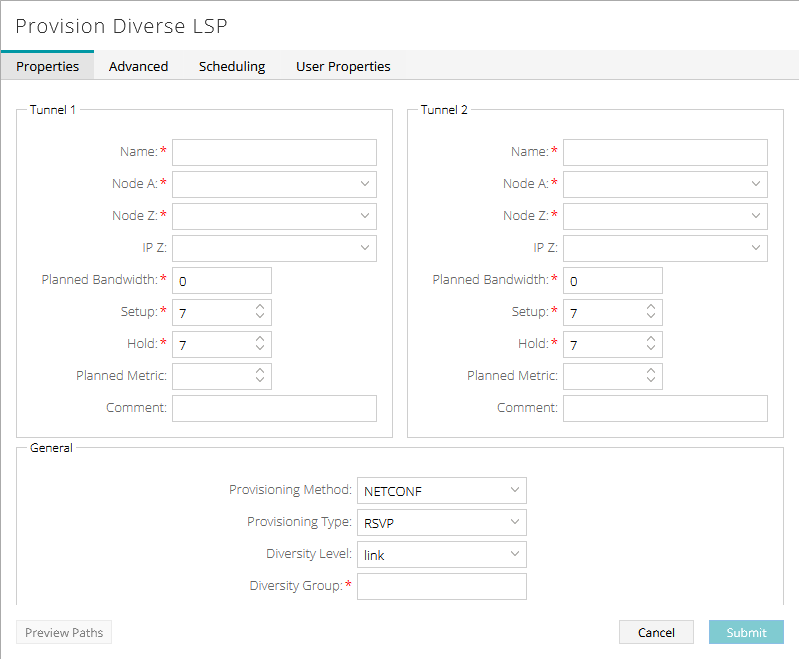
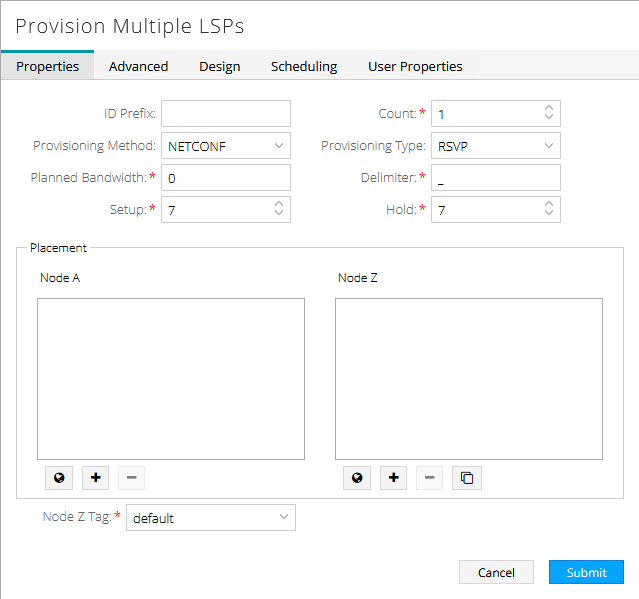
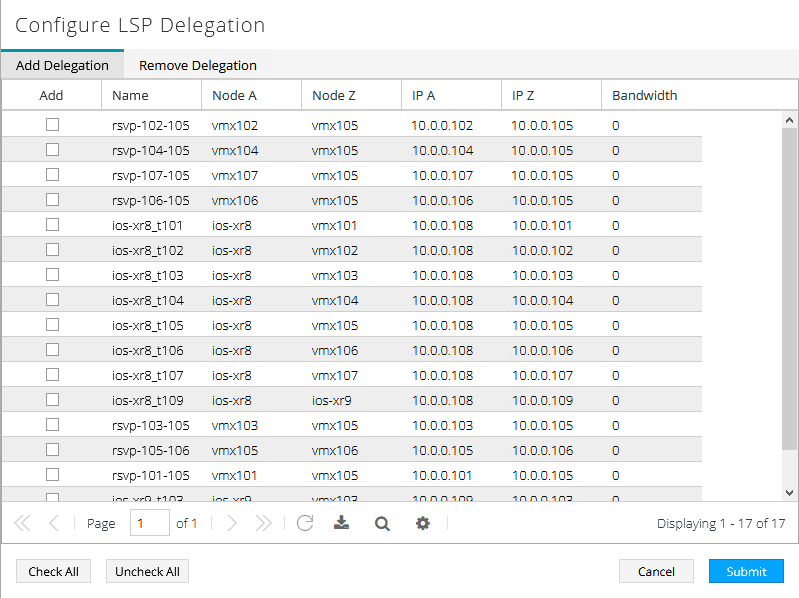
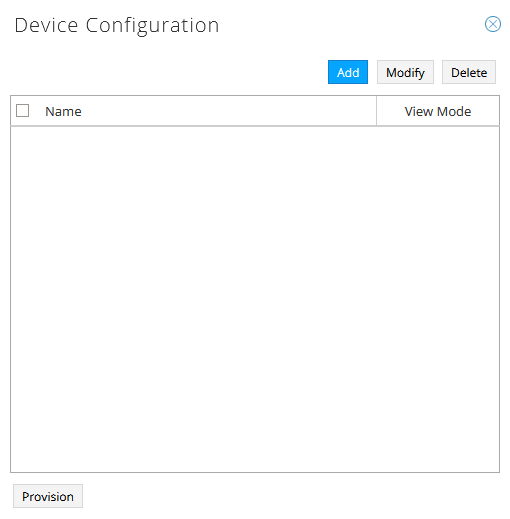
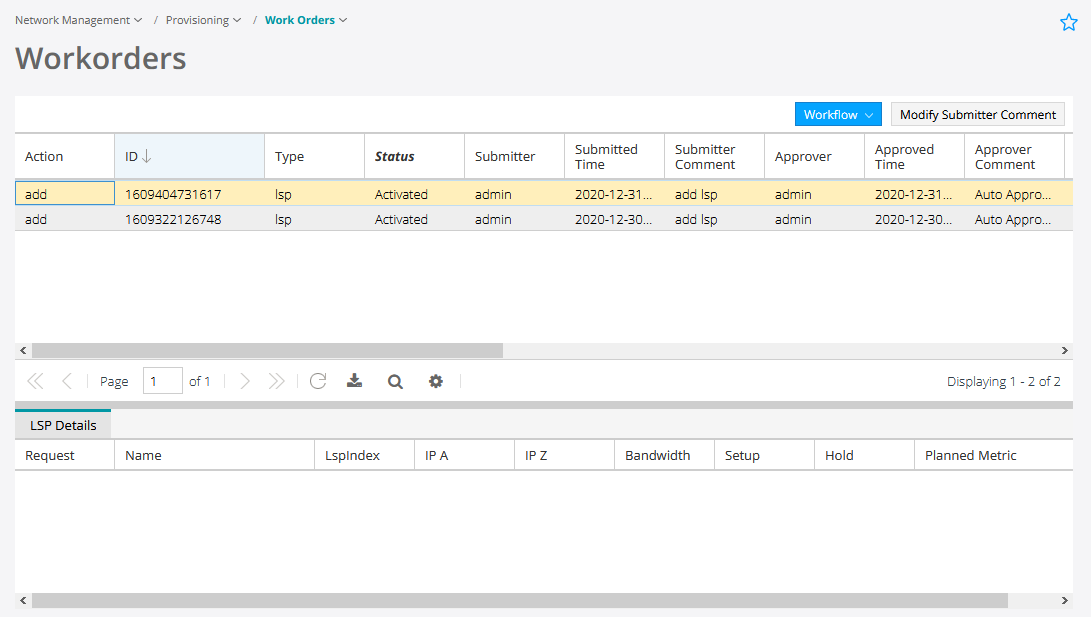
The Network Management > Provisioning sub-menu has options for provisioning LSPs, configuring devices, and managing work orders (Figure 6 through Figure 11).
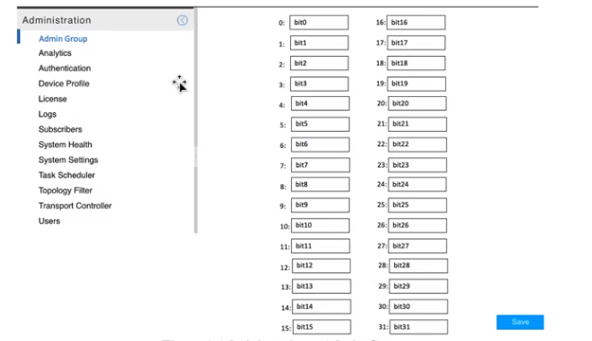
The Administration menu contains the following items:
The “Admin only” functions can only be accessed by the Admin.
-
Admin Group
-
Authentication (Admin only)
-
Device Profile
-
License (Admin only)
-
Logs
-
Subscribers (Admin only)
-
System Health
-
System Settings (Admin only)
-
Task Scheduler
-
Transport Controller
-
Topology Filter
-
Users (Admin only)
Additionally, you can access user and help functions in the top right corner of the window.
-
User Options (user icon)
-
Account Settings
-
Log Out
-
-
Help Options (help icon)
-
Documentation (link to NorthStar customer documentation)
-
About (version and license information)
-
Switching Between the Classic and New UI
When you log in to the Northstar Controller for the first time after installing or upgrading, you are placed in the Classic UI.
When you subsequently log in to the Northstar Controller, you are placed in the UI that you last used. Your last selection is saved per user per browser.
To switch from the Classic UI to the New UI, click the hamburger icon in the top right corner and select New UI.
To switch from the New UI to the Classic UI, click the four-square icon in the top right corner and select Ext UI.