Dashboard Overview
The Dashboard view is shown in Figure 1. The Dashboard presents a variety of status and statistics information related to the network, in a collection of widgets that you can arrange according to your preference. The information displayed is read-only.
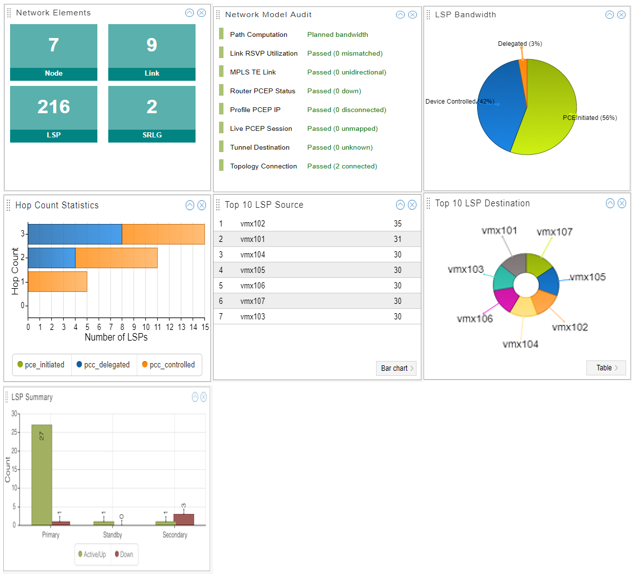
Table 1 describes the available dashboard widgets.
|
Widget |
Description |
|---|---|
|
Network Elements |
Summation of the elements (nodes, links, LSPs, SRLGs) in the model, computed from the client. If the values differ from the information reported in the Network Status (left pane) or in the network information table, it is because they have different sources of data for the calculations and different rates of synchronizing to the client. |
|
Network Model Audit |
Periodically poles for status. This is a troubleshooting tool. |
|
LSP Bandwidth |
Pie chart showing the percentage of the total LSP bandwidth that is accounted for by each LSP type (PCE-initiated, PCC-delegated, PCC-controlled). |
|
Hop Count Statistics |
Aggregates the number of LSPs by hop count, per LSP type (PCE-initiated, PCC-delegated, PCC-controlled). In other words, it shows the number of LSPs of each type with three hops, with two hops, and so on. The LSP types are color coded according to the key at the bottom. Click an LSP type in the key to toggle between hiding and unhiding the LSP type. Mouse over the color bar to see the count. |
|
Top 10 LSP Source |
Top 10 routers that have LSPs originating there, and the number of originating LSPs. Click the button in the lower right corner to toggle between table, bar chart, and pie chart representation. |
|
To 10 LSP Destination |
Top 10 routers that have LSPs terminating there, and the number of terminating LSPs. Click the button in the lower right corner to toggle between table, bar chart, and pie chart representation. |
|
LSP Summary |
Number of active, standby, and secondary LSPs that are Up and Down. |
The dashboard offers the following options for customizing the arrangement of widgets:
-
The Settings drop-down menu in the upper right corner of the Dashboard view allows you to change the number of widget columns.
As shown in Figure 2, you can select either Two columns or Three columns.
Figure 2: Dashboard Settings Menu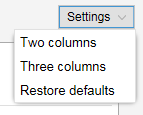
-
Minimize a widget by clicking on the up arrow in the upper right corner of the widget.
-
Close a widget by clicking on the X in the upper right corner of the widget.
-
Drag and drop widgets to relocate them on the dashboard.
-
From the Settings drop-down menu in the upper right corner of the dashboard, select Restore defaults to return all the widgets to the original display arrangement.