Diagnostics Manager
The Diagnostics Manager allows you to run CLI commands on the routers in the network from the NorthStar Controller UI without manually logging into the routers. You can select the routers, select the commands, specify variable command parameters, execute the commands, and view/save the results. This is a unified way to manage ping and traceroute results, and is a very useful tool for troubleshooting. Juniper, Cisco, Alcatel, and Huawei command sets are provided by default, and you can add other vendor command sets as needed.
SSH connectivity to the routers is required for this feature.
There are multiple ways to access Diagnostics from the NorthStar Controller UI:
-
Navigate to Applications > Diagnostics. From this window, you can see the history of commands, check their results, and launch new or ping or traceroute requests.
-
Right-click a node or selection of nodes on the topology map, select Diagnostics, and then select either Ping, Traceroute, or Run CLI. The setup window for the selected option opens.
Note:If you select multiple nodes, they should be of the same vendor type.
-
Right-click a row in the network information table. The selections available here are specific to the network element (node, link, tunnel, or interface).
-
On the Node tab: select Ping, Traceroute, or Run CLI (launches the appropriate setup window)
-
On the Link tab: select Show Interfaces (runs the
show interfacesCLI command for each interface associated with the link) -
On the Tunnel tab: select Show Tunnels, Run MPLS Ping, or Run MPLS Traceroute (runs each of those CLI commands)
-
On the Interface tab: select Show Interfaces (runs the
show interfacesCLI command)
-
Main Diagnostics Window
The main Diagnostics window lists the CLI commands that are running or that have completed. Figure 1 shows an example of the window.
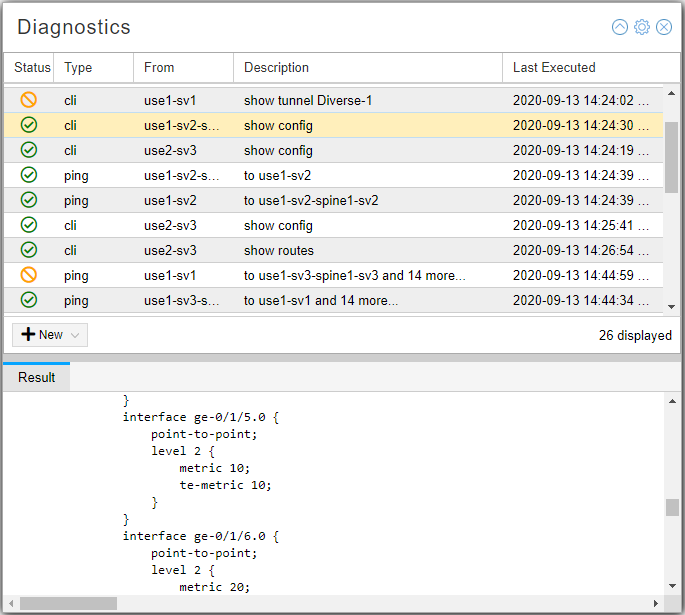
The Status column indicates whether running the command was successful or not. Click any row in the table or select multiple rows (shift-click) to display the results in the lower part of the window. Right-clicking one or more rows presents additional options:
-
Save Selected Results saves the selected results to a text file.
-
Save All Results saves all the results to a text file.
-
View Group Result presents the results of related ping commands in matrix format. See Figure 2 for an example. Hover over a square in the matrix for additional information about that specific result. Items in the matrix are color-coded based on success (50% or less packet loss = green) or failure (more than 50% packet loss = red). Color intensity indicates the degree of packet loss. In Figure 2 for example, vmx101 to vmx106 experienced a 60% packet loss. If it had been higher, the red color would be more intense. The actual percent packet loss is available in the individual ping results.
Figure 2: Group Results of Related Ping Commands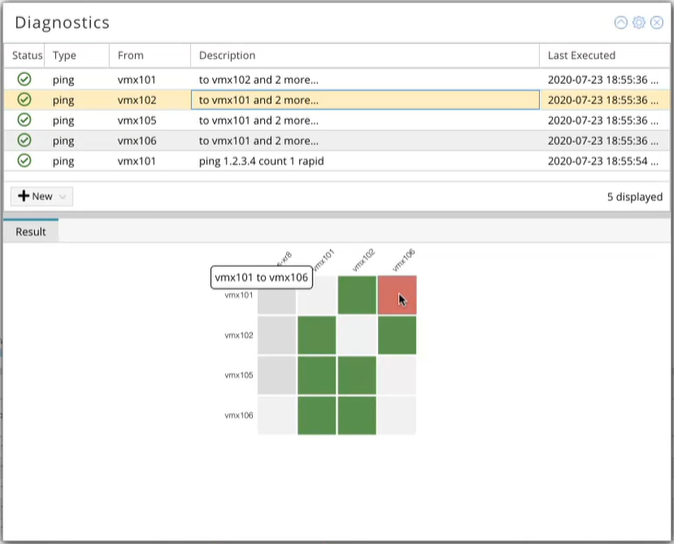
-
Delete allows you to delete selected rows from the list of executed commands once you are finished with them.
In the upper right corner of the Diagnostics window, the up arrow button collapses the window. This is handy if you need to see more of the topology but don’t want to close the Diagnostics window. The settings (gear) button gives you the option to change the foreground and background colors used in the results part of the window. You don’t see the color change until you click on a row in the list of executed commands, after changing the color options.
Ping and Traceroute Setup Windows
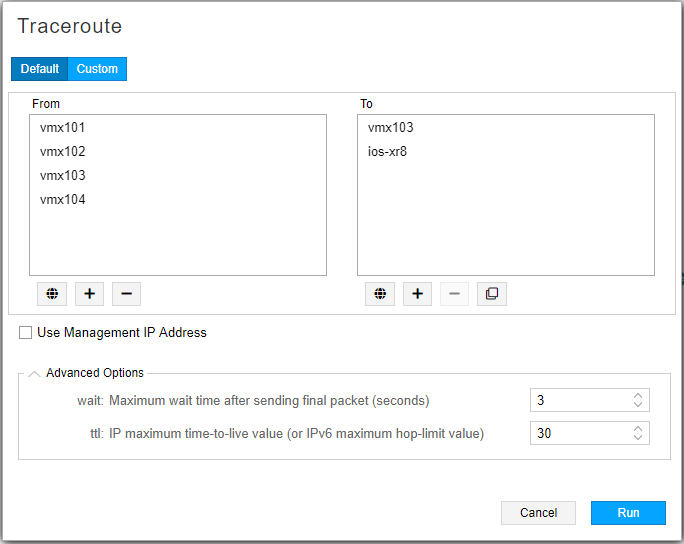
From the main Diagnostics window, you can initiate a new ping or traceroute command by using the +New drop-down menu to select Ping or Traceroute which displays the setup window for your selection. The Ping and Traceroute setup windows are similar. Figure 3 and Figure 4 show examples of the Default tab on both windows. Note that the available Advanced Options are different between the two.
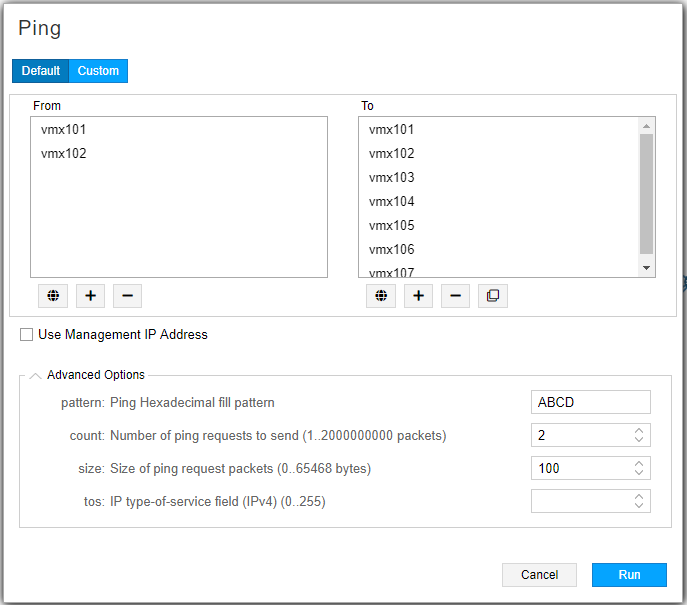
On the Default tab:
-
The world icon adds the nodes that are currently selected on the topology map to the From or To sides of the ping request. Make your selections on the map first and then click the icon.
-
The plus icon adds all nodes in the topology to the From or To list.
-
The minus icon removes selected nodes from the list. Click a node in the list to select it. Use shift-click to select multiple nodes.
-
The copy icon on the To side copies all the nodes on the From list to the To list.
-
Optionally, click the Use Management IP Address check box. If you don’t opt to use the management IP address, the loopback address is used.
-
Use the Advanced Options to customize the ping or traceroute command. We recommend not using the advanced options if you are running ping or traceroute for a large number of devices as it could be significantly slower.
The Custom tabs on the Ping and Traceroute setup windows are also similar to each other. Figure 5 shows an example of the Custom tab on the Ping setup window, as an example.
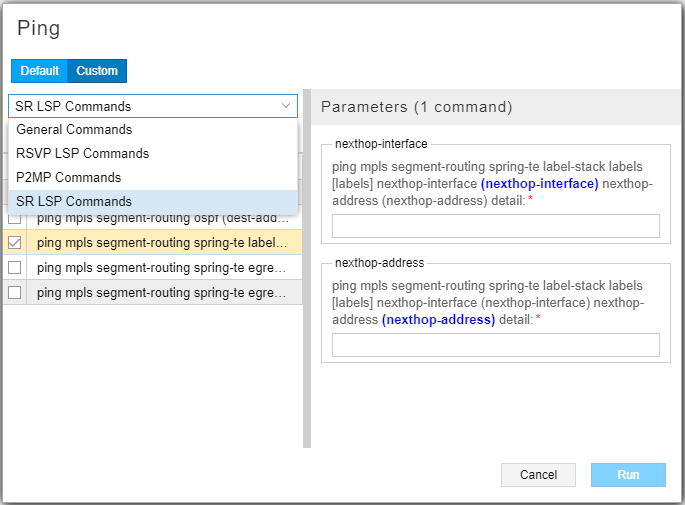
On the Custom tab:
-
From the drop-down menu at the top you can select a category of commands. The options for both Ping and Traceroute include:
-
RSVP LSP Commands
-
P2MP Commands
-
SR LSP Commands
Ping offers the additional General Commands category.
-
-
Click the Commands check box to select all the commands in the category. Otherwise, click the check boxes beside the command variation(s) of your choice.
-
For commands that require the specification of variable parameters, a space for each parameter is displayed in the Parameters section on the right side of the window when you highlight the command. Enter the appropriate value.
-
Click Run in the lower right corner of the window to execute the command(s). The Diagnostics window displays the new commands along with status and results.
When a traceroute command is successfully completed, the path is highlighted in the topology map.
Run CLI
When you access Diagnostics by right-clicking one or a selection of nodes on the topology map, you can select Ping or Traceroute, and you have the additional option of selecting Run CLI as shown in Figure 6.

Figure 7 shows an example of the Run CLI setup window. The drop-down menu on the left side of the window offers categories of commands from which you can select.
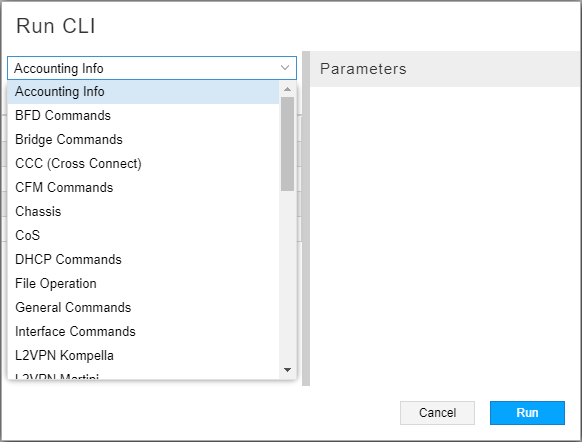
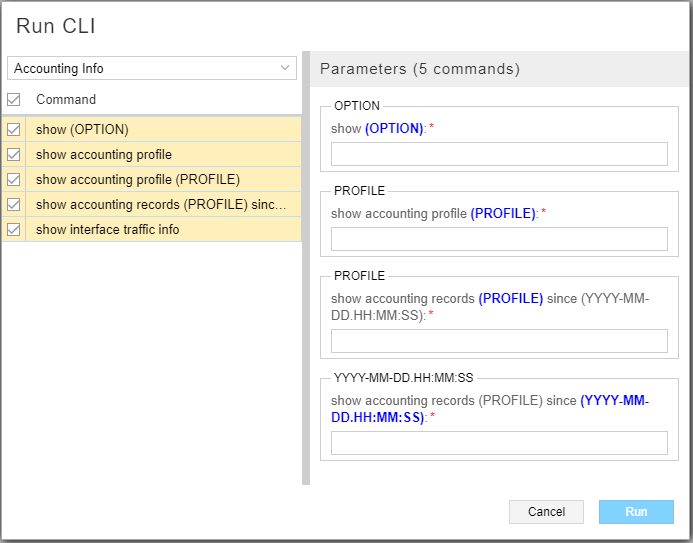
Once you select a command category, you can select all commands in the category by clicking the check box beside “Command”, or you can click the check boxes for any number of the individual commands listed. As in the Ping and Traceroute setup windows, some commands require the specification of variable parameters. A space for each parameter is displayed in the Parameters section on the right side of the window when you highlight the command. Enter the appropriate values. Make all your command selections first, and then enter the parameter values because the Parameters section of the window refreshes when you add commands and clears any parameter information already entered. Figure 8 shows an example of selected commands and space for the required parameters.
Click Run in the lower right corner of the window to execute the command(s). The Diagnostics window displays the new commands along with status and results. If you selected multiple nodes, each command you specified is run on each node and all the results displayed in the Results portion of the Diagnostics window. The selected nodes must be of the same vendor because only one CLI command set is used. If you want to run CLI on nodes of different vendors, run them separately.
Modifying the Configuration Command Files
There are currently three configuration files that contain the commands NorthStar uses for diagnostics located in /opt/pcs/db/diagnostic:
-
clicommands.json
-
pingcommands.json
-
traceroutecommands.json
By default, the commands are organized into categories such as Accounting Info, Chassis, or File Operation in clicommands.json. These are the categories that are listed in the drop-down menu in the Run CLI setup window, and are vendor-specific. When you select a node on which to run CLI commands, NorthStar collects the vendor type of the node and presents the categories and command sets that are applicable. You can modify the category names and the organization of commands within the categories if you choose. You can also add commands. The same is true in ping and traceroute categories.
Use a text editor to modify any of the .json files. Each command designation consists of:
-
The command syntax (“cmd”).
-
The command as it is shown in the UI (“displayName”).
-
The command ID which is a unique integer greater than 10 (“cmdId”). Command ID numbers less than 10 are reserved for internal NorthStar use. We recommend using integers greater than 5000 for new commands, to reduce the possibility of conflicts with existing command IDs.
This example shows the structure of entries in the clicommands.json file:
{
   "cmd": "show config | display inheritance|no-more",
   "displayName": "Show configuration",
   "cmdId": 380
},
{
   "cmd": "show config logical (LR) | display inheritance|no-more",
   "displayName": "Show configuration (LR)",
   "cmdId": 1571
},