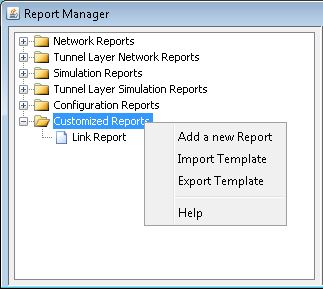
Report Manager Window Overview
The Report Manager window is split into two panes, where the left pane displays the available reports in a tree view, and the right pane, or Results Pane, displays the contents of the selected report. The reports are categorized into the following categories:
Network Reports: These are the main network reports, including path, utilization, and cost reports. These reports are dynamically generated, meaning the report is always up to date, reflecting the current state of your network model. Each time that the Report Manager is opened, upon the first click of a report, the report is generated and saved to the Report folder of the network model. For all other subsequent clicks on that report, the report is read from the cache unless you close and reopen the Report Manager, or chooses to regenerate the report, an option described in the next page.
Tunnel Layer Network Reports: These are the tunnel layer related network reports, including tunnel path and diversity, tunnel traffic, FRR, and tunnel RSVP BW reports.
Simulation Reports: These reports provide information on the performance of the network after running failure simulation. Certain reports are only available after running specific failure simulations.
Tunnel Layer Simulation Reports: These reports provide information on the performance of the network relating to the tunnel layer after running failure simulation.
Configuration Reports (Router only): These reports are generated when you import network configuration files into your network model (via File > Import Data).
Customized Reports: The customized reports are user-customized reports, where you select columns of interest from an existing Node, Link, Interface, Demand, and Tunnel report.
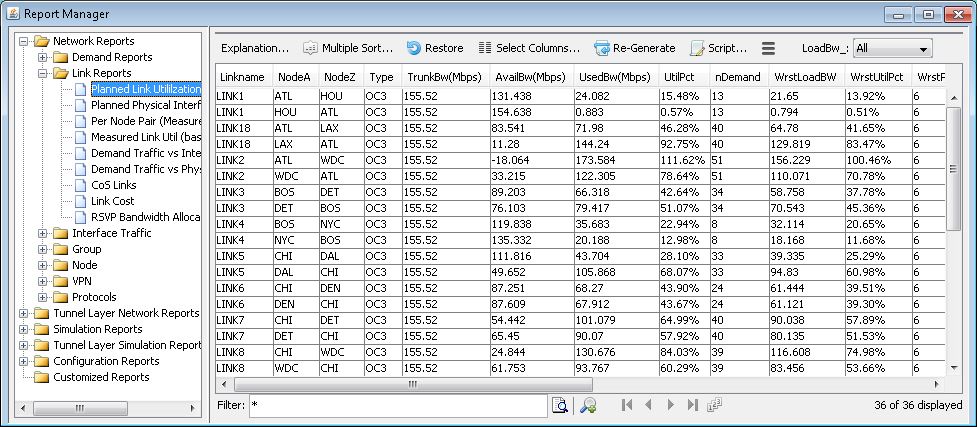
Some report windows contain a filter mechanism which allows you to search for any expression.
Field |
Description |
|---|---|
Explanation |
Provides an explanation of the currently selected report. |
Multiple Sort |
Allows two consecutive sorting methods to be applied to the current report. |
Restore |
Displays the report in its original form prior to any sorting or searching. |
Select Columns |
Opens a Column Selection window, allowing you to select which columns to display in the report. |
Re-Generate |
Refreshes the currently selected report. |
Script |
This creates a file for filtering the report in text mode. The filter is based on the query specified in the Advance Filter window. |
Actions drop down |
The actions available include setting columns to display, saving the report, and printing. |
LoadBw drop down |
When there are multiple periods in the report, this allows you to select a specific time period. |
Filter |
Performs the search as specified in the Filter field. |
Advance Filter |
Opens an Advanced Filter window, allowing you to search by exact match, substring match, wildcards, and regular expressions. |
Go to page |
Displays the page entered here. Enter the page number and click “Go” or click <Enter>. |
Lines Per Page |
Sets the number of lines that are shown on each page or the viewer. Enter the number of lines to show per page and click “Set” or click <Enter>. |
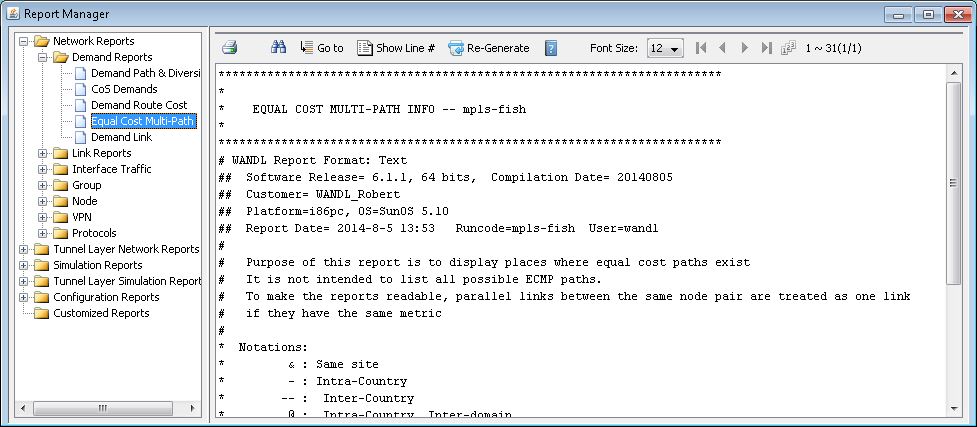
Some reports are displayed simply as text output without tables.
Additional Report Manager Actions
The following actions can be performed on the column headers in report view in the right pane. Some actions are available by right-clicking on the column header.
Sort: The information displayed in the right pane of the Report Manager can be sorted. Click on the column header to sort in an alphabetical order. To reverse sort, click the header again.
Select Columns: This function will open up a Columns Selection window allowing you to select the columns to display in the report if applicable. The ordering of the column headers can be set in this window or by dragging the column header in the report view.
Show All Columns: Selecting this option displays all available columns for this report in the right-pane.
Reset the column order: If the column order has been changed, selecting this option will reset it to its default order.
Auto Fit This Column: Only the selected column is resized to fit the longest text entry.
Auto Fit All Columns: All columns are resized to fit the longest text entry.
Freeze Column: The column(s) are frozen for horizontal scrolling.
The following actions can be performed by right-clicking on the report entry in the left pane.
Re-generate Report: When this option is selected, the program will regenerate the report and update any fields that might need updating.
Save Whole Report to Client: Any available reports in the Report Manager can be exported to a Comma-Separated Values (CSV) file. Selecting this option will open up a directory chooser window and allow you to save the report to the desired location. This will save the entire report ignoring any filters applied.
Save Filtered Report to Client: If you have used any of the filter functions on the report, then only the filtered results are saved.
Convert Report: Saves the report into the desired format. Choose from XML, Comma-Separated Values (CSV), or Hyper-Text Markup Language (HTML). Indicate an Output File name on the server in which to save the report. The report is saved into the Output Path as indicated in the File Manager window. To change the path, press the “Browse” button and navigate to the desired directory. You can also save a copy of the report to your local client, by marking the “Copy to client” checkbox. Press the “Browse” button to navigate to the desired location on your local machine.
Generate Filter Script: This allows you to generate an advanced filtering shell script in your UNIX server environment. Once created, this script enables you to create customized reports from existing network project reports at a later time, without having to launch the NorthStar Planner client. This is useful for the advanced user who may wish to run batch processes for efficiency purposes, especially if he or she always needs to customize the generated reports using specific filters. Filter Scripts are described in detail in Advanced Filter Script Utility.
Report Options
Options that influence the output of these reports can be set in the Report Options window of the Tools > Options > Report menu. These settings include node and link references, bandwidth and distance units, and currency.
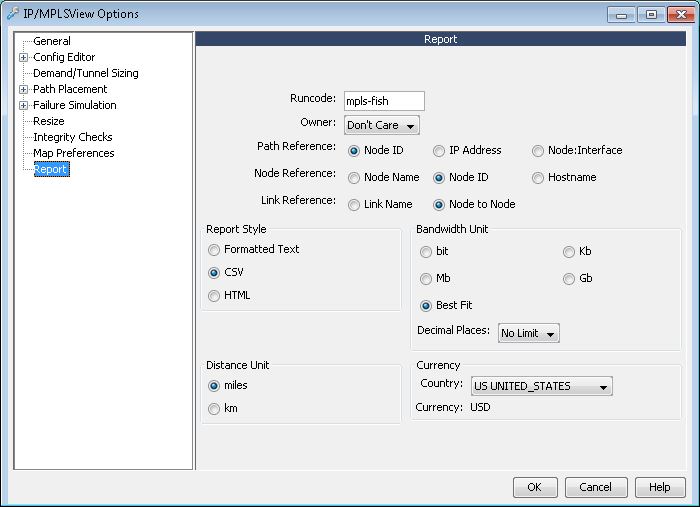
See Report Options for an explanation of additional items.
Advanced Filter Script Utility
The Advanced Filter Script utility allows you to create and then to apply a filtering shell script in the Unix environment on reports that have been generated by the tool. This is a convenient way to produce filtered reports without the need to launch the client. The shell script can also be called by other scripts that are used for automated daily batch report generation, for instance. The following figure, showing the Report Manager’s Path & Diversity Report, is used to illustrate how to use the Advanced Filter Script in the following steps.
In the Report Manager, the Script utility is only available for reports that are in Comma Separated Values (CSV) format, a format that is viewable in many programs such as Microsoft Excel. If you do not see the Script button, select Tools > Options > Report and make sure that the Report Style is set to CSV. Once that is done, go back to the Report Manager, right-click on the report file name you are trying to view and select Re-Generate Report from the popup menu. If CSV format is supported for the report, it will then be re-displayed in a table format.
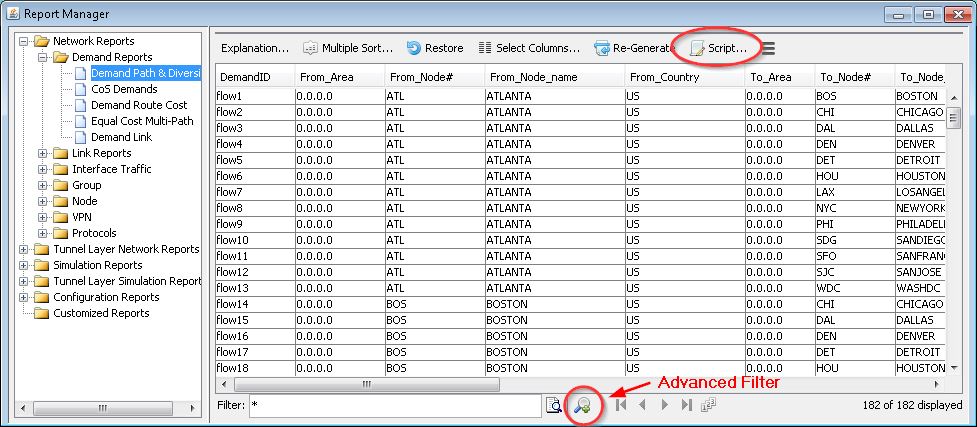
First click on the Advanced Filter button to bring up the Advanced Filter window. Suppose we want to only look at certain demands, such as demands starting from ATL. One way to do this is to use the query, “From_Node# = ATL”.
Click OK to apply the filter.
Figure 5: Define a Query in the Advanced Filter Window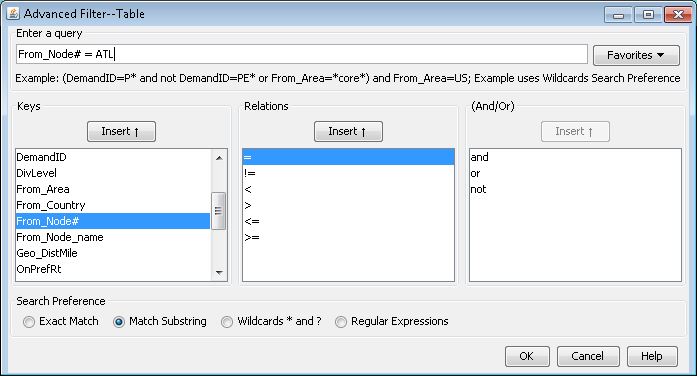
Next, click on the Script button in the Report Manager to bring up the Advanced Filtering Script window, as shown in the following figure. You may change the script file name or the filtered report output file name by editing the Script File Name and Output File Name text boxes, respectively. You can also choose to regenerate the original report in full (in this case, the Path and Diversity Report) before the filter is performed on it. To do so, mark the Generate New Report checkbox. Once you have finished with any changes, click on the Generate button and a shell script is created in the output path. In this example, PATHRPT.mpls-fish.sh is generated.
Note:The Generate New Report option works for most reports. However, it will not regenerate certain reports, such as Simulation and Configuration (Router-only) reports, which are only created once during the corresponding failure simulation, or configuration import operation, respectively.
Figure 6: Advanced Filtering Script window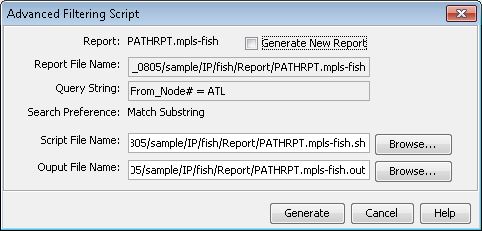
Next, log onto your server and navigate to the output directory. (You can do this via Tools > Connect to Server.) Then, to execute the Advanced Filter shell script, simply type the name of the script file at the command prompt, as shown in the following figure.
Figure 7: Run the Advanced Filter shell script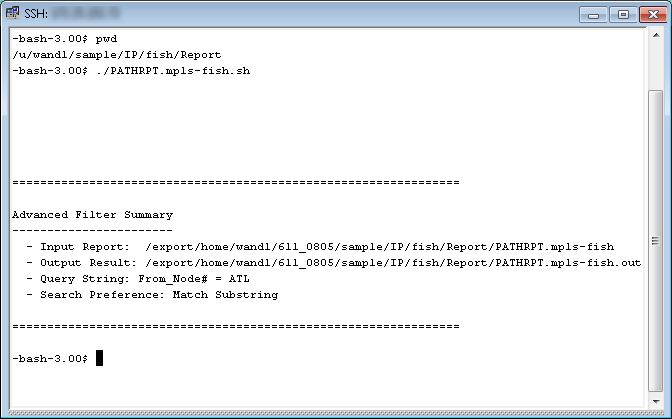
Once the shell script has been run, the filtered report is generated, as indicated by the “Output Result” line as shown in the figure above. The following figure shows the filtered report displayed in the Report Viewer (in the File Manager, right click on the file name and select Open With > Report Viewer.
Figure 8: Filtered Path and Diversity Report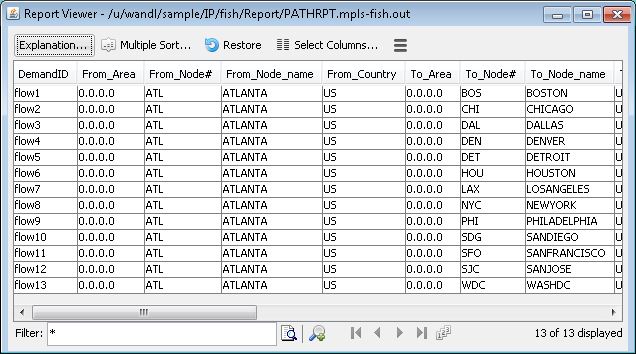
List of Network Reports
Depending on the network type, the Report Manager displays a different set of reports. The following table lists the available reports. Reports marked with (Router) are device-specific reports and will only appear for the corresponding network type. All other reports are general and should appear for all networks.
Demand Reports |
File |
Description |
|---|---|---|
Demand Path & Diversity |
PATHRPT |
Lists details of all user demand requirements in the network. See Demand Reports |
CoS Demands (Router) |
DEMANDCOS |
Displays the worst propagation and queueing delays for each demand. See CoS Demands Report . |
Demand Route Cost |
CKTCOST_RT |
Provides utilization costs according to demand routes. See Demand Route Cost Report . |
Equal Cost Multi-Path (Router) |
EQPATHRPT |
Lists equal cost multiple paths that exist in the network for nodes in the same AS and same OSPF area, and also for inter-area and inter-VPN demands. See Equal Cost Multi-Path Report. |
Demand Link |
DEMAND_LINK |
Displays the demand path through links by interface out and in sequence. |
Link Reports |
File |
Description |
|---|---|---|
Planned Link Utilization |
LKUTIL |
Provides demand bandwidth utilization information for each link in the network. See Link Reports. |
Planned Physical Interface Utilization |
PHYUTIL |
Provides demand bandwidth utilization information for each physical interface in the network. See Planned Physical Interface Utilization. |
Per Node Pair (Measured) |
MEASUREDLKBWRPT |
Shows link utilization by period from the interface ingress and egress traffic files between connecting nodes. |
Measured Link Util (based on trafficload) |
L3LINKUTIL |
Shows the measured traffic by link based on the trafficload file. |
Demand Traffic vs Interface Traffic |
L3LINKUTILCOMPARE |
Shows the comparison between planned and measured traffic. See Demand Traffic Versus Interface Traffic. |
Demand Traffic vs Physical Interface Traffic |
L3PHYUTILCOMPARE |
Shows the comparison between planed and measured traffic on physical interfaces. |
CoS Links* (Router) |
LINKCOS, L2_LINKCOS |
Displays the worst propagation and queueing delays for each CoS class on each link. See CoS Links Report. |
Link Cost |
LKCOST |
Provides detailed link pricing information. |
RSVP Bandwidth Allocation (Router) |
LKPART |
Displays link partitions and their capacity allocation. |
Interface Traffic |
File |
Description |
|---|---|---|
Interface Traffic (Router) |
IntfUtil |
Displays interface load and utilization information. See Interface Traffic Report. |
Interface CoS Traffic (Router) |
INTFCOS |
Displays interface Traffic by Class of Service. |
Interface Multicast Traffic (Router) |
INTFMULTICAST |
Displays interface Multicast Traffic. |
AS Traffic (Router) |
ASTraffic |
Displays traffic information for interfaces at different AS’s. See AS Traffic Report |
Inter-AS Traffic (Router) |
InterASTraffic |
Displays traffic information between different AS’s. See Inter-AS Traffic Report. |
Inbound/Outbound Network Traffic (Router) |
NWKTRAF |
For each node, displays an aggregate outbound and aggregate inbound value, corresponding to the sum of traffic originating and terminating at a node respectively - but only on interfaces that do not correspond to any links in the network model ( for example, customer-facing interfaces, PE-CE interfaces when CE configuration files are missing from the network model). This information is derived from the measured traffic on the interfaces (interface “egress” and “ingress” traffic files in the File > Load Network Files window). One purpose for this file is for use in the Traffic Matrix tool, as described in the NorthStar Planner Feature Guide. |
Group |
File |
Description |
|---|---|---|
Group Demand Summary by Group Pair |
GROUPDEMANDSUMMARY |
Shows summarized information for demands that are requested within a group or between two different groups. |
Group Demand Detail by Group Pair |
GROUPDEMANDDETAIL |
Shows detailed information for demands that are requested within a group or between two different groups. |
Group Demand Traffic on Link Summary |
GROUPLINKSUMMARY |
Shows summarized information for links that exist within a group or between two different groups. |
Group Demand Traffic on Link Detail |
GROUPLINKDETAIL |
Shows detailed information for links that exist within a group or between two different groups. |
Group Interface Load Summary (Router) |
GROUPINTFSUMMARY |
Shows summarized information for interface load of links within a group or between two different groups. |
Group Interface Load Detail (Router) |
GROUPINTFDETAIL |
Shows detailed information for interface load of links within a group or between two different groups. |
Group Demand Bandwidth Distribution |
L3GROUPLOAD |
Shows traffic statistics for groups such as source, destination, transit, and intra-group traffic. |
Node |
File |
Description |
|---|---|---|
Demand Traffic Per Node |
SWITCHCONN |
Shows statistical information on demands that originate, pass through or terminate at each node in the network. |
Measured Interface Traffic Per Node (Router) |
MEASNODELOAD |
Displays up to 24 periods of total incoming and outgoing traffic from each node based on the measured interface traffic data. Note that only interfaces corresponding to links in the network model are considered. |
Node Link Port |
NodeLinkPort |
Displays the number of ports on a node by link type. |
VPN |
File |
Description |
|---|---|---|
VPN Interface Traffic (Router) |
VPNINTFTRAF |
Reports the ingress and egress traffic on VPN interfaces for each traffic load period. |
VPN Interface CoS Traffic (Router) |
VPNINTFCOS |
Reports VPN interface traffic broken down into CoS classes. |
VPN Interface Multicast Traffic (Router) |
VPNINTFMULTICAST |
Reports on the VPN interface multicast traffic load. |
VPN Export-Import (Router) |
VPNEXPORTIMPORT |
Displays the route target export/import relationships that exist between VPNs in the network. |
Layer3 (Router) |
VPNREPORT_LAYER3 |
Displays the details of Layer 3 VPN’s in the network. |
Layer2 Martini (Router) |
VPNREPORT_LAYER2 |
Displays the details of Layer 2 Martini VPN’s in the network. See Layer2 Martini Report . |
Layer2 Kompella* (Router) |
VPNREPORT_L2KOMPELLA |
Displays the details of Layer 2 Kompella VPN’s in the network. See Layer3/Layer2 Kompella Report |
Layer2 CCC (Router) |
VPNREPORT_L2CCC |
Displays the details of Layer 2 circuit cross-connect VPN’s in the network. |
VPLS-LDP |
VPNREPORT_VPLS |
Shows LDP based VPLS information |
VPLS-BGP |
VPNREPORT_VPLS_JUNIPER |
Shows BGP based VPLS information. Juniper Networks only. |
Protocols |
File |
Description |
|---|---|---|
Route Instance (Router) * |
RTINSTRPT |
Reports on Routing Instances for OSPF or IS-IS. For more information, see the NorthStar Planner Feature Guide, Routing Instances chapter. |
Subnet (Router) * |
SUBNETRPT |
Displays all subnets in the network model |
BGP > BGP * (Router) |
BGPRPT |
Also called the BGP Integrity Checks Report. It contains four sections (select Application > Options > Report) including Unbalanced BGP Neighbor Check, IBGP Mesh Connectivity Check, Local/Neighbor AS Specification, and Route Reflector Statistics. See BGP Reports |
OSPF > Inter Area Load Distribution* (Router) |
INTDOMLOAD |
Displays the load distribution between areas in the network |
OSPF > Inter Area Paths* (Router) |
INTDOMPATH |
Displays information regarding paths between two user-specified areas |
OSPF > Area Pass through Paths* (Router) |
DOMPASSTHRU |
Generates information regarding demands passing through an area in the network |
OSPF > OSPF Area Summary* (Router) |
OSPFSUMMARYRPT |
Shows summarized information for each OSPF area See OSPF Area Summary |
OSPF > OSPF Area Detail* (Router) |
OSPFDETAILRPT |
Shows detailed information for all routers in each OSPF area. See OSPF Area Detail Report |
OSPF > ABR Bordering Area* (Router) |
ABRBORDERRPT |
Displays the bordering areas for each ABR. See ABR Bordering Area Report. |
List of Tunnel Layer Network Reports
Tunnel Reports |
File |
Description |
|---|---|---|
Tunnel Path & Diversity |
TUNNELRPT |
Displays details of all tunnels in the network and their paths. . |
Tunnel Route Cost |
L2_CKTCOST_RT |
Provides utilization costs according to tunnel routes. |
Demand Traffic on Tunnel |
TUTIL |
Displays comprehensive tunnel information in the network. See Link Reports. |
Tunnel Traffic |
TUTRAFRPT |
Displays tunnel load and utilization information. |
Tunnel-Link |
TUNNEL_LINK |
Displays information for each interface segment of each tunnel’s path. |
Tunnel Layer Link Reports |
File |
Description |
|---|---|---|
Tunnel RSVP BW on Link |
L2_LKUTIL |
Provides tunnel bandwidth utilization information for each link in the network |
Tunnel RSVP BW on Node Pair |
L2_LKBWRPT |
Provides tunnel bandwidth utilization information for grouped links (links that have the same endpoints) |
Measured Link Util (based on T_trafficload) |
L2_MEASUREDLKUTIL |
Shows tunnel traffic on the link by period from the T_trafficload or tunnel.traffic file for Live networks. |
Tunnel Layer Per Node Pair (Measured) |
L2_MEASUREDLKBWRPT |
Shows tunnel traffic between connecting nodes by period from the T_trafficload or tunnel.traffic file for Live networks. |
Tunnel Traffic vs Interface Traffic |
LINKUTILCOMPARE |
Compares aggregate tunnel traffic load versus the measured interface traffic. |
RSVP Bandwidth Allocation |
L2_LKPART |
Displays partitions of the link bandwidth (RSVP and GB=Guaranteed Bandwidth, GlobalPool and SubPool, or CT partitions for DiffServ-TE) and shows the tunnel bandwidth for each partition. |
Tunnel Layer Group |
File |
Description |
|---|---|---|
Group Tunnel Summary by Group Pair |
GROUPTUNNELSUMMARY |
Shows summarized information for tunnels that are requested within a group or between two different groups. |
Group Tunnel Detail by Group Pair |
GROUPTUNNELDETAIL |
Shows detailed information for tunnels that are requested within a group or between two different groups. |
Group Tunnel Bandwidth Distribution |
GROUPLOAD |
Shows total ingress, egress, and transit tunnel traffic through the groups. |
Node |
File |
Description |
|---|---|---|
Planned Tunnel RSVP BW Per Node |
TUNNELSTAT |
Shows statistical information on tunnels that originate, pass through or terminate at each node in the network. |
Measured Tunnel Traffic Per Node |
L2_MEASNODELOAD |
Shows ingress and egress tunnel traffic tunnel traffic through the nodes. |
List of Simulation Reports
All simulation reports are pre-generated. That is, they are generated after performing the associated simulation script. The Report Manager provides a quick, organized way of accessing these reports, though the reports can also be opened directly via the File Manager.
Simulation Report Icons
Because the Simulation Reports are pre-generated, at the time a simulation report is viewed, it may not accurately correlate with the current state of the network. For example, in the interim you may have modified the network, adding or removing network elements like nodes, links or demands. Special icons are used to quickly allow you to distinguish newer reports from older reports that may be out of date:
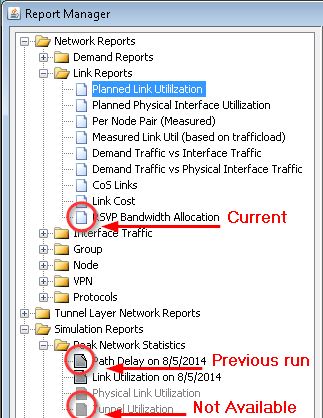
Faded Gray: Indicates that the report is not available. The associated simulation script has not yet been run.
White: Indicates that the report was generated during the current network session. This does not guarantee that the report reflects the current state of the network model. It is just an indicator that the report is relatively new.
Dark Gray: Indicates that the report was generated during a previous network session.
Associated Simulation Scripts
The following table lists the simulation script corresponding to each report. The scripts are accessed from the main menu Simulation > Simulation Scenarios. For more detail about the variety of simulations, see Report Manager: Simulation Reports.
Report |
File |
Associated Simulation |
|---|---|---|
Peak Link Util |
DVSIM |
Displays link and bandwidth information under normal and peak conditions obtained from failure simulation runs |
Interactive Failure |
SIMRPT |
Tools > Options > Failure Simulation; In Failure Report Tab, ensure that the “Yes” checkbox for Trace File is marked. Then, perform an interactive failure sequence by failing nodes/links via the map right-click menus or via Simulation > Interactive Scenarios. Run or Step through the simulation. See Interactive Failure (SIMRPT) Reports. |
Exhaustive Failure |
PeakSimSummary PinkSimLink PeakSimRoute |
Simulation > Simulation Scenarios |
Daily Sequence |
DAILYSEQ |
This file is generated when a Random Daily Failure simulation is run. To perform this simulation, select Simulation > Simulation Scenarios, select Multiple Failures, select Double or Triple failure, and enter in a number of Cases to Simulate.
|
Path Delay Information |
PATHDELAY |
This report is generated with almost every simulation script that you run. It indicates the worst path delay experienced by each demand, as well as the failure event that caused the worst-case scenario. Note that the report is overwritten each time. |
Up-Down Sequence |
UPDOWN |
Under Simulation > Simulation Scenarios, select Generate Up-Down Sequence for use in Upper Layer option in addition to the simulation script to be run. |
Shared Risk Link Groups |
SRLG |
This file is generated during an Up-Down Sequence simulation, for use in Upper Layer. It basically creates a facility file that groups the failed demands corresponding to each network element failure just simulated in the current layer. These demands correspond to links in a higher network layer, where you can proceed to run an Exhaustive Facility Failure. In this way, you can see the impact of the network failure at a higher network level. |
Replay Up-Down Sequence |
REPFAIL |
Under Simulation > Simulation Scenarios > Advanced Options, select Replay Up-Down Sequence, then specify the up-down sequence file. The DAILYSEQ file generated from Random Daily Failure can be used here. |
List of Configuration Reports (Router Only)
All configuration reports are “pre-generated”. That is, they are generated after you import configuration files into the network model by selecting File > Import Data. The Report Manager provides a quick, organized way of accessing these reports, though the reports can also be opened directly from the File Manager.
For more information on configuration import, see the router data extraction chapter of the NorthStar Planner Feature Guide.
Report |
File |
Description |
|---|---|---|
Integrity Checks |
configLog |
Displays detailed integrity checks. See Report Manager: Configuration Reports. |
Integrity Checks Summary |
Integrity_Summary_rpt |
Displays a summary of the integrity checks. This report can also be accessed directly by pressing the Stethoscope icon on the main menu bar. |
ISIS Config |
ISISReport |
Displays the details of IS-IS configuration. See ISIS Reports. |
OSPF Config |
OSPFReport |
Displays the details of OSPF configuration |
CoS Config |
ConfigCoS |
Displays the details of CoS configuration |
Config Files Status |
ConfigFileStatus |
Displays the file properties of collected configuration files. |
VLAN Detail |
VLANReport |
Displays details of the VLAN’s collected from switches via SNMP. |
Duplicated IP Address |
ConfigDuplicateAddress |
Displays duplicate IP address(es) found in the configuration files. |
Node Discovery |
BridgeVLAN ConfigCoS ConfigElementDiscovery ConfigFileStatus ConfigIntegrityChecks ConfigIntegrityChecksSummary ConfigISIS ConfigOSPF |
Displays the names of devices (nodes) added to or removed from the network after completion of a Scheduling Live Data Collection task or Network Config Data Collection task. To generate the Node Discovery report, NorthStar Planner compares the device differences between the previous network and the current network, and lists any devices that have been added or removed. |
Customized Reports
The customized reports feature allows you to create a customized report by selecting certain columns of interest from an existing Node, Link, Interface, Demand, and Tunnel report.
To create a customized report, right-click over Customized Reports in the Report Manager and choose Add a new Report from the menu.
Figure 10: Adding a New Customized Report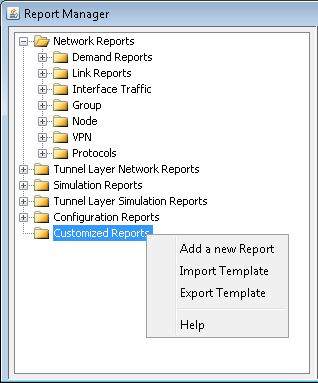
The Customized Report Editor Wizard then appears, as shown in the following figure. Click Next to continue.
Figure 11: Customized Report Wizard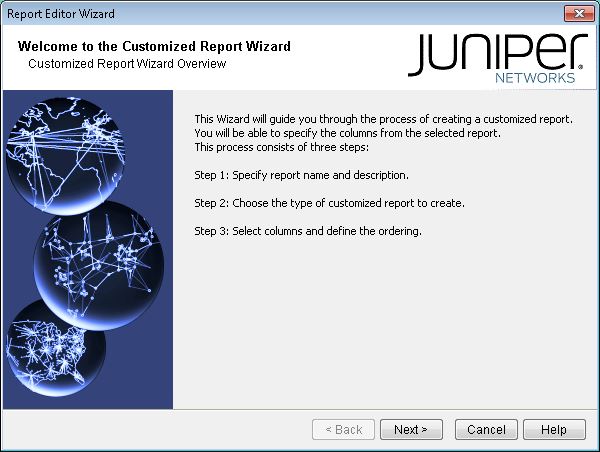
Specify the report name, file name, and a description, and click Next to continue.
Figure 12: Define Report Name, File Name, and Description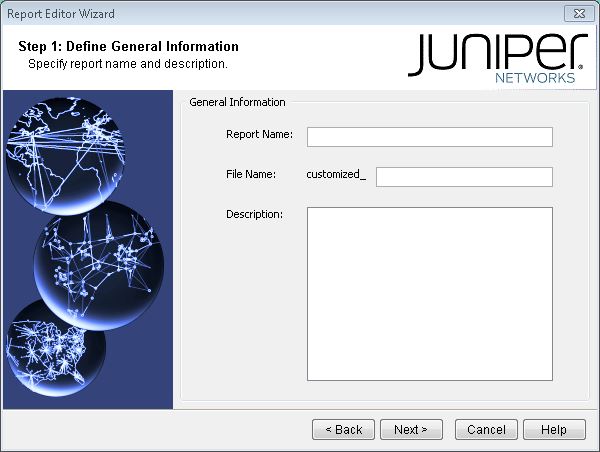
Choose the type of report from which to derive a customized report. After choosing the report type, click Next to continue.
Figure 13: Choose the Report Type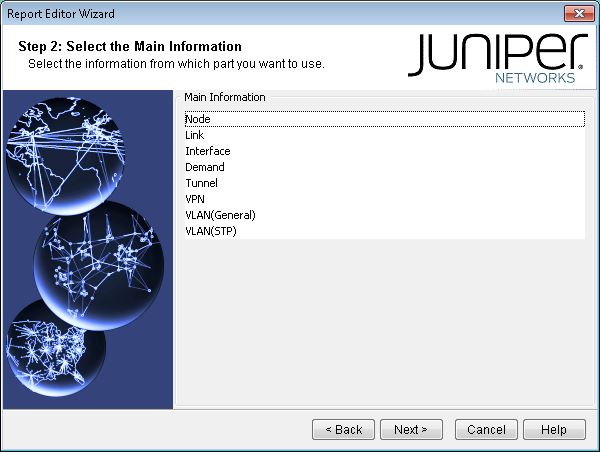
Select the columns of interest for the customized report by highlighting rows from the Available Columns list and clicking on the -> button. For each column selected for the customized report, you may choose a new name for an existing column name by clicking on the text box in the New name column and typing in a new string.
Figure 14: Choose Columns of Interest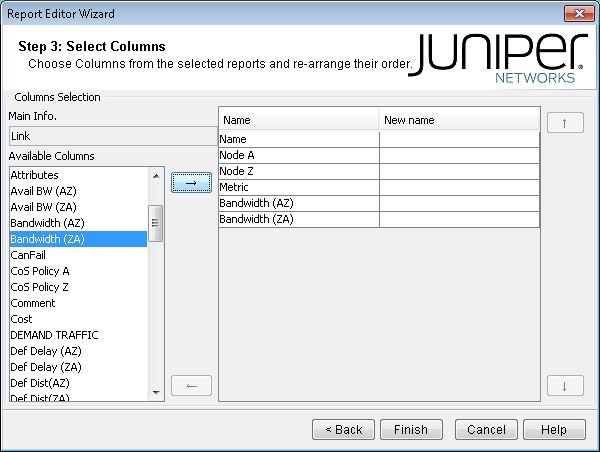
Click on Finish to create the customized report, which is placed into the Customized Reports folder.
Figure 15: A Customized Report Derived from the Link Report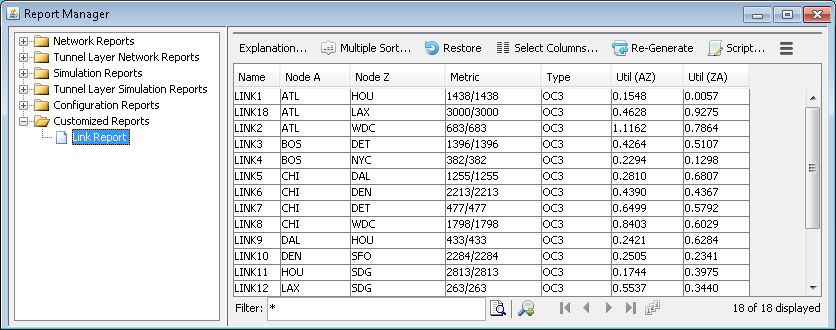
After a customized report has been created, you may export it as a template. This template may then be imported by a different network spec, and the same customized report could be generated for that network.
Figure 16: Exporting/Importing a Customized Report Template