Traffic Load by Policy Class
Bar charts are used to view the traffic load on a link in more detail.
Click on Network > Elements > Links. Righ-click a link in the list and select Traffic Chart > Demand Traffic Load by CoS from the popup menu. Alternatively, you may also right-click on a link on the topology map and select Traffic Load > Demand Traffic Load by CoS from the popup menu.
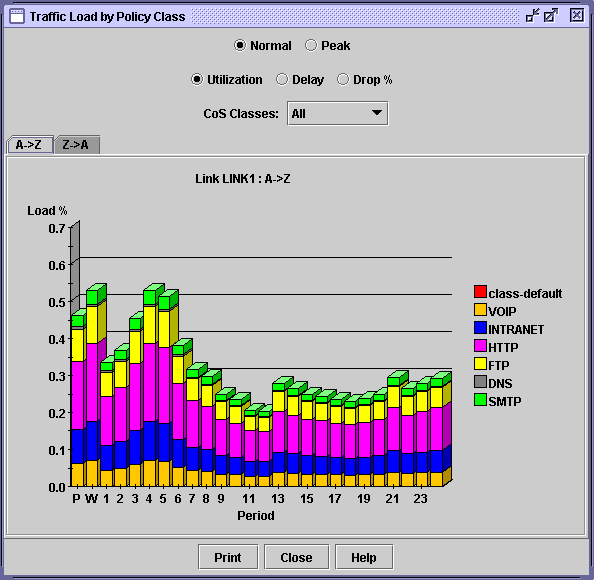
Following is an example of a traffic load chart according to CoS class. The interface utilization is provided for 24 periods. The “Planned” bar reports the interface utilization calculated based on the bandwidths specified in the demand file. The “Worst” bar displays the highest load experienced during the 24 periods. The interface utilization for periods 1 through 24 are derived from routing the demand traffic in the traffic load file, described in further detail in Traffic Load File.

You may view the traffic load by normal or peak, utilization or delay or drop percentage, and by CoS classes. There is also a tab to view the load in the A to Z direction or the Z to A direction on the link.
Holding the mouse over a bar brings up a tool tip with more detail of the traffic load breakdown for that particular period.
