Report Manager: Network Reports
The following sections describe the types of network reports that are available:
Demand Reports
Demand Path & Diversity Report
The Demand Path & Diversity Report lists all user demand requirements in the network, with demand ID, origination, destination, bandwidth, type, priority, preempt priority, path routing, and distance metrics. The output file that is written to the output directory is called “PATHRPT.runcode”.
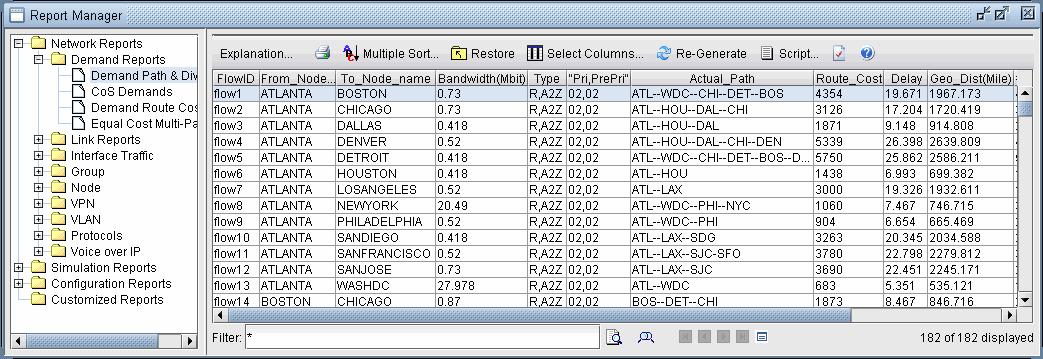
Field |
Description |
|---|---|
FlowID/PVCID |
The ID of the demand. (Column name varies with hardware modules.) |
From_Node_Name |
The full name of the origination node of the demand. |
From_Domain/From_Area |
The domain at which the demand originates, if any. |
From_Node# |
The ID of the origination node of the demand. |
From_Country |
The country in which the origination node resides. |
Card |
The name of the card which the demand is connected to; the card slot position that the demand/flow uses. |
Port |
The port number of the card which the demand is connected to; the port associated with the card the demand/flow uses |
To_Node_Name |
The full name of the destination node of the demand. |
To_Domain/To_Area |
The domain at which the demand is destined for, if any. |
To_Node# |
The ID of the destination node of the demand. |
To_Country |
The country in which the destination node resides. |
Card |
The name of the card which the demand is connected to; the card slot position that the demand/flow uses |
Port |
The port number of the card which the demand is connected to; the port associated with the card the demand/flow uses |
Bandwidth |
The amount of bandwidth allocated to the selected demand. |
Type |
The type of the demand, whether it is a data demand (R) or voice demand (V), and the direction of the demand (A-Z, Z-A). |
Terrestrial |
The demand's preference for terrestrial media. Valid entries include: Don't Care, Required, Prefer, Prefer Not, and Avoid. Note that this parameter is used in route biasing and may not actually reflect true media characteristics. |
Fiber |
The demand's preference for fiber media. Valid entries include: Don't Care, Required, Prefer, Prefer Not, and Avoid. Note that this parameter is used in route biasing and may not actually reflect true media characteristics. |
Encrypted |
The demand's preference for encryption media. Valid entries include: Don't Care, Required, Prefer, Prefer Not, and Avoid. Note that this parameter is used in route biasing and may not actually reflect true media characteristics. |
Pri, PrePri |
The priority field of the demand specification consists of two numbers separated by a comma (,), or a forward-slash (/). The first number defines the call priority of the demand, and the second number the preempt priority of the demand. The preempt priority should be at the same or lower priority as the call priority of the demand. It is assumed that this demand can bump any of the demand with call priority lower than the preempt priority. |
Actual_Path |
The current path (routing) of the demand. |
Route_Cost |
This field displays the sum of the metrics (administrative weights) of the links that the demand traverses. For asymmetric demands, two separate rows are used to show the metric, one for each direction. Note that the default metric of a link depends upon the routing method set in the Tools > Options > Design window, Design>Path Placement options pane. |
Delay |
When the program performs path placement and is trying to find the best route for a call, delay metrics are examined to determine the desirability/undesirability of a link. Two delay metrics are supported, one for each direction of the trunk. If asymmetric delay metrics are not supported by the hardware, the second delay is marked as '-'. If a delay metric is not defined for a trunk, a default delay is calculated based on propagation delay and serialization delay. |
Geo_Dist(Mile) |
Specifies the sum of the actual mileage distance of links in the current path. |
#Hop |
Specifies the total number of hops of the current path. |
OnPrefRt/Path_Violation |
Specifies if the demand could not be routed on the specified path. |
Media_Error |
Specifies if the demand could not be routed on the specified media (terrestrial, fiber, encrypted). |
Comment |
Any user-specified comments. |
DivLevel/DivGroup |
Group name for demands that are to be diverse from each other. |
CoS Demands Report
The CoS Demands Report provides information on interface load and queueing delays for the demands of the selected CoS class in the network. See the NorthStar Planner Feature Guide for details on the Class of Service feature.
The output file that is written to the output directory is called “DEMANDCOS.runcode”.
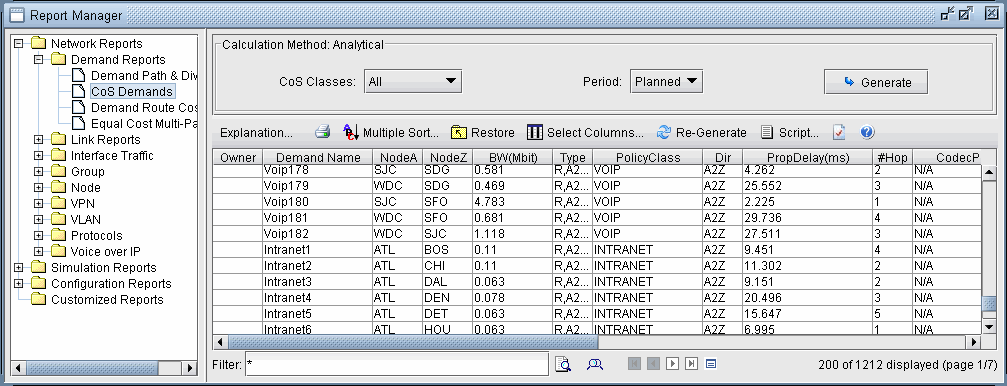
Normal or Peak: Normal traffic means the network does not experience any failure/outages. Peak means that failure simulation reports are going to be used.
CoS Classes: Select all or one specific class of traffic. Reports can be issued for all classes of traffic or for a particular one (for example, the priority class).
Period: Select planned, worst, all, or a specific time period (from traffic load files). Planned means the report is generated using the interface load calculated based on the demand file values. Worst means that the report is generated using the interface load calculated based on the worst traffic load.
Field |
Description |
|---|---|
DemandName |
The name of the demand. |
NodeA |
The originating node of the demand. |
NodeZ |
The terminating node of the demand. |
BW |
The bandwidth of the demand. |
Type |
The type of the demand, whether it is a data demand (R) or voice demand (V), and the direction of the demand (A-Z, Z-A). |
Policy Class |
The policy class to which the demand belongs. |
Dir |
The direction of the demand: A2Z, Z2A. |
PropDelay(ms) |
The sum of node delay and link propagation delay for nodes and links in the path. Delay at the first node is not included. |
#Hop |
Specifies the total number of hops of the current path. |
CodecPktDelay |
Specifies the Codec Packet Delay |
Planned Load |
The bandwidth defined in the demand’s bandwidth field. The amount of bandwidth planned for this demand. |
Planned QDelay(ms) |
The queueing delay based on the planned load and CoS policies. |
Planned DropBW |
The planned drop bandwidth for this demand |
Planned Jitter |
The jitter as defined by the standard deviation of the total path delay. |
Worst Load |
The highest bandwidth among the load in all the traffic periods. |
Worst QDelay |
The highest queueing delay value among all the traffic periods. |
Worst DropBW |
The highest dropped bandwidth among all the traffic periods. |
1, 2, ... Load |
The bandwidth of the demand in the specified time period. |
1, 2, ... QDelay |
The queueing delay in the specified time period. |
1, 2, ... DropBW |
The dropped bandwidth in the specified time period. |
Demand Route Cost Report
The Demand Route Cost Report provides cost information for each demand based on the demand’s route. Each entry is a demand in the network. The report specifies details of each demand, its total cost, and the breakdown of the cost by each link that it passes through.
The output file that is written to the output directory is called “CKTCOST_RT.runcode”.

##############################################################
# COST REPORT FOR DEMANDS File=CKTCOST_RT.x
##############################################################
##
# Currency= DL(American Dollar), DistUnit=mile
Ratedir = /u/wandl/db/rates/default
# Calculation Method: utilization cost according to demand routes
# i.e. Demand cost = Sum of (bandwidth/link_cap)*(link cost)
# for links in the path
#
Equal Cost Multi-Path Report
The Equal Cost Multi-Path Report displays all the equal cost multiple-paths in the network. It lists each set of equal cost paths, displaying the originating and destinating nodes, and the hop-by-hop paths. See the NorthStar Planner Feature Guide for details on the ECMP feature. The output file that is written to the output directory is called “EQPATHRPT.runcode”.
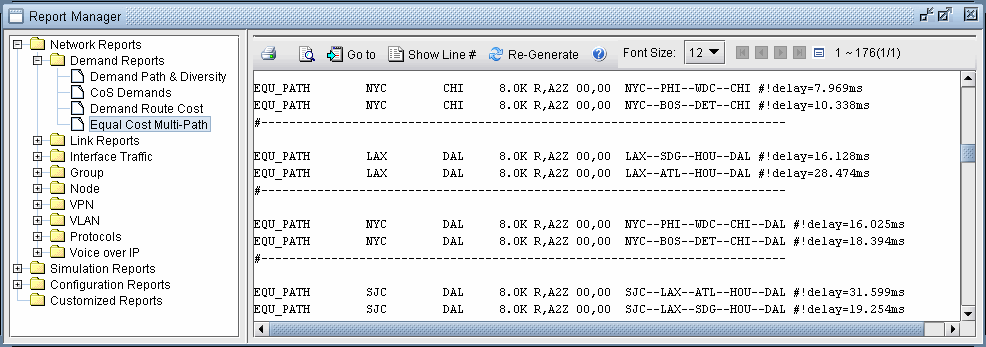
ECMP paths are calculated based on IGP routing, but the actual path placement will also take into consideration MPLS Traffic Engineering Tunnels.
* Notations:
* & : Same site
* - : Intra-LATA or Intra-Country
* -- : Inter-LATA or Inter-Country
* = : Intra-LATA or Intra-Country, Second vendor or linktype
* == : Inter-LATA or Inter-Country, Second vendor or linktype.
* @ : Intra-LATA or Intra-Country, Inter-domain
* @@ : Inter-LATA or Inter-country, Inter-domain
* -*- : Link missing or not enough bandwidth
Link Reports
Planned Link Utilization Report
The Planned Utilization Report lists comprehensive link and bandwidth information for the network. The output file that is written to the output directory is called “LKUTIL.runcode”.
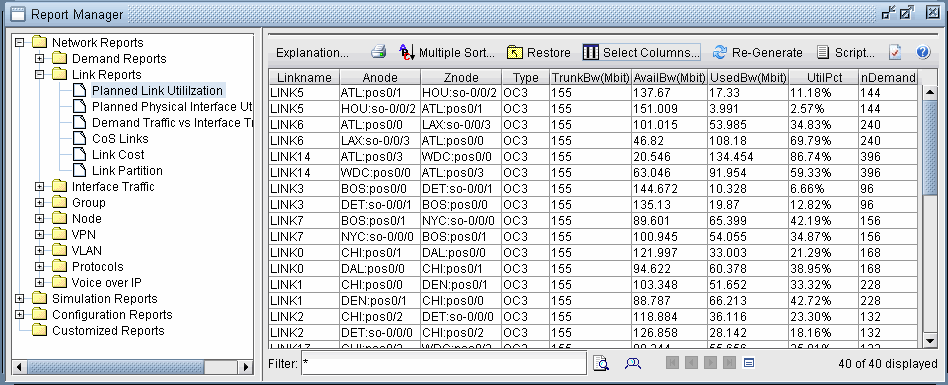
Field |
Description |
|---|---|
Linkname |
The name of the link. |
dir |
The direction of the link. |
Anode |
The origination node of the link. |
Znode |
The destination node of the link. |
Type |
The type of trunk being used. The trunk type is subsequently used in determining link pricing and bandwidth availability. |
TrunkBw |
The total bandwidth of the link from nodes A to Z. This is also the sum of the AvailBW, UsedBW and Ovhd values. |
AvailBW |
The available amount of unutilized bandwidth between nodes A and Z. |
UsedBW |
The amount of bandwidth actually used by the demand requirements between nodes A and Z. |
Ovhd |
The amount of reserved bandwidth for overhead. (TotalBw = AvailBw + UsedBw + Ovhd) |
UtilPct |
The utilization of this link calculated by (UsedBW+Ovhd)/TotalBW. |
nDemand/ncall |
The number of demands routed on or through the link. |
Planned Physical Interface Utilization
The Planned Physical Interface Utilization Report provides utilization statistics for each physical interface in the network. The output file that is written to the output directory is called “PHYUTIL.runcode”.

Demand Traffic Versus Interface Traffic
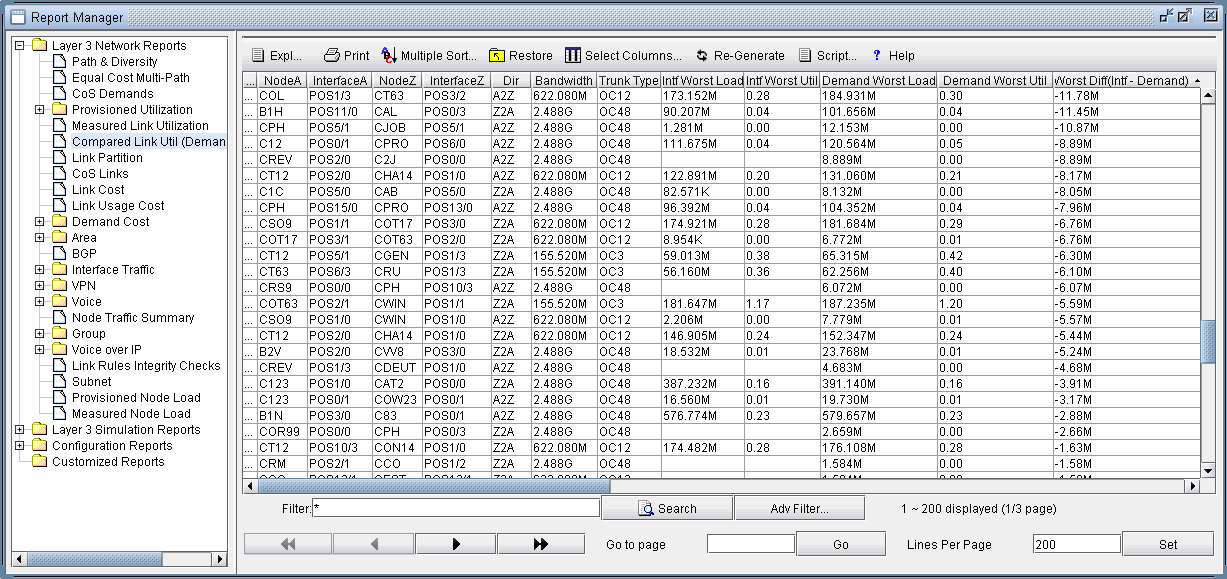
The Demand Traffic vs Interface Traffic report merges together the Measured Link Utilization and the Interface Traffic reports and compares them.
In Layer 3, the Compared Link Utilization report is used to compare the link utilizations computed from the traffic load versus that computed from the interface traffic. For each of the 24 periods, the difference between the link utilization computed from the interface traffic and from the traffic load is calculated and displayed in the Diff (intf - Demand) columns for each period and for the worst period and the average of the periods.
In Layer 2, the Compared Link Utilization report is used to compare the link utilizations computed from the tunnel traffic load versus that computed from the interface traffic.
CoS Links Report
The CoS Links Report provides information on interface load and queueing delays for links of the selected CoS class(es). See the NorthStar Planner Feature Guide for details on this feature. The output file that is written to the output directory is called “LINKCOS.runcode”.
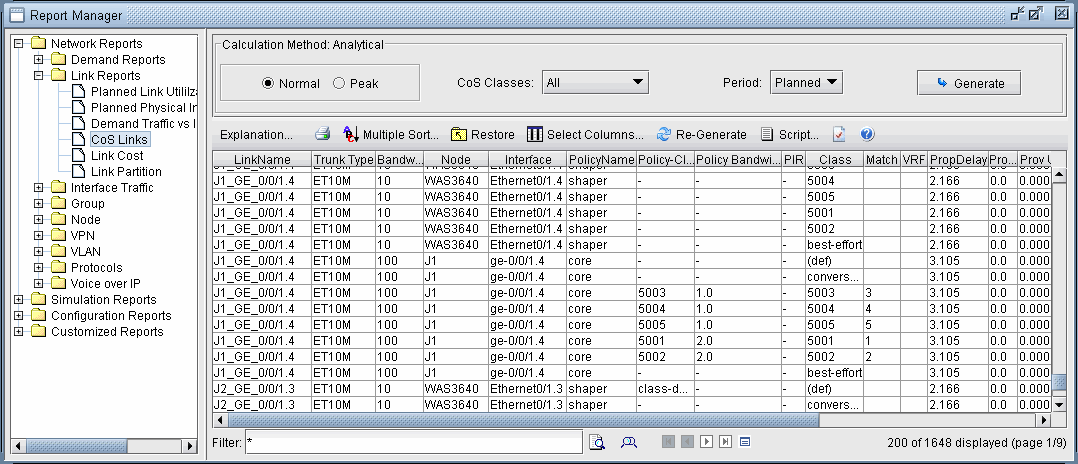
Normal or Peak: Normal traffic means the network does not experience any failure/outages. Peak means that failure simulation reports are going to be used.
CoS Classes: Select all or one specific class of traffic. Reports can be issued for all Classes of Traffic or for a particular one (for example, the Priority class)
Period: Select planned, worst, all, or a specific time period (from interface load files). Planned means the report is generated using the interface load calculated based on the demand file values. Worst means that the report is generated using the interface load calculated based on the worst traffic load.
Field |
Description |
|---|---|
LinkName |
The name of the link. |
TrunkType |
The type of the link, for example, OC3 or STM1 |
Bandwidth |
The bandwidth of the link. |
Node |
One of the link’s endpoints. This specifies the direction of traffic described in this row. |
Interface |
The interface on the node that the link is connected to. |
Policy Name |
The CoS policy specified for the link. |
Policy-Class |
The CoS class of traffic. |
Policy Bandwidth |
Bandwidth reserved for the policy class. |
PIR |
The Peak Information Rate |
Class |
The class name used in demands' CoS definition. |
Match |
The "IP precedence" or "MPLS EXP bits" used as matching conditions for the specified class. |
PropDelay |
The propagation delay on the link. |
Planned Load |
The amount of bandwidth planned for demands on the link. |
Planned Util |
Percentage of the trunk bandwidth that is used. |
Planned PolicyUtil |
Percentage of the bandwidth reserved for the policy class that is used. |
Planned QDelay(ms) |
The queueing delay on the link. |
Planned DropBW |
The dropped bandwidth planned on this link. |
Planned Jitter |
The standard deviation of the total path delay. |
Worst Load |
The highest bandwidth among the load in all the traffic periods. |
Worst QDelay |
The highest queueing delay value among all the traffic periods. |
Worst DropBW |
The highest dropped bandwidth among all the traffic periods. |
1, 2, ... Load |
The load of the link in the specified time period. |
1, 2, ... QDelay |
The queueing delay in the specified time period. |
1, 2, ... DropBW |
The dropped bandwidth in the specified time period. |
Link Cost Report
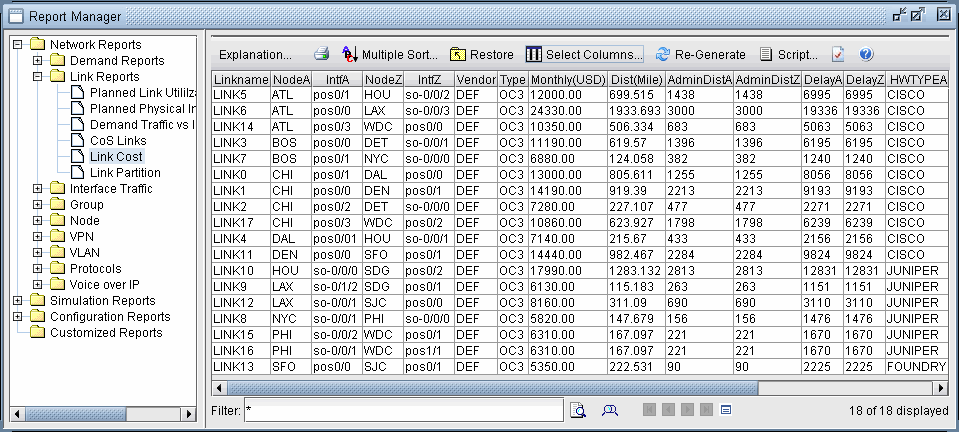
The Link Cost Report provides detailed link pricing information. Each link in the network is listed by its source and destination nodes, Vendor, Type, Monthly Cost, and Non-Recurring Charge. Link grouping is done by LEC and IXC vendor.
The output file that is written to the output directory is called “LKCOST.runcode”.
******************************************************************
*
* Backbone Link Configuration and Pricing Report -- runcode=x
*
******************************************************************
*
Remark 1: vendor/cost marked with * are default specified in usercost file
Remark 2: vendor/cost marked with # are default specified in bblink file
Remark 3: cost marked with @ are calculated from usercountrycost file
Remark 4: cost marked with ^ are estimated from default specified in usercost
file
Special characters (such as #, *, @, ^) appended to a vendor or cost value is used to indicate how the pricing was calculated. For example, a vendor or cost value marked with a '#' means that default values specified in the bblink file were used. Press the Exp button in the report window for an explanation.
If the report is saved in CSV format or is viewed through the NorthStar Planner client, there are question marks ('??') in the Monthly and NRC columns indicating that pricing for this link cannot be determined. This usually occurs if the service type is not supported in the tariff database. In this case, you can:
Specify the desired link cost directly in the bblink file, or
Use the usercost file to define the default vendor and cost for various service types between particular node pairs.
Use the custrate file to create pricing tables between defined classes of nodes. Note that this the custrate feature is an unbundled add-on feature.
Field |
Description |
|---|---|
Linkname |
Identifier of the link |
CntryA/NXX |
The NPA/NXX location of where the link originates. |
NodeA |
The name of the node where the link originates. |
CardA |
Any information regarding the card found at the origin node of the link. |
InterfaceA |
The name of the interface at the orign node of the link. |
CntryZ/NXX |
The NPA/NXX location of the destination of the link. |
NodeZ |
The name of the destination node where the link terminates. |
CardZ |
Any information regarding the card found at the destination node of the link. |
InterfaceZ |
The name of the interface at the destination node of the link. |
Vendor |
The vendor associated with this link. Possible values for vendors include those that are specific to a certain country or region, and are listed in the tariff database. If a vendor is not specified, this value is set to the default value DEF. |
# |
The number of links from node A to node Z. |
Type |
The type of link being used. The link type is used in determining link pricing and bandwidth availability. |
Monthly |
Link/circuit cost expressed a a monthly billed amount. |
NRC |
Non-Recurring Charge also known as installation charge. |
Dist (mile) |
The distance between the two nodes (in miles). |
AdminDist |
The administrative weight or distance of the link. AdminDistA for A-Z direction; AdminDistZ for Z-A direction. |
Delay |
The delay of the link in each direction. DelayA=delay for A-Z; DelayZ=delay for Z-A. |
CLASS |
The custom rate class that the nodes belong to. CLASSA=class for node A; CLASSZ=class for node Z. |
SITE |
The site that the nodes belong to. SITEA=site for node A; SITEZ=site for node Z. |
HWTYPE |
The hardware type of the nodes. HWTYPEA=hw type for node A; HWTYPEZ=hw type for node Z. |
RSVP Bandwidth Allocation Report
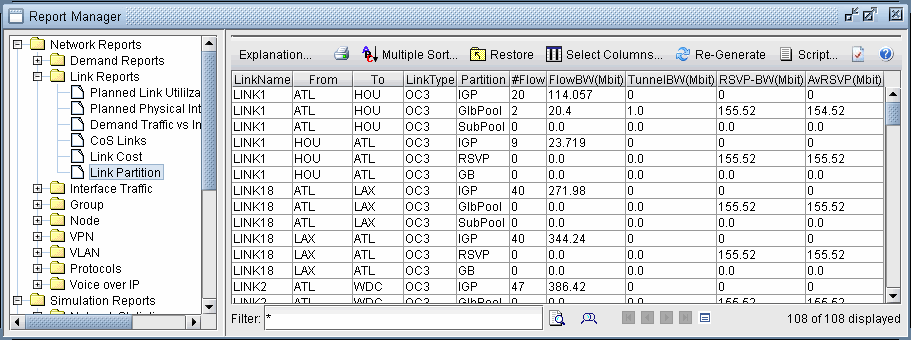
The RSVP Bandwidth Allocation Report displays detailed link partition information for each link in the network. This report displays the same detailed information in the capacity tab menu of the Links window found in the Network menu.
The output file that is written to the output directory is called “LKPART.runcode”.
Measured Link Utilization Report
The Measured Link Utilization report displays the computed link utilization based on the routed traffic load in the network. For live network models, this report can be viewed after opening the live network and switching to Offline mode.
In Layer 3, the traffic load could be either the measured end-to-end traffic load, which can be read in as a trafficload file in the Load Network Files window, or the end-to-end demands. If a trafficload file is read in, then up to 24 periods of traffic data could be available. For each period, load and utilization information are displayed in two columns. Worst and average statistics are also shown (for example, Average Load and Average Util columns).
In Layer 2, the link utilization is based on the tunnel traffic load in the network. The tunnel traffic load can be read in as a t_trafficload file in the Load Network Files window.

Interface Traffic Reports
The Interface Traffic Reports detail the measured traffic on each link over a set of time periods, if data is provided. In order to access these reports, traffic should have first been collected (either using the offline traffic collection features in NorthStar Planner or other traffic sources) and imported into the software using the offline traffic import feature. For more on Offline Traffic Import, see the NorthStar Planner Feature Guide.
Processed interface traffic data is saved in a file that is referenced by the specification file in the lines, “interfaceLoad_out” (egress traffic) and “interfaceLoad_in” (ingress traffic). The Interface Traffic Report, AS Traffic Report and Inter-AS Traffic Report are derived from these files. Up to 24 periods of traffic data could be available. For each period, load and utilization information are displayed in two columns. Worst and average statistics are also shown (for example, Average Load and Average Util columns). The report is the same in Layer 3 as in Layer 2.
If the outgoing traffic measurements cannot be found (going out from Node A to Node B) in the egress traffic file, then NorthStar Planner will use the numbers from the ingress traffic file (going into Node B from Node A) if available.

Interface Traffic Report
The Interface Traffic Report is generated when you perform an offline traffic import.
Field |
Description |
|---|---|
LinkName |
The name of the link. |
NodeA/Z |
The source (A) and destination (Z) endpoints of the link. |
InterfaceA/Z |
The originating (A) and terminating (Z) interfaces on Node A and Z respectively. |
Bandwidth |
The total bandwidth of the link. |
Trunk Type |
The link type (for example, T1, OC3, ATM10M) |
Worst Load |
The worst load experienced over all time periods.* |
Worst Util |
The link utilization correlating to the Worst Load. |
Average Load |
The average of the loads experienced over all time periods.* |
Average Util |
The link utilization correlating to the Average Load. |
period1...n |
The load experienced during period1, period2, ... periodn.* |
Util(%) |
The link utilization correlating to the load measured each period. There should be a “Util(%)” column immediately after each “period” column. |
To determine the units (for example, Kbps), press the Explanation button at the top of the report.
AS Traffic Report
The Autonomous System (AS) Traffic Report details the traffic measured over links whose endpoints are located in two different ASs.
Field |
Description |
|---|---|
AS1 |
The AS number of the source AS for the link. |
nodeID1 |
The node ID of the source node of the link. |
interface1 |
The link interface at the source node. |
AS2 |
The AS number of the destination AS for the link. |
nodeID2 |
The node ID of the destination node of the link. |
interface2 |
The link interface at the destination node. |
bandwidth |
The bandwidth of the link. |
Average-in |
The average incoming traffic measured on the link in the AS2->AS1 direction. |
Average-out |
The average outgoing traffic measured on the link in the AS1->AS2 direction. |
Inter-AS Traffic Report
The Inter-AS Traffic Report details the aggregated average traffic measured on all links between two different Autonomous Systems (AS).
Field |
Description |
|---|---|
AS1 |
The AS number of the source AS. |
AS2 |
The AS number of the destination AS. |
AS1 Name |
The AS name corresponding to AS1. By default, the AS names are derived from the file, $WANDL_HOME/db/misc/ASNames. |
AS2 Name |
The AS name corresponding to AS2. |
Total BW |
The Total Bandwidth of all links between these two ASs. |
Average-in |
The average traffic load measured on all links between AS1 and AS2 in the AS2->AS1 direction. |
Average-out |
The average traffic load measured on all links between AS1 and AS2 in the AS1->AS2 direction. |
Inbound/Outbound Network Traffic
This report displays an aggregate outbound and aggregate inbound value for each node, corresponding to the sum of traffic originating and terminating at a node respectively - but only on interfaces that do not correspond to any links in the network model (for example, customer-facing interfaces, PE-CE interfaces when CE configuration files are missing from the network model). This information is derived from the measured traffic on the interfaces (interface “egress” and “ingress” traffic files in the File > Load Network Files window).
One purpose for this file is for use in the Traffic Matrix tool, as described in the NorthStar Planner Feature Guide.

Group Reports
This set of group reports in the Report Manager displays information about groups in the network model. This information includes link and demand summaries and details within and between groups. When you have categorized nodes into groups, these reports show the amount of links and traffic that exists within a certain group or between two different groups. After a failure simulation run, you can also choose to view network group information in peak conditions.
These reports can be generated in Layer 2 of an IP/MPLS network regarding tunnel information between groups, as well as in an ATM network containing PNNI groups. To view information between PNNI groups, select this option in the Group Type selection box.
Group Demand Summary by Group Pair Report

The output file that is written to the output directory is called “GROUPDEMANDSUMMARY.runcode”.
Normal, Peak: Select Normal to display network information under normal conditions. After having run a failure simulation, selecting “Peak” will show peak utilization information.
Group Type: The default selection is user-defined groups. If this network contains PNNI groups, then the selection box will also allow you to choose PNNI groups for viewing.
Period: Based on the traffic load file, the report can display traffic load information in the selected time period(s).
Field |
Description |
|---|---|
Group A, Z |
This row contains summarized information for demands that originate at group A and terminate at group Z. |
# Demand |
The total number of requested demands (placed and unplaced) from group A to group Z. |
BW |
The sum of the demands’ bandwidth. |
WorstLd |
The sum of the traffic load for these demands in the worst case out of all the time periods. (Data taken from traffic load file.) |
WorstLd/BW |
The ratio of worst load and the sum of the demands’ bandwidth. |
P_01, P_02, ... |
The sum of the traffic load for these demands in period 1 (P_01), period 2 (P_02), etc. (Data taken from traffic load file.) |
Group Demand Detail by Group Detail Report
The output file that is written to the output directory is called GROUPDEMANDDETAIL.runcode.
Normal, Peak: Select Normal to display network information under normal conditions. After having run a failure simulation, select Peak to show peak utilization information.
Group Type: The default selection is user-defined groups. If this network contains PNNI groups, then the selection box also allows you to choose PNNI groups for viewing.
Period: Based on the traffic load file, the report can display traffic load information in the selected time period(s).
Field |
Description |
|---|---|
Node A, Z |
This row describes a demand that originates at node A and terminates at node Z. |
Group A, Z |
Group A is the group in which node A resides. Group Z is the group in which node Z resides. |
BW |
The bandwidth of the demand. |
WorstLd |
The worst load of this demand out of all the time periods. (Data taken from traffic load file.) |
WorstLd/BW |
The ratio of worst load and the bandwidth of the demand. |
P_01, P_02, ... |
The load of this demand from node A to node Z in period 1 (P_01), period 2 (P_02), etc. (Data taken from traffic load file.) |
Group Demand Traffic on Link Summary Report
The output file that is written to the output directory is called “GROUPLINKSUMMARY.runcode”.

Normal, Peak: Select Normal to display network information under normal conditions. After having run a failure simulation, select Peak to display peak utilization information.
Group Type: The default selection is user-defined groups. If this network contains PNNI groups, then the selection box also allows you to choose PNNI groups for viewing.
Period: Based on the traffic load file, the report can display traffic load information in the selected time period(s).
Field |
Description |
|---|---|
Group A, Z |
This row contains summarized information for links in the network whose first endpoint is in group A and other is in group Z. |
TotalBW |
The sum of the bandwidth of links between group A and group Z. |
ProvBW |
The sum of the amount of bandwidth in the links planned for demands that are routed on or pass through the links. |
# Link |
The number of links between group A and group Z. |
# Calls |
The number of demands routed on or through the links between group A and group Z. |
WorstLd |
The sum of the links’ traffic load in the worst case out of all the time periods. (Data taken from traffic load file.) |
WorstLd/TotalBW |
The ratio of worst load and sum of the bandwidth of the links. |
P_01, P_02, ... |
The sum of the links’ traffic load in period 1 (P_01), period 2 (P_02), etc. (Data taken from traffic load file.) |
Group Demand Traffic on Link Detail Report
The output file that is written to the output directory is called “GROUPLINKDETAIL.runcode”.
Normal, Peak: Select Normal to display network information under normal conditions. After having run a failure simulation, select Peak to displaypeak utilization information.
Group Type: The default selection is user-defined groups. If this network contains PNNI groups, then the selection box will also allow you to choose PNNI groups for viewing.
Period: Based on the traffic load file, the report can display traffic load information in the selected time period(s).
Field |
Description |
|---|---|
Node A, Z |
This row describes a link in the network whose endpoints are at node A and node Z. |
Group A, Z |
Group A is the group in which node A resides. Group Z is the group in which node Z resides. |
TotalBW |
The bandwidth of the link. |
ProvBW |
The amount of bandwidth in the link planned for demands that are routed on the link or pass through the link. |
# Calls |
The number of demands routed on or through the link. Note: This can be verified by right-clicking on the link in the map and selecting View > Demands On/Thru Link. |
WorstLd |
The link’s traffic load in the worst case out of all the time periods. (Data taken from traffic load file.) |
WorstLd/TotalBW |
The ratio of worst load and the link’s bandwidth. |
P_01, P_02, ... |
The traffic load in the link in period 1 (P_01), period 2 (P_02), etc. (Data taken from traffic load file.) |
Group Interface Load Summary Report
The output file that is written to the output directory is called “GROUPINTFSUMMARY.runcode”.
To display interface load information in these reports, the interface load files must first be read into the network model.

Group Type: The default selection is user-defined groups. If this network contains PNNI groups, then the selection box will also allow you to choose PNNI groups for viewing.
Period: Based on the traffic load file, the report can display traffic load information in the selected time period(s).
Field |
Description |
|---|---|
Group A, Z |
This row contains summarized information for traffic that originate at the interfaces of nodes that belong in group A and terminate at the interfaces of nodes that belong in group Z. Group A is the group in which node A resides. Group Z is the group in which node Z resides. |
Bandwidth |
The sum of the bandwidth of links between group A and group Z. |
WorstLoad |
The interface traffic load of the links from group A to group Z in the worst case out of all the time periods. (Data taken from interface traffic load files.) |
AverageLoad |
The average interface load of the links from group A to group Z in all the time periods. (Data taken from interface traffic load files.) |
Group Interface Load Detail Report
The output file that is written to the output directory is called “GROUPINTFDETAIL.runcode”.

Group Type: The default selection is user-defined groups. If this network contains PNNI groups, then the selection box will also allow you to choose PNNI groups for viewing.
Period: Based on the interface traffic load file, the report can display traffic load information in the selected time period(s).
Field |
Description |
|---|---|
LinkName |
The name of a link whose end points are at node A and node Z. If the link does not have a link name, then it will appear as [nodeA]-[nodeZ]. |
Node A, Z |
This row describes a link in the network whose endpoints are at node A and node Z. |
Interface A, Z |
This row gives interface A,Z that corresponds to node A,Z. |
Group A,Z |
The groups that nodes A and Z belong to, respectively. |
Bandwidth |
This corresponds to the bandwidth of interface A |
Trunk Type |
The link trunk type. |
Worst Load |
The interface load of the link from interface A to interface Z in the worst case out of all the time periods. (Data taken from interface load files.) |
Average Load |
The average interface load of the link from interface A to interface Z in all the time periods. (Data taken from interface load files.) |
Group Demand Bandwidth Distribution Report
Like the VPN Reports, the Group Demand Bandwidth Distribution Report provides summarized traffic statistics. The output file is saved to the L3GROUPLOAD file. The source, destination, transit, and intra-group traffic is reported for each group, in terms of the number of demands and the bandwidth of those demands. Note that the source and destination traffic for a group do not include intra-group traffic.
Two additional columns #Transit(Max) and TransitBW(Max) may appear after running an exhaustive failure simulation script from Simulation>Scripts with the Generate Peak Group Transit Statistics checkbox selected or by setting CheckTransitDemandLimit=2 in the dparam file.

Field |
Description |
|---|---|
Group |
The name of the group whose traffic load is being analyzed. For nodes not belonging to any group, they are categorized together as “No Group” |
VPN |
The VPN, if any, whose traffic is being analyzed. For networks with multiple VPNs, select a specific owner under the Owner dropdownmenu to view only statistics for a particular VPN. Alternatively, select owner “All” to view a breakdown into statistics for each VPN. followed by the sum total.
|
#Src(Inter) SrcBW(Inter) |
Total number of demands and bandwidth of demands that originate at this group and visit at least one other group. Note: This category includes local inter-group traffic but not local intra-group traffic. For the total bandwidth originating at this group, add Src(Inter)+Local(Intra). |
#Src(Placed) SrcBW(Placed) |
Number of routed demands and total bandwidth of routed demands that originate at this group and visit at least one other group. Unlike Src(Inter), Src(Placed) excludes unplaced demands. |
#Dest(Inter) DestBW(Inter) |
Total number of demands and bandwidth of demands that terminate at this group and visit at least one other group Note: This category includes local inter-group traffic but not local intra-group traffic. For the total bandwidth terminating at this group, add Dest(Inter)+Local(Intra). |
#Dest(Placed) DestBW(Placed) |
Total number of routed demands and bandwidth of routed demands that terminate at this group after visiting at least one other group. Unlike Dest(Inter), Dest(Placed) excludes unplaced demands. |
#Transit TransitBW |
Number of demands and total bandwidth of demands that pass through this group without originating or terminating at it Note: If a demand transits through a group more than once, it is counted multiple times. |
#Local LocalBW |
Total number of demands and bandwidth of demands that originate and terminate at the same group, subdivided below into Local(Intra) and Local(Inter). |
#Local(Intra) LocalBW (Intra) |
Demands that originate and terminate at the same group which never go outside the group. |
#Local(Inter) LocalBW (Inter) |
Demands that originate and terminate at the same group but transit through at least one other group. These demands are also counted under Src(Inter) and Dest(Inter). |
#Transit(Max) TransitBW(Max) |
Max number and bandwidth of transit demands at this group during peak failure simulation |
To view the details of the demands included in each category: Src(Inter), Dest(Inter), Transit, and Local(Inter), Local(Intra), access the text mode either from the command line using /u/wandl/bin/bbdsgn followed by the specification file path. Detailed info can be found under the menu item: 3. Network Information > 4.Path > 13.Group. Upon entering the group name, you can select which category of demands to view. For example, the following indicates the demands transiting through Group 1.
Enter group name: group1
Group Demands Menu (GROUP1):
1. ALL 2. Src (Inter) 3. Dest (Inter) 4. Transit
5. Local (Intra) 6. Local (Inter)
Select: 4
Demands Passing Through GROUP1:
* Bandwidth Unit = bit
Demand Node Node Bandwidth Type Pri/Pre path
flow10 ATL SDG 418017 R,A2Z 02,02 ATL--LAX--SDG
flow52 DEN SDG 402000 R,A2Z 02,02 DEN--SFO-SJC--LAX--SDG
flow78 NYC SDG 4801220 R,A2Z 02,02
NYC--PHI--WDC--ATL--LAX--SDG
flow82 PHI SDG 1216020 R,A2Z 02,02 PHI--WDC--ATL--LAX--SDG
flow88 SDG WDC 662011 R,A2Z 02,02 SDG--LAX--ATL--WDC
xflow10 SDG ATL 452011 R,A2Z 02,02 SDG--LAX--ATL
xflow52 SDG DEN 452011 R,A2Z 02,02 SDG--LAX--SJC-SFO--DEN
xflow78 SDG NYC 662011 R,A2Z 02,02
SDG--LAX--ATL--WDC--PHI--NYC
xflow82 SDG PHI 452011 R,A2Z 02,02 SDG--LAX--ATL--WDC--PHI
xflow88 WDC SDG 4689230 R,A2Z 02,02 WDC--ATL--LAX--SDG
--- 10 demands, Total bandwidth = 14.207M
Node Reports
Demand Traffic Per Node Report
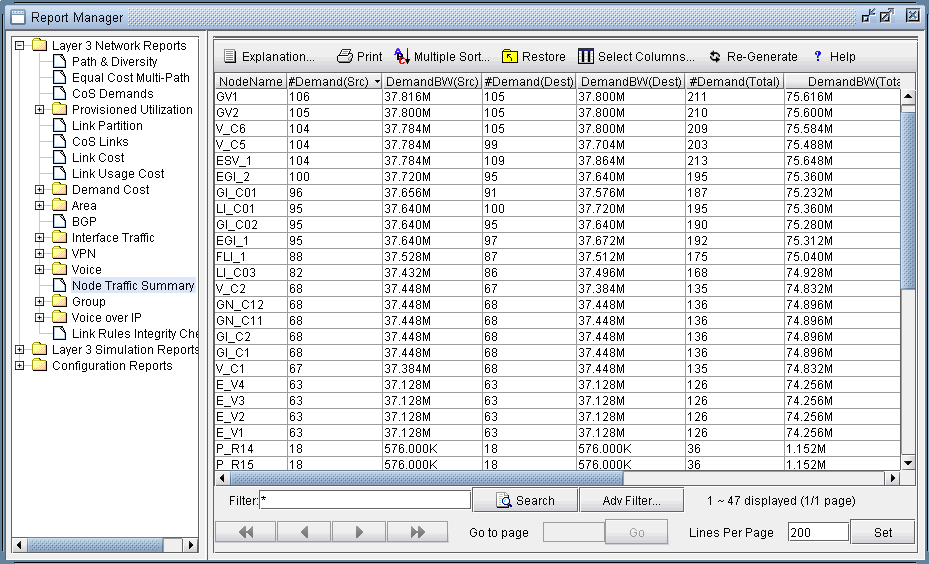
The Demand Traffic Per Node Report contains summary traffic statistics for each node, including the amount of source, destination, and transit traffic reported either as a number of demands or as the combined bandwidth of those demands. Note that local demands (demands that originate and end at the same node) are not included in the source or destination traffic statistics.
The output file that is written to the output directory is called “SWITCHCONN.runcode”.
Field |
Description |
|---|---|
NodeName |
The name of the node. |
#Demand(Src) DemandBW(Src) |
Number of demands and total bandwidth of demands that originate at this node and terminate elsewhere (outgoing) |
#Demand(Dest) DemandBW(Dest) |
Number of demands and total bandwidth of demands that terminate at this node and originate elsewhere (incoming) |
#Demand(Total) DemandBW(Total) |
#Demand(Total)= #Demand(Src) + #Demand(Dest) DemandBW(Total)=DemandBW(Src) + DemandBW(Dest) |
#TransitDemand TransitBW |
Number of demands and total bandwidth of demands that pass through this node without originating or terminating at it |
#TransitDmd(Max) TransitBW(Max) |
Max number and bandwidth of transit demands at this node during peak failure simulation |
For ATM models, the headings for the report are shown in the following table.
Field |
Description |
|---|---|
NodeName |
The name of the node. |
#LocalDmd |
The number of local demands at the node. Local demands are ones that originate and terminate at the node. |
LocalBW |
The bandwidth of local demands at the node. |
#NonLocalDmd(Src) |
The number of non-local demands that originate from the node. |
NonLocalBW(Src) |
The bandwidth of non-local demands that originate from the node. |
#NonLocalDmd |
Total number of non-local demands originating/terminating at the node. |
NonLocalBW |
Total bandwidth of non-local demands originating/terminating at the node. For asymmetric demands, the bandwidth of a demand is set to the larger value. |
#TransitDmd |
The number of transit demands at the node. Transit demands are ones that pass through the node, neither originating or terminating at the node. |
#TransitDmd(Max) |
The maximum number of transit demands at the node during peak failure simulation. |
VPN Reports
The VPN Reports in the Report Manager display information about Layer3/Layer2 Kompella VPNs as well as Layer2 Martini VPNs.
Layer3/Layer2 Kompella Report
Field |
Description |
|---|---|
Node |
The name of the node |
VPN Name |
The VPN name |
VRF |
The virtual routing and forwarding instance name |
RD |
The route distinguisher - used to determine which VPN a route belongs to |
Route Target Export |
Target VPN community that routes are exported to |
Route Target Import |
Target VPN community that routes are imported from |
Protocols |
The VPN protocol used |
Interface |
The interfaced used by the VPN |
IP address |
The VPN’s IP Address |
Bandwidth |
The allocated bandwidth |
Layer2 Martini Report
Field |
Description |
|---|---|
VPNName |
The name of the VPN |
Node A, Z |
The end points of the VPN and the nodes at which the circuits reside. Circuit A resides in node A, and circuit Z resides in node Z |
VCID |
The (unique) virtual circuit identifiers |
circuit A, Z |
The circuits at nodes A and Z that the VPN is connected to |
Encapsulation ID |
The interface encapsulation type |
BW |
The amount of bandwidth allocated to the VPN |
Protocols Reports
Inter Area Load Distribution Report
The Inter Domain Load Distribution Report displays information on the load distribution between domains/areas in the network and is saved as “INTDOMLOAD.runcode”.
Demand Info: --- Total --- --- Placed --- - Not Placed - - Deactivated
- Area -> Area Count Bandwidth Count Bandwidth Count Bandwidth Count Bandwidth
AREA1 ->AREA0 10 4.864M 10 4.864M 0 0 0 0
 AREA1 ->AREA3 15 3.712M 15 3.712M 0 0 0 0
AREA0 ->AREA1 10 4.864M 10 4.864M 0 0 0 0
AREA0 ->AREA3 20 1.280M 20 1.280M 0 0 0 0
AREA2 ->AREA1 24 32.544M 0 0 24 32.544M 0 0
 AREA2 ->AREA0 16 21.696M 0 0 16 21.696M 0 0
AREA2 ->AREA3 8 10.848M 0 0 8 10.848M 0 0
AREA3 ->AREA1 12 2.176M 12 2.176M 0 0 0 0
AREA3 ->AREA0 20 1.280M 20 1.280M 0 0 0 0
 -------------------------------------------------------------------------------
ALL ->ALL 135 83.264M 87 18.176M 48 65.088M 0 0
--- Inter-Domain Traffic from DOMAIN-EAST to DOMAIN-WEST
Demand1,DOMAIN_EAST,N1,,,XN1,US,DOMAIN_WEST,N2,,,XN2,US,
900000,"R,A2Z,CBR",Don't Care,Don't Care,Don't Care,"00,00",N1@@N2,684,25,no,no,
,

PVC Info: --- Total --- --- Placed --- - Not Placed - - Deactivated-
Domain -> Domain Count Bandwidth Count Bandwidth Count Bandwidth Count Bandwidth
DOMAIN-EAST->DOMAIN-WEST 1 900.000K 1 900.000K 0 0 0
0

--- Inter-Domain Traffic from DOMAIN-EAST to TEST

--- Inter-Domain Traffic from DOMAIN-WEST to NONE

--- Inter-Domain Traffic from DOMAIN-WEST to DOMAIN-EAST
Demand1,DOMAIN_EAST,N1,,,XN1,US,DOMAIN_WEST,N2,,,XN2,US,
900000,"R,Z2A,CBR",Don't Care,Don't Care,Don't Care,"00,00",N1@@N2,684,25,no,no,
,

PVC Info: --- Total --- --- Placed --- - Not Placed - - Deactivated-Domain -> Domain Count Bandwidth Count Bandwidth Count Bandwidth Count Bandwidth
DOMAIN-WEST->DOMAIN-EAST 1 900.000K 1 900.000K 0 0 0
0

--- Inter-Domain Traffic from DOMAIN-WEST to TEST
Demand2,DOMAIN_WEST,N2,,,XN2,US,TEST,N3,,,XN3,US, 750000,"R,A2Z,CBR",Don't
Care,Don't Care,Don't Care,"00,00",N2@@N3,684,21,no,no, ,

PVC Info: --- Total --- --- Placed --- - Not Placed - - Deactivated-
Domain -> Domain Count Bandwidth Count Bandwidth Count Bandwidth Count Bandwidth
DOMAIN-WEST->TEST 1 750.000K 1 750.000K 0 0 0
0
Field |
Description |
|---|---|
Count |
The number of demands/PVCs between the two areas. |
Bandwidth |
The amount of bandwidth used by the demands/PVCs. |
Total |
All demands/PVCs between the two areas: placed + not placed + deactivated. |
Placed |
The demands/PVCs between the areas that are routed. |
Not Placed |
The demands/PVCs between the areas that are not routed. |
Deactivated |
The demands/PVCs between the areas that are not activated. |
Inter Area Paths Report
The Inter Domain Paths Report displays information regarding paths between two user-specified areas/domains. The output file that is written to the output directory is called “INTDOMPATH.runcode”.
Field |
Description |
|---|---|
Count |
The number of demands/PVCs between the two areas. |
Bandwidth |
The amount of bandwidth used by the demands/PVCs. |
Total |
All demands/PVCs between the two areas: placed + not placed + deactivated. |
Placed |
The demands/PVCs between the areas that are routed. |
Not Placed |
The demands/PVCs between the areas that are not routed. |
Deactivated |
The demands/PVCs between the areas that are not activated. |
Area Pass Through Paths Report
The Area Pass Through Paths Report, or the Domain Pass Through Paths Report, generates information regarding demands passing through an area or domain in the network. This report is only available for networks defined with multiple areas or domains and demands to and from each domain. The output file that is written to the output directory is called “DOMPASSTHRU.runcode”.
Following is a sample text file of the Domain Pass Through Paths Report from an ATM network:
Demands passing through domain AREA0:
RN1N15,0.0.0.3,N1,,,XN1,US,0.0.0.1,N15,,,XN15,US, 768000,"R,BR1.0M,BM768K,BB200K,RT",Don't Care,Don't
Care,Don't Care,"02,02",N1-N10@@N17--N4--N7@@N8--N15,600,23,no,no, ,
RN1N15,0.0.0.3,N1,,,XN1,US,0.0.0.1,N15,,,XN15,US, 768000,"R,BR1.0M,BM768K,BB200K,RT",Don't Care,Don't
Care,Don't Care,"02,02",N1-N10@@N5--N6--N7@@N8--N15,600,22,no,no, ,
RN2N3,0.0.0.3,N2,,,XN2,US,0.0.0.1,N3,,,XN3,US, 512000,"R,Z2A,UBR+",Don't Care,Don't Care,Don't
Care,"02,02",N2--N10@@N17--N4@@N3,400,16,no,no, ,
RN2N3,0.0.0.3,N2,,,XN2,US,0.0.0.1,N3,,,XN3,US, 512000,"R,Z2A,UBR+",Don't Care,Don't Care,Don't
Care,"02,02",N2--N10@@N17--N4@@N3,400,16,no,no, ,
RN2N3,0.0.0.3,N2,,,XN2,US,0.0.0.1,N3,,,XN3,US, 512000,"R,Z2A,UBR+",Don't Care,Don't Care,Don't
Care,"02,02",N2--N10@@N17--N4@@N3,400,16,no,no, ,
RN2N13,0.0.0.3,N2,,,XN2,US,0.0.0.1,N13,,,XN13,US, 64000,"R,RT",Don't Care,Don't Care,Don't
Care,"02,02",N2--N10@@N11--N6@@N13,400,13,no,no, ,
RN2N13,0.0.0.3,N2,,,XN2,US,0.0.0.1,N13,,,XN13,US, 64000,"R,RT",Don't Care,Don't Care,Don't
Care,"02,02",N2--N10@@N11--N6@@N13,400,13,no,no, ,
RN2N13,0.0.0.3,N2,,,XN2,US,0.0.0.1,N13,,,XN13,US, 64000,"R,RT",Don't Care,Don't Care,Don't
Care,"02,02",N2--N10@@N11--N6@@N13,400,13,no,no, ,
RN2N13,0.0.0.3,N2,,,XN2,US,0.0.0.1,N13,,,XN13,US, 64000,"R,RT",Don't Care,Don't Care,Don't
Care,"02,02",N2--N10@@N11--N6@@N13,400,13,no,no, ,
RN2N13,0.0.0.3,N2,,,XN2,US,0.0.0.1,N13,,,XN13,US, 64000,"R,RT",Don't Care,Don't Care,Don't
Care,"02,02",N2--N10@@N11--N6@@N13,400,13,no,no, ,
RN2N13,0.0.0.3,N2,,,XN2,US,0.0.0.1,N13,,,XN13,US, 64000,"R,RT",Don't Care,Don't Care,Don't
Care,"02,02",N2--N10@@N5--N6@@N13,400,12,no,no, ,RN2N13,0.0.0.3,N2,,,XN2,US,0.0.0.1,N13,,,XN13,US, 64000,"R,RT",Don't Care,Don't Care,Don't
Care,"02,02",N2--N10@@N11--N6@@N13,400,13,no,no, ,
RN2N13,0.0.0.3,N2,,,XN2,US,0.0.0.1,N13,,,XN13,US, 64000,"R,RT",Don't Care,Don't Care,Don't
Care,"02,02",N2--N10@@N5--N6@@N13,400,12,no,no, ,
RN2N13,0.0.0.3,N2,,,XN2,US,0.0.0.1,N13,,,XN13,US, 64000,"R,RT",Don't Care,Don't Care,Don't
Care,"02,02",N2--N10@@N11--N6@@N13,400,13,no,no, ,
RN2N13,0.0.0.3,N2,,,XN2,US,0.0.0.1,N13,,,XN13,US, 64000,"R,RT",Don't Care,Don't Care,Don't
Care,"02,02",N2--N10@@N11--N6@@N13,400,13,no,no, ,
-- 15 PVC(s)(bw=3.712M) pass through domain AREA0
OSPF Area Summary Report
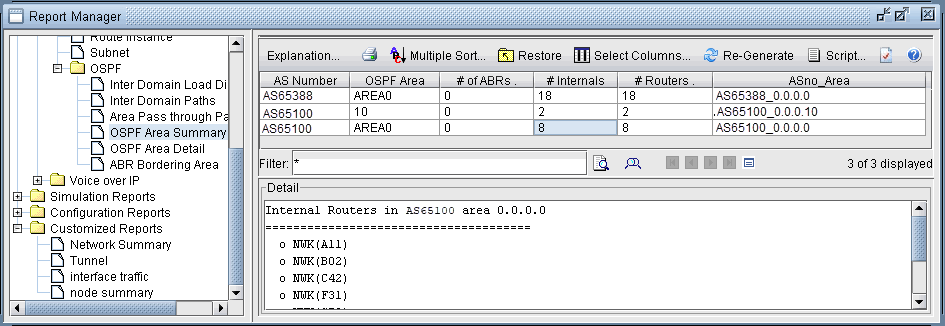
The Area Reports in the Report Manager display information about areas in the network model. This section includes a description of the OSPF area summary and detail reports, as well as the ABR border area report.
Field |
Description |
|---|---|
AS Number |
The AS number of the area |
OSPF Area |
The name of the OSPF area |
# of ABRs |
The number of nodes that are defined as Area Border Routers (gateway routers) |
# Internals |
The number of routers in the OSPF area that aren’t defined as ABRs |
# Routers |
The total number of routers in the area (equivalent to # of ABRs + # Internals) |
ASno_Area |
A unique name created by concatenating the AS number and the area name |
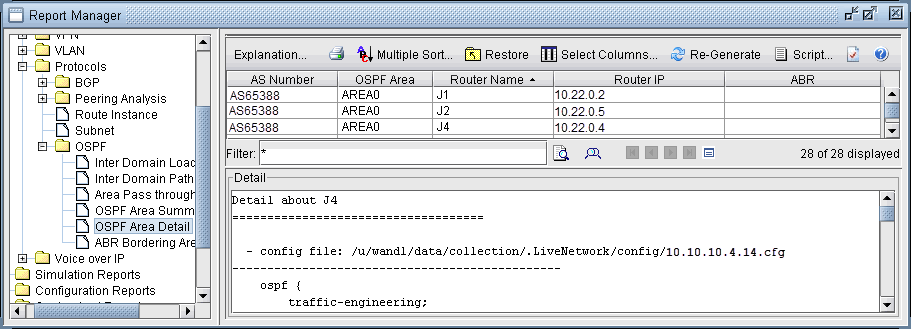
OSPF Area Detail Report
Field |
Description |
|---|---|
AS Number |
The AS number of the OSPF area that the router is located in |
OSPF Area |
The name of the OSPF area that the router is located in |
Router Name |
The name of the router |
Router IP |
The router’s IP Address |
ABR |
Is this router defined as an Area Border Router |
ABR Bordering Area Report
Field |
Description |
|---|---|
AS Number |
The AS number of the area that the ABR is located in |
ABR |
The name of the ABR |
Bordering Area(s) |
A list of all the areas that the router is bordering |
BGP Reports
When the client session is opened for the first time, the BGP Report should be checked to make sure that the network has no obvious BGP configuration errors. The output file that is written to the output directory is called “BGPRPT.runcode”.
BGP Integrity Check Report:
BGP statistics – This section shows:
The total number of BGP speakers in the network
The total number of neighbors
The total number of policies
The list of all ASs and the number of their BGP speakers
 * BGP Integrity Check Report
******************************************************
-- 17 BGP speakers,89 neighbors,283 members,183 policies
 -- 3 local AS:
ASno 65522: 9 routers
ASno 65511: 7 routers
ASno 65534: 1 routers
Neighbor AS Specification Error Check Report
This section shows any errors about ASs that are not specified correctly. For example, router A declares that its neighbor, router B, is in AS65524, but router B is actually in AS65522.
* * * * * Neighbor AS Specification Error Check Report
AS Location Nbr_AS Nbr_IP_Addr Nbr-Location ValidAS Comments
65511 X39 65524 10.49.226.34 Q39 65522
*** 1 AS specification errors
In the example, the Neighbor AS Specification Error Check Report shows that there is an error in the node (Location) X39.
The neighbor node(Nbr-Location) is Q39 and the neighbor AS (Nbr_AS) is 65524, which should be 65522 as shown in the ValidAS field
Unbalanced BGP Neighbor Check Report
The BGP protocol requires that if router A declares router B to be its neighbor, then router B also has to declare that router A is its neighbor. If not, then an unbalanced neighbor occurs. This section reports any unbalanced neighbors between BGP speakers within the network.
* * * * * Unbalanced BGP Neighbor Check Report
# Unbalanced BGP Neighbor = 2
AS Location Nbr_AS Nbr-Location
65511 S39 65511 X39
65511 W39 65511 X39
The Unbalanced BGP Neighbor Check Report shows that there are two unbalanced neighbors. On the first record S39 declares that X39 is its neighbor but X39 does not declare that S39 is its neighbor. The second record shows a similar error.
IBGP Mesh Connectivity Check Report
All IBGP speakers within an AS have to be fully meshed, unless route reflectors or confederation are used. This section shows if any AS is not fully meshed.
A full mesh for both IPV4 and VPNV4 address families are checked.
* * * * *
IBGP Mesh Connectivity Check Report
AS65522: #IPV4 IBGP neighbor=0. Check mesh definition for VPNV4 address family
AS 65522: passed mesh connectivity checking
---- VPNV4 AS65511: S39 is not defined as X39's neighbor
IPV4 VPNV4 AS65511: W39 is not defined as X39's neighbor
AS65511: 2 neighbor definition missing
AS65533: IPV4, VPNV4, L2VPN IBGP neighbors are not defined
AS 65534: passed mesh connectivity checking
The IBGP Mesh Connectivity Check Report shows the following
AS65522 is fully meshed for the VPNV4 address family but no IBGP neighbors exist for IPV4 address family.
AS65511 is not fully meshed for IPV4 and VPNV4. For the VPNV4 address family, S39 and W39 are not defined as X39’s neighbors. For the IPV4 address family, W39 is not defined as X39’s neighbor.
AS65533 is missing IBGP neighbors for the IPV4, VPNV4, and L2VPN address families.
AS65534 passes the mesh connectivity check for both IPV4 and VPNV4.
IPV4/VPNV4/L2VPN Route Reflector Statistics
These three sections indicate the route reflector statistics, including number of route reflectors, number of route reflector clients, and hierarchical route reflector information. Route reflector clients with only one route reflector are listed as a warning that they do not have redundant route reflectors defined. The following is an example of the IPV4 route reflector statistics:
IPV4 Route Reflector Statistics: 200 BGP Speakers, 8 Route Reflectors, 100 Route Reflector Clients Redundant Route Reflectors are not defined at 2 RR Clients 1. WDC1, RR= PHI1 2. WDC2, RR= PHI1
#Route Reflector Hierarchy Level= 3
Top Level: 4RR(s)
1. NYC1,
2. NYC2,
3. BOS1,
4. BOS2,
Level 2: 3RR(s)
1. PHI1, RR= NYC1 NYC2
1. PHI2, RR= NYC1 NYC2
2. BOS3, RR= BOS1 BOS2
Level 3: 1RR(s)
1. TRE1, RR= PHI1 PHI2
VPNV4 and L2VPN route reflector statistics are similarly provided.
It is recommended that all errors reported in the BGP Report file get fixed before carrying on further analysis. One way to do it is to correct the errors on the configuration files and then run through getipconf again.
