Help us improve your experience.

Let us know what you think.

Do you have time for a two-minute survey?


Viewing Demands Through a Tunnel

To view all demands routed over a tunnel, right-click over the tunnel and select Show Demands Routed on Tunnel.

In the Demands window, examine the Current Route column which indicates the path taken bythe demands. Open and closed brackets in the path indicate where a tunnel is entered and exited.
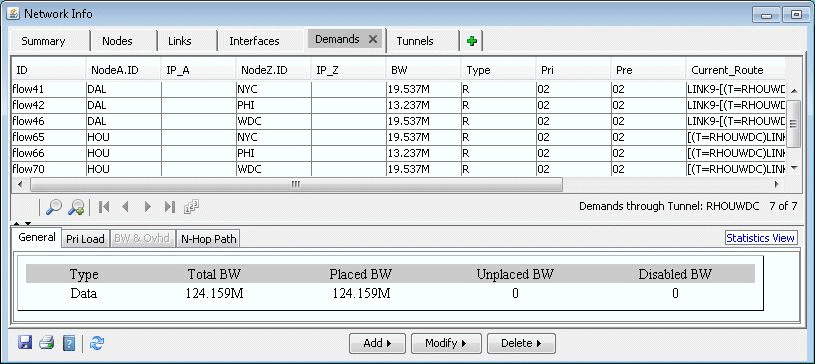
Figure 1: Demands (or Flows) Routed Through a Particular TunnelNetwork management tool interface showing tabs for Summary, Nodes, Links, Interfaces, Demands, and Tunnels. Demands table lists flows with columns for ID, source and destination nodes, IP addresses, bandwidth, type, priority, preemption, and current route. General statistics show total, placed, unplaced, and disabled bandwidth. Buttons for Add, Modify, and Delete manage demands.

In Figure 1, the selected demand between HOU and NYC. has the route HOU[--DAL--CHI--]WDC--PHI--NYC, indicating that the demand traversed a tunnel from Houston (HOU) to Washington D.C. (WDC).

Clicking on “Show Path” displays the path of the demand on the map. Notice that a purple color is used to indicate the portion where the demand is travelling through a tunnel.
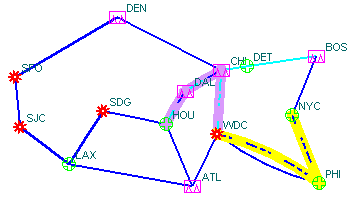
Figure 2: Path of Demand Through a TunnelNetwork diagram showing connections between US cities, labeled with abbreviations like SFO, DEN, and NYC. Color-coded lines indicate different routes.