Network Information Table Overview
Network information is displayed in the pane at the bottom of the Topology view, below the topology map. An example of the table is shown in Figure 1.
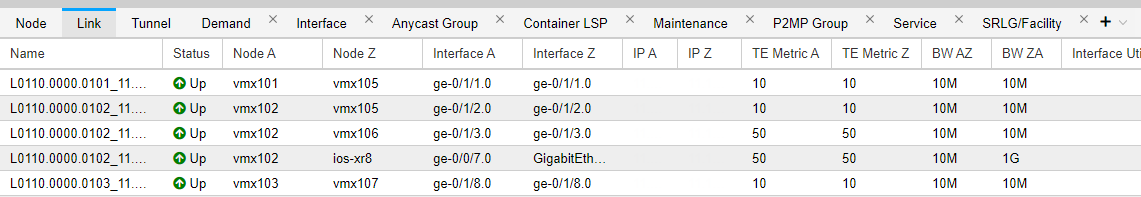
Tabs appear across the top of the network information table. The columns of information change according to the tab you select (Node, Link, Tunnel, Demand, Interface, Anycast Group, Container LSP, IPE Policy, Maintenance, P2MP Group, Service, SRLG/Facility).
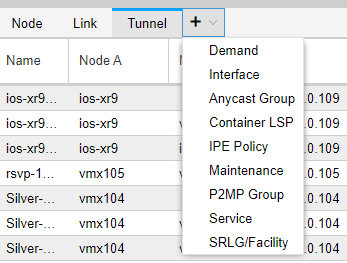
The Node, Link, and Tunnel tabs are always displayed. The other tabs are optionally displayed. Click the + sign in the tabs heading bar to add a tab as shown in Figure 2.
Click the X beside any optionally displayed tab heading to remove the tab from the display.
The Service tab (for VPNs found in the network) is not populated until you enable collection of VPN data:
-
Use a text editing tool such as vi to modify the northstar.cfg file, adding the northstar_vpn parameter with the value of true.
-
Restart the northstar_pcs process group:
[root@ns]# supervisorctl restart northstar_pcs:
-
Run device collection from Administration > Task Scheduler.
-
Log out of NorthStar Controller and then log back in.
Within the tables, each row represents an element. The element information can be rearranged and, in some cases, added to, filtered, modified, or deleted. When you select an element in the network information table, the corresponding element is selected in the topology map.
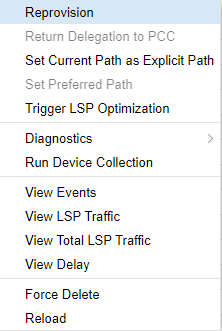
On any element, you can right-click for options relevant to that element. For example, if you right-click a tunnel, you have the options shown in Figure 3.
If you select View Events, for example, you are first prompted to select a time range and click Submit, after which a window similar to the example shown in Figure 4 is displayed.
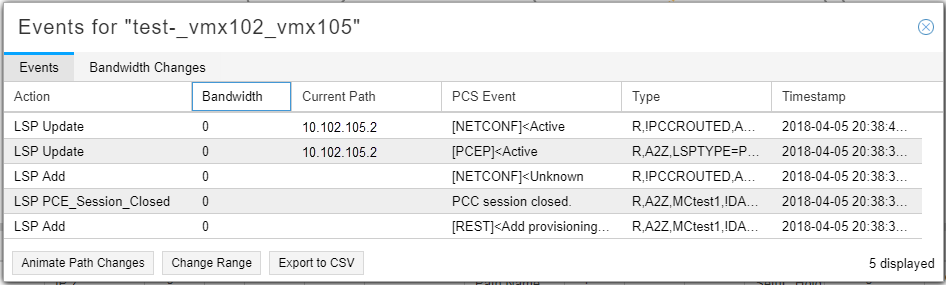
The events included in the View Events window are restricted to external communication to and from NorthStar. Most of the communications internal to NorthStar are captured only in the log files. This allows you to focus on the information most likely to be useful to you as a NorthStar operator.
Special purpose network information table tabs are added in response to right-clicking on certain network information table elements to display more specific data such as various kinds of traffic, interface delay, packet loss, or sub-LSPs.
On any element, you can double click for detailed information about that specific element. For example, if you double click a node, you see information similar to that shown in Figure 5.
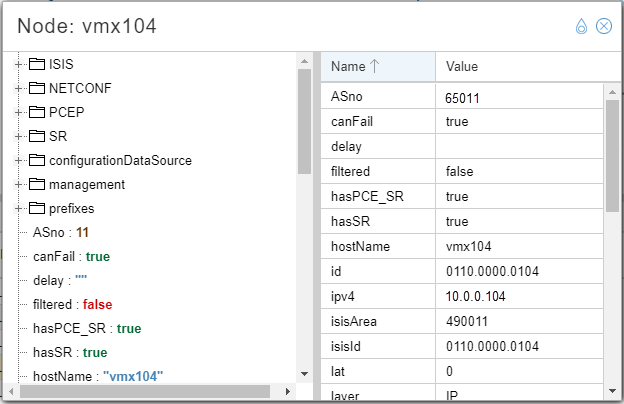
The teardrop-shaped icon in the upper right corner of the details window controls the pin behavior described in Table 1.
|
Pin State |
Behavior |
|---|---|

Unpinned |
When unpinned, double clicking a second element in the network information table replaces the contents of the first details window with the details of the second element. In this scenario, there is only one details window open at a time. |

Pinned |
When pinned, double clicking a second element in the network information table opens a new details window, leaving the first window intact. Tip:
If you double click a second element, but you still only see one details window, try moving the window to the side by clicking-and-dragging the window heading. The windows might be stacked. |