NorthStar Planner Web UI Overview
The NorthStar Planner web UI has five main views that are summarized here and discussed in detail in later topics. The menu icon (stacked bars) in the upper left corner of the Planner window offers all of
Network Browser
Topology
Dashboard
Simulation
Report Manager
Network Browser View
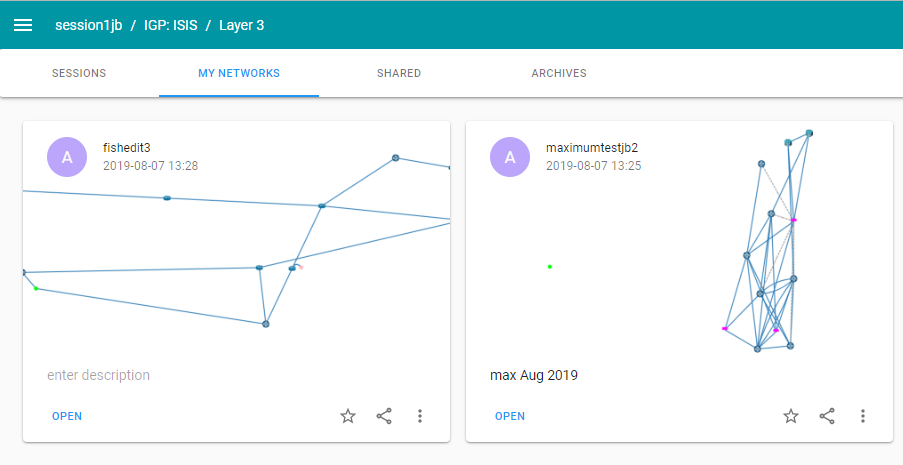
When you first log into the Planner, the Network Browser view is displayed as shown in Figure 1. There are four tabs: Sessions, My Networks, Shared, and Archives, described in Table 1.
Once you have opened a network or session, the other main views become available; they are network-specific.
Network Browser Tab |
Description |
|---|---|
Sessions |
A session is like an instance of a network. You can think of it as your working directory. When you open a network, a session instance is created, along with a session file and directory path on the server. In the session, you can make changes to the network, run reports, and run simulations. When you’re finished with your work, you can close the session with or without saving. If you save it, it then becomes available in the My Networks tab. If you don’t save it, the changes you made are not preserved. |
My Networks |
Also called Specification (Spec) files, the networks listed in the My Networks tab are collections of system files on the server, each collection representing a network model. These networks are stored on the server, not just in memory like sessions. |
Shared |
Spec files that you have access to, but don’t own. If you open a shared network and save it (Save As), it becomes available in My Networks. To make a spec file into a shared network for other users, click the Share icon in the lower right corner of the network’s “tile” in the Network Browser. |
Archives |
Archived networks are generated in the NorthStar Controller (Administration > Task Scheduler), after which, they are available in the Network Browser under the Archives tab. |
Each network has a “tile” in the Network Browser with the following key features:
The user group that opened the network is indicated by the letter in the colored circle. For example, in Figure 1, the letter “A” beside the network name and timestamp refers to the Admin group. The availability of some of the other features in the tiles are dependent on user group permissions.
A thumbnail of the network topology is included.
For networks you own, you can enter a network description by clicking where it says, “enter description”.
In the lower left corner are links for any available actions such as Open, Resume, or Close.
In the lower right corner are icons that allow you to:
Tag the network as a favorite (star icon). Favorites are displayed first in the Network Browser.
Share the network with others, in which case, it appears in the Shared tab of the Network Browser.
From the More Items icon (vertical dots), you can download the network to your local machine or delete the network.
When you open a network, it opens in Topology view, as shown in Figure 2. Click on the menu icon (horizontal bars) in the upper left corner of the Planner to select one of the other main views for the open network or to return to the Network Browser.
See Web Planner Top Menu Bar for information about the features of the top menu bar.
Topology View
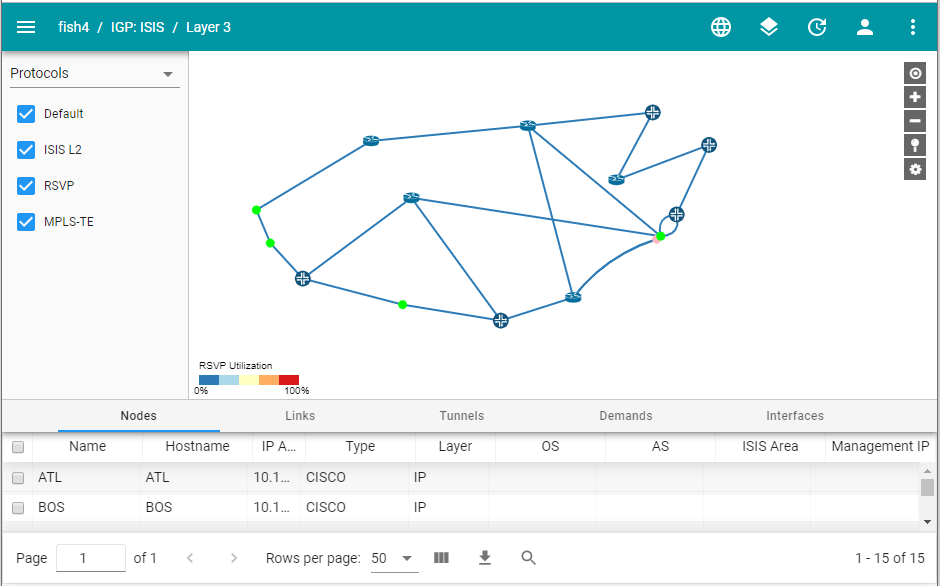
There are three main sections to the Topology view, similar to those in the NorthStar Controller UI:
The left pane offers a number of display options that are selectable using the drop-down menu.
The center area is devoted to the topology map of the network.
Across the bottom of the display is the network information table with five available tabs: Nodes, Links, Tunnels, Demands, and Interfaces.
Dashboard View
The Dashboard view presents a variety of status and statistics information related to the network, in the form of widgets as shown in Figure 3. To enlarge a widget to full screen, click the full screen icon in the upper right corner of the widget.
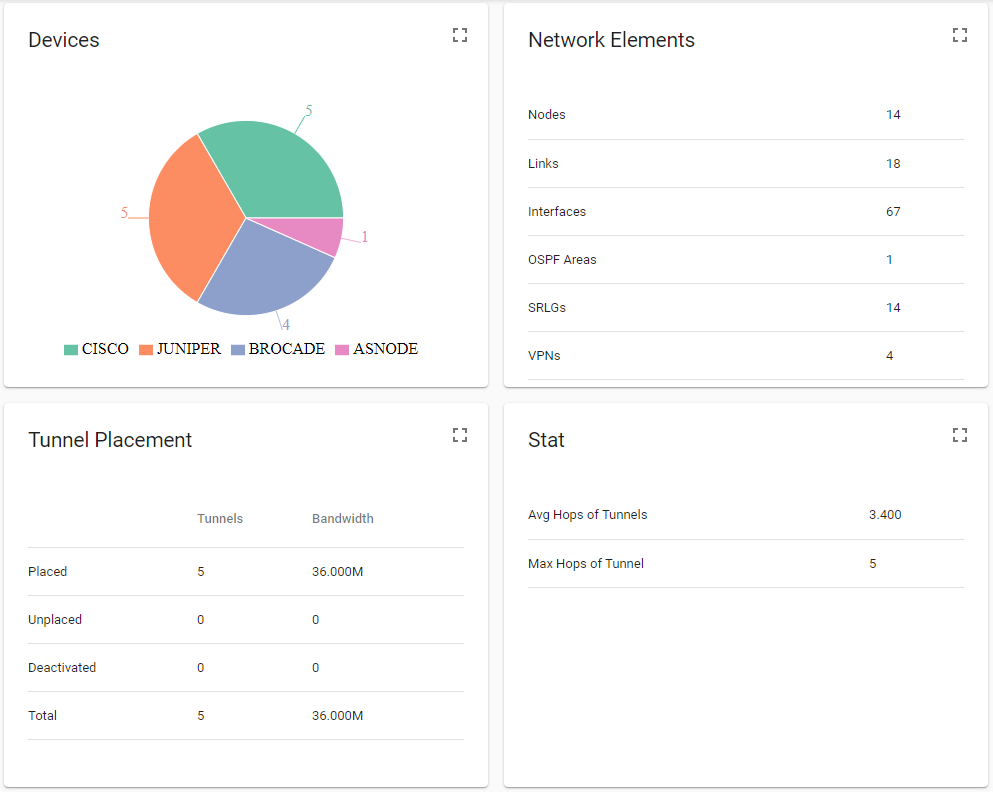
The widgets currently available are:
Widget |
Description |
|---|---|
Devices |
Shows the number of devices of each type included in the network, color coded. |
Network Elements |
Shows the number of nodes, links, interfaces, OSPF areas, SRLGs, and VPNs in the network. |
Tunnel Placement |
Shows how many tunnels are placed, unplaced, and deactivated, and their bandwidths. |
Stat |
Shows the average and maximum hops of tunnels in the network. |
Simulation View
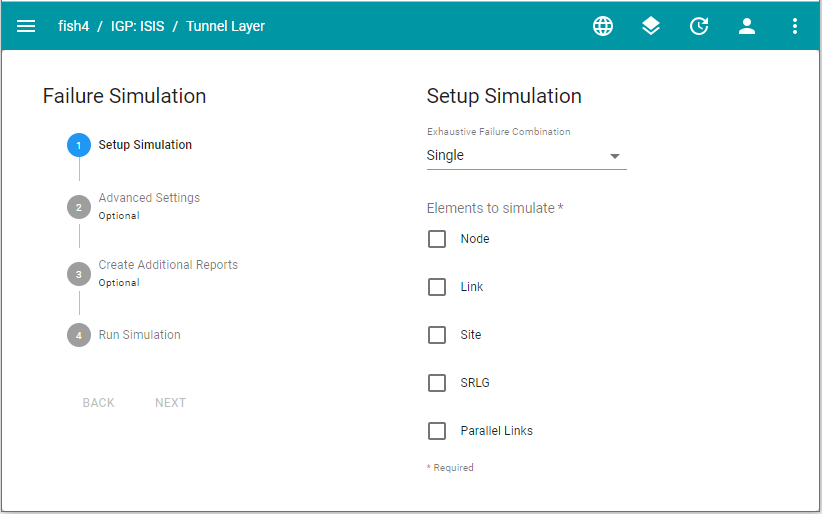
The Simulation View, one step of which is shown in Figure 4, presents a tool for designing and executing failure simulations.
You can run simulations at either Layer 3 or Tunnel/Layer 2 which you select from the top menu bar.
See Simulation for more information about running simulations.
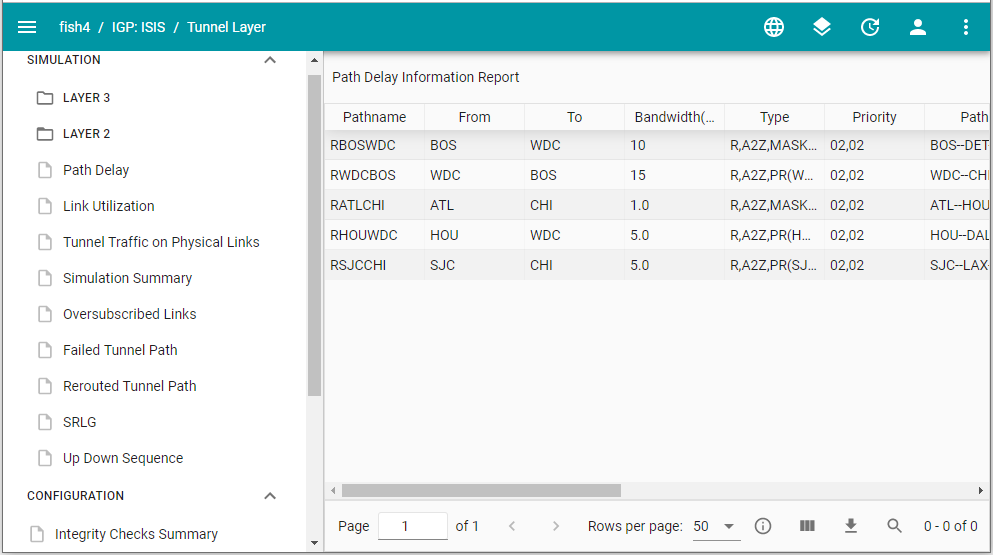
Report Manager View
The Report Manager view, shown in Figure 5, lists all the configuration and simulation reports that can be generated by the Planner. Click any report name on the left to display the report data on the right. A download option is available for saving reports.
See Report Manager for more information about working with reports.