Help us improve your experience.

Let us know what you think.

Do you have time for a two-minute survey?


Exhaustive Failure

  1. To run an exhaustive failure, click the Simulation button to switch to Simulation mode.
  2. Select the Simulation button and go to Simulation > Predefined Scenarios.
    Figure 1: FRR Failure Simulation OptionsFRR Failure Simulation Options

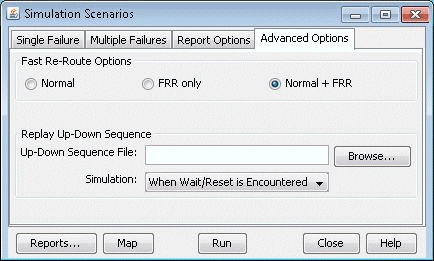
    During the failure simulation, NorthStar Planner keeps track of the peak, or worst utilization on each link. Recall that during a failure, the FRR backup tunnel provides fast restoration times by locally repairing LSPs at the point of failure, while waiting for the head-end routers to establish a new LSP. NorthStar Planner can simulate a number of scenarios.

    • Normal: Simulates the “normal” tunnel reroute. Does not consider the effect of the local repair during the simulation. Peak utilization reflects that during the “normal” situation.

    • FRR + Normal: Simulates the FRR local repair first followed by the normal primary tunnel reroute as established at the head-end router. The resulting link peak utilization report identifies the worst utilization, or max value of the transient detour and normal modes.

      Note:

      A primary tunnel being detoured is marked down if it cannot be rerouted.

    • FRR only: Simulates only the local repair. The resulting link peak utilization report reveals just the peak utilization experienced during the local repair.

  3. Under the Options section, select FRR and “FRR+Normal.” Then select one or more exhaustive single-element failure scenarios under the Scripts section.
  4. Next, to saved detailed reroute information including local protection and head-end rerouting to a report, select Reroute Information under the Report Options.
  5. Under Options, select Peak Utilization Report.
  6. Click “Run” to start the exhaustive failure simulation.
  7. Summary information is indicated in the Console, with the first entry for a failed element corresponding to the tunnel layer and the second entry corresponding to the demand layer.
  8. Go to Report > Report Manager to view the saved report file to view the detoured paths for all the primary tunnels requiring FRR protection followed by the headend reroute.
  9. Select the Peak Link Utilization report under Simulation Reports > Network Statistics to see the worst-case utilization across all the failure scenarios and the scroll to the last column to view which element failure the peak utilization occurred at.
  10. On the Standard Map, select the Utilization Legends > Peak Util to view the peak utilizations graphically.