Network Menu: Show Site Demands
The Show Site Demands option is available from Network > Elements > Demands. Right-click on a demand and select Show Site Demands to display the site-to-site demands on the map. The program calculates the total demand between two nodes and draws a line connecting them according to the colors described in the “BBload-Kbits” legend, which is displayed in one of the tab menus in the left pane of the topology window.
Figure 1: Viewing Site Demands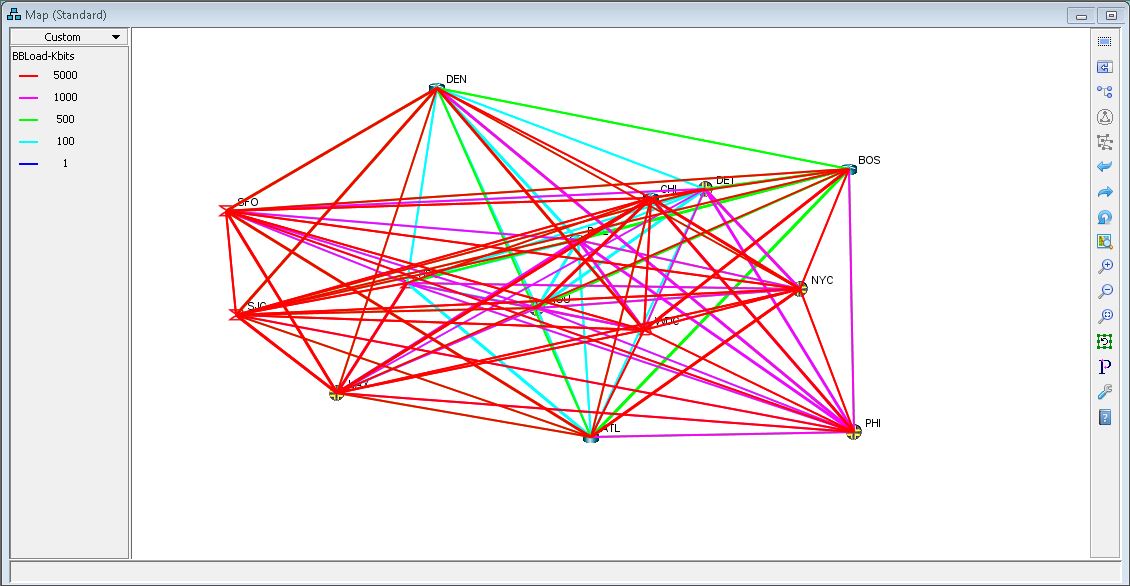
This view of the topology map is useful since it provides the use a visual picture of the demands found in the network. The utilization of each demand in displayed according to the color found in the legend.