Addendum: Interpreting the Traffic Charts
In the Computed Load from Demand Traffic window. the computed load is the traffic load on the link determined by the load on the demands that are routed over the link. The load on each demand for each of a number of periods is read from the trafficload file. NorthStar Planner computes the placement of the demands, and then reads the trafficload file to determine the traffic load on any particular link. If there are multiple demands traversing a link, then the Link Traffic Chart displays the sum of the demand loads.
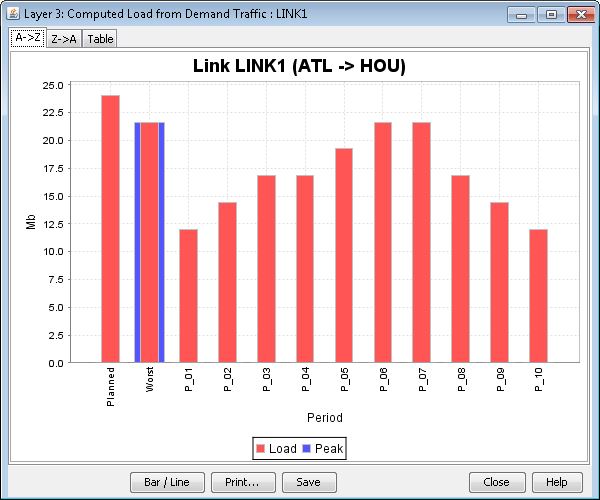
Planned: The first column represents the total bandwidth of the demands (from the demand file) that are routed over the link.
Worst: The second column represents the highest link load among the following periods.
Load: Represents the link load (up to 24 periods) based on the information given in the trafficload file.
Peak: If failure simulation is performed, peak is the highest link load during failure.
Customizing the Traffic Chart
The style of the chart can be toggled between a Bar chart and a Line chart, by pressing Bar/Line.
The color of the traffic chart can be edited by right-clicking on the graph and selecting Properties.
The period names at the bottom of the chart (excluding those for the Planned and Worst) can be customized for just the demand traffic charts by editing the optional “FORMAT” line in the original trafficload file. The “FORMAT” line looks similar to the following, and should be placed above the first line of actual traffic data:
FORMAT DIR FRAMESIZE Per1 Per2 Hour3 Hour4 5 6
F0001 A2Z - 6852 2083 1372 2749 1183 1242
F0001 Z2A - 18795 11703 4578 5065 4748 6155
Understanding Planned Load
The planned value is the sum of the bandwidth allocated on the link for every demand of the demand file. In the router environment, it is the same as the sum of the demand bandwidths. For ATM networks, it is the sum of the CAC. If an overbooking factor is set, the CAC value is modified. Planned bandwidth is the bandwidth from the router’s or switch's routing point of view.
Understanding Worst Load
The worst load is simply the worst traffic load experienced on the link over all periods for which traffic load data is supplied.
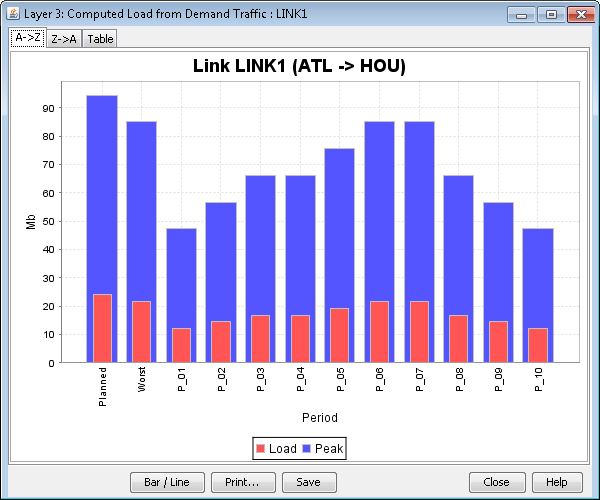
Understanding Peak Load
The peak is displayed only after performing a failure simulation. Peak load is based on the maximum utilization of a link resulting from the latest failure scenario.
After running a failure simulation script, Peak load values become available in the traffic charts. Each simulated failure results in the rerouting of demands around that failure. The new routes, carrying each demand’s traffic load, are reflected in the peak load values on the links. NorthStar Planner will compute the worst-case or peak load experienced on every link over each period over the course of the entire failure simulation sequence.
The Peak load in the Worst (second) column, reflects the value of the period with the highest peak load.
The peak planned load is also higher than the normal planned load because of the additional bandwidth required for demands rerouting over the link.
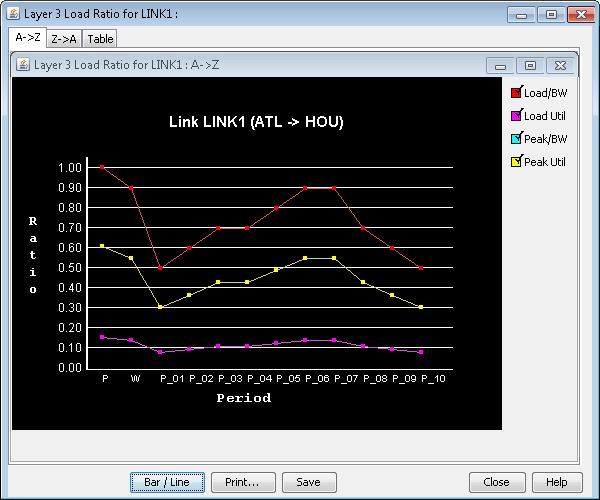
Load/BW Ratio Charts
The Load/BW Ratio chart is accessed by right-clicking on a link and choosing Traffic Load > Demand Traffic Load/BW Ratio from the popup menu.
Period (X-Axis)
P stands for planned and indicates the load based on demand bandwidths, as defined in the demand file.
W represents the load during the worst period based on demand traffic load values from the trafficload file.
Periods represent the load information based on demand traffic load values from the trafficload file.
Ratio (Y-Axis)
Load/BW: Normal Load/Total Demand Bandwidth
Load Util: Normal Load/Link Bandwidth; The utilization of the link for a particular period based on the traffic load of those demands routed over it, as given in the trafficload file.
Peak/BW: Peak Load/Total Demand Bandwidth (experienced during Failure Sim)
Peak Util: Peak Load/Link Bandwidth; The peak utilization is the highest bandwidth utilization obtained at the chosen link during the failure simulation. It will only be displayed after running a failure simulation, such as a scripted exhaustive node failure.
Measured Interface Traffic Chart
The Interface Traffic chart can be accessed either by selecting Traffic Chart > Measured Interface Traffic from the right-click menu of the NetInfo window Link tab, or by right-clicking on a link in the Map and selecting Traffic Load > Measured Interface Traffic.
This chart displays the measured interface load from the interfaceLoad_in (ingress) or interfaceLoad_out (egress) files. Note that this is different from the traffic load of demands routed over a link, where the load is derived based on the load on the demands routed over the link for a particular period. Rather, it represents the actual load measured at the link interface.