Data Collection Using SNMP
Data collection via SNMP is a useful alternative for collecting network statistics in systems where Juniper Telemetry Interface (JTI) is not available or in multi-vendor networks. You can use these statistics for performance management.
You can collect the following statistics by using SNMP collection tasks that poll the SNMP management information base (MIB):
-
Interface statistics. See Table 1 for details.
-
LSP statistics. See Table 1 for details.
Note:If the LSPs are part of a P2MP group, the P2MP group information is displayed in the P2MP Group tab in the network information table that is located at the bottom of the topology view.
-
Class of service (CoS) statistics. See Table 2 (Juniper devices) and Table 3 (Cisco devices) for details.
Note:You can collect CoS statistics only for Juniper and Cisco devices.
-
Table 1 describes the specific object identifiers (OIDs) that are collected for interface statistics and LSP statistics.
Table 1: OIDs for Interface and LSP Statistics OID Name
Counter
Vendor Type(Generic refers to all vendor devices supported in NorthStar)
1.3.6.1.2.1.2.2.1.2
ifDescr
Huawei
1.3.6.1.2.1.2.2.1.3
ifType
Huawei
1.3.6.1.2.1.31.1.1.1.1
ifName
Generic
1.3.6.1.2.1.31.1.1.1.6
ifHCInOctet
Generic
1.3.6.1.2.1.31.1.1.1.9
ifHCInBroadcastPkts
Generic
1.3.6.1.2.1.31.1.1.1.10
ifHCOutOctets
Generic
1.3.6.1.2.1.31.1.1.1.13
ifHCOutBroadcastPkts
Generic
1.3.6.1.4.1.2636.3.2.5.1.1
mplsLspInfoName
Juniper
1.3.6.1.4.1.2636.3.2.5.1.3
mplsLspInfoOctets
Juniper
Table 2 describes the specific OIDs that are collected for CoS statistics for Juniper devices.
Table 2: OIDs for CoS Statistics - Juniper Devices OID Name
Counter
1.3.6.1.4.1.2636.3.15.3.1.2
jnxCosFcIdToFcName
1.3.6.1.4.1.2636.3.15.4.1.5
jnxCosQstatQedBytes
1.3.6.1.4.1.2636.3.15.4.1.9
jnxCosQstatTxedBytes
1.3.6.1.4.1.2636.3.15.4.1.23
jnxCosQstatTotalRedDropBytes
1.3.6.1.4.1.2636.3.15.5.1.1
jnxCosIfIndex
1.3.6.1.4.1.2636.3.15.5.1.2
jnxCosIfstatFlags
1.3.6.1.4.1.2636.3.15.7.1.5
jnxCosIngressQstatQedBytes
1.3.6.1.4.1.2636.3.15.7.1.9
jnxCosIngressQstatTxedBytes
1.3.6.1.4.1.2636.3.15.7.1.23
jnxCosIngressQstatTotalRedDropBytes
Table 3 describes the specific OIDs that are collected for CoS statistics for Cisco devices.
Table 3: OIDs for CoS Statistics - Cisco Devices OID Name
Table
1.3.6.1.4.1.9.9.166.1.1.1
CISCO-CLASS-BASED-QOS-MIB::cbQosServicePolicyTable
1.3.6.1.4.1.9.9.166.1.6.1
CISCO-CLASS-BASED-QOS-MIB::cbQosPolicyMapCfgTable
1.3.6.1.4.1.9.9.166.1.5.1
CISCO-CLASS-BASED-QOS-MIB::cbQosObjectsTable
1.3.6.1.4.1.9.9.166.1.7.1
CISCO-CLASS-BASED-QOS-MIB::cbQosCMCfgTable
1.3.6.1.4.1.9.9.166.1.15.1.1.10
CISCO-CLASS-BASED-QOS-MIB:: cbQosClassMapStats.cbQosCMPostPolicyByte64
1.3.6.1.4.1.9.9.166.1.15.1.1.17
CISCO-CLASS-BASED-QOS-MIB:: cbQosClassMapStats. cbQosCMDropByte64
As of Release 5.0.0, NorthStar supports Cisco Model Driven Telemetry (MDT), a potentially faster and less costly alternative for retrieving interface and LSP traffic metrics from Cisco devices. See Support for Cisco Model Driven Telemetry for more information.
NorthStar does not support collection of SR-TE LSP statistics via SNMP.
The following tasks describe the collection process via SNMP.
Installation of Collectors
The collectors are installed in the same machine as the NorthStar Controller application server (single-server deployment) by the install.sh script when you install the controller itself. Once installed, you can see the collector group of processes:
[root@pcs-q-pod05 ~]# supervisorctl status
analytics:elasticsearch          RUNNING   pid 3374, uptime 6:33:42
analytics:esauthproxy            RUNNING   pid 3373, uptime 6:33:42
analytics:logstash               RUNNING   pid 5600, uptime 6:31:15
collector:es_publisher           RUNNING   pid 12899, uptime 0:37:03
collector:task_scheduler         RUNNING   pid 12900, uptime 0:37:03
collector:worker1                RUNNING   pid 3385, uptime 6:33:42
collector:worker2                RUNNING   pid 3387, uptime 6:33:42
collector:worker3                RUNNING   pid 3386, uptime 6:33:42
collector:worker4                RUNNING   pid 3388, uptime 6:33:42
Configure Devices in Device Profile and Test Connectivity
Before you can run SNMP collection, you must configure login credentials and SNMP parameters for the devices. In the web UI, from the More Options menu, navigate to Administration > Device Profile. Select a device and click Modify. Click the Access Parameters tab to enter login credentials and the SNMP Parameters tab to enter SNMP parameters.
See Device Profile and Connectivity Testing for detailed instructions on setting up devices with SNMP parameters, and also on testing SNMP connectivity to those devices.
Run Device Collection
You must run device collection before attempting to run SNMP traffic collection. This is necessary to establish the baseline network information including the interfaces and LSPs. Once device collection has been run, SNMP traffic collection tasks have the information they need to poll the interfaces and the LSPs.
Schedule and Run SNMP Data Collection Tasks
Completion of device profiles (Administration > Device Profile) and running device collection are prerequisites for successfully running SNMP collection.
To schedule a new SNMP collection task, navigate to Administration > Task Scheduler from the More Options menu.
-
Click Add in the upper right corner. The Create New Task window is displayed as shown in Figure 1.
Figure 1: Create New Task Window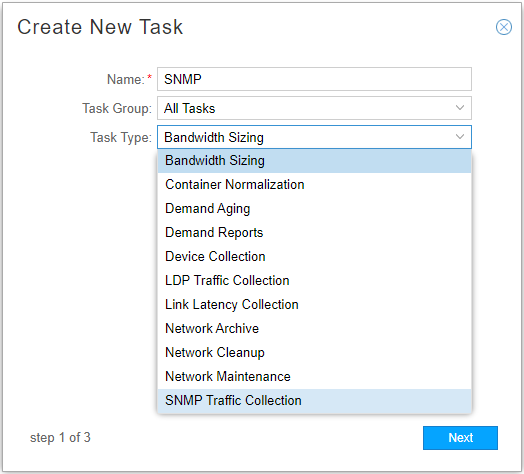
-
Enter a name for the task and use the drop-down menu to select the task type as SNMP Traffic Collection. Click Next.
The next window offers the opportunity to collect SNMP traffic for all devices, select devices, or groups. You can also click the Collect CoS data check box if you want to collect Class of Service data. CoS data is not collected unless you enable it by clicking the check box. Figure 2 shows this window.
Figure 2: SNMP Collection Task, Device Collection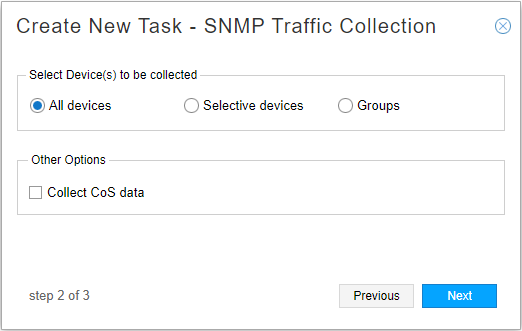 Note:
Note:If you are using Cisco MDT for some devices, you would opt for “Selective devices” and deselect devices for which you are using Cisco MDT.
-
Click Next to proceed to the scheduling window. The Create New Task - Schedule window is displayed as shown in Figure 3. At least two collections are necessary for the calculation of statistics. We recommend setting up automatic recurrence of the task every 10 to 20 minutes.
Figure 3: SNMP Collection Task, Scheduling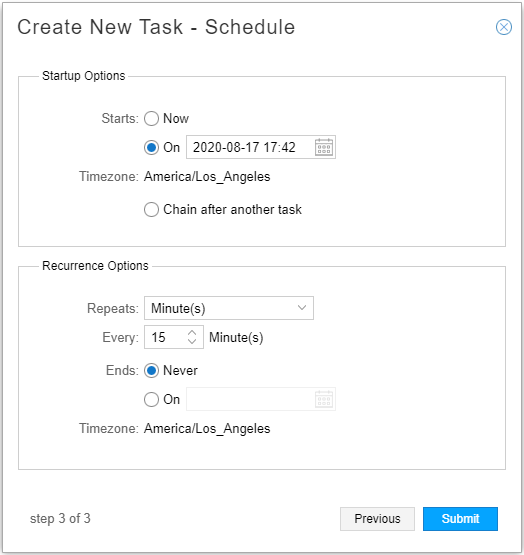
Instead of scheduling recurrence, you can select to chain the task after an already-scheduled recurring task, so it launches as soon as the other task completes. When you select the “Chain after another task” radio button, a drop-down list of recurring tasks is displayed from which to select.
-
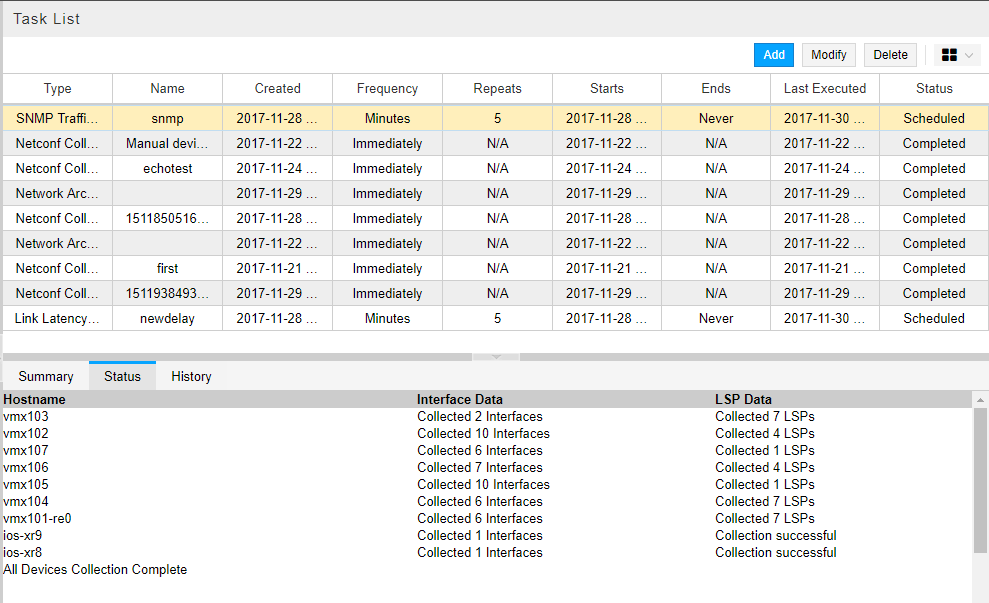
Click Submit to complete the addition of the new collection task and add it to the Task List. Click a completed task in the list to display the results in the lower portion of the window. There are three tabs in the results window: Summary, Status, and History. An example of the Summary tab is shown in Figure 4. An example of the Status tab is shown in Figure 5.
Figure 4: Collection Results for SNMP Traffic Collection Task, Summary Tab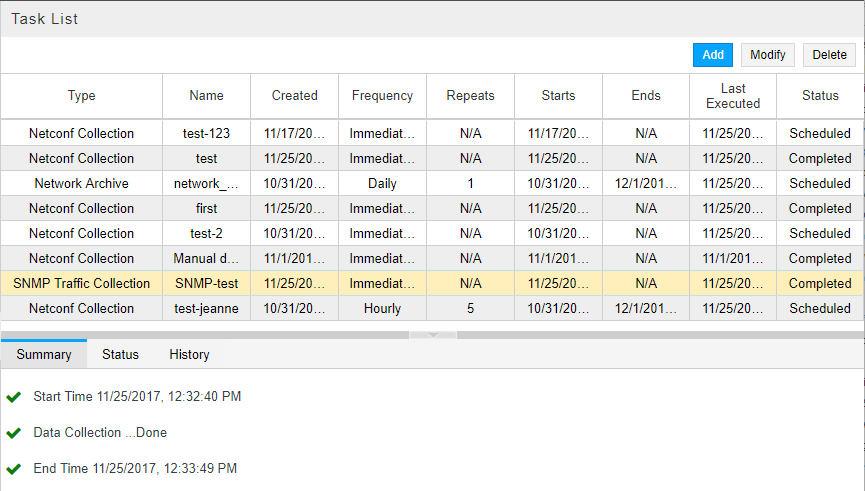 Figure 5: Collection Results for SNMP Traffic Task, Status Tab
 Note:
Note:As of NorthStar Release 6.0.1, you can have multiple SNMP collection tasks, each with its own selection of devices and schedule.
By default, NorthStar only collects statistics from the following interfaces when running SNMP traffic collection:
-
Physical, logical loopback, or logical management interfaces that can be associated with nodes in NorthStar
-
Logical interfaces associated with links in NorthStar
-
Logical interfaces belonging to a VRF
The interface types that can be discovered on devices and that should be used by traffic collection can be modified by editing the include-interface-type setting using the cMGD CLI as described in Configuring NorthStar Settings Using the NorthStar CLI in the NorthStar Controller/Planner Getting Started Guide. The command calls for a space-separated list of interface types enclosed in square brackets, or a single interface type without brackets. Some examples:
root@ns1# set northstar config-server include-interface-type [physical loopback-mgmt links-if]
root@ns1# set northstar config-server include-interface-type all
The supported interface types are:
-
physical: Physical interfaces, expressed as the interface name without a dot (.) in it
-
loopback-mgmt: Loopback and management interfaces expressed as the interface name starting with lo, fxp, me, or em
-
vrf-if: Interfaces associated with a VRF
-
links-if: Interfaces on links
-
all: All interfaces
configServer publishes to all components only the interface types that you specify. The web UI and data collection only receive information about interfaces representing those interface types.
If you modify this setting, deselecting interface types that are already represented by interfaces in the NorthStar model, those existing interfaces remain in the model.
Access the Data from the NorthStar Planner
You can access the collected data from the NorthStar Planner for planning and simulation purposes. In the NorthStar Planner, navigate to Traffic > Traffic aggregation. You can aggregate the traffic by hour and create a 24-hour traffic load file for each hour, aggregating the data for that particular hour across multiple days. The resulting file can be used as input into the traffic matrix solver.
