Audit Logs
Audit Logs keep track of changes to the network model, device configuration models, and system settings that can trigger changes in the network. They report any changes performed by API clients (including the REST API and user interface). These changes include create, modify, delete operations, and user logins. Network operators can use these logs to debug or troubleshoot any problems in the network.
An audit log captures the following information:
-
Tasks initiated by users
-
Users who initiated the tasks
-
Resources affected by the tasks
-
Status of the task
-
Date and time the tasks were initiated
Audit logs are not generated by default. To enable generation of audit logs:
-
Log in to the NorthStar Controller server.
-
Open the /opt/northstar/web/config.json file.
root@hostname vi /opt/northstar/web/config.json
-
Set
enableAuditLogto true.Note:Enabling audit logs affects performance of NorthStar Controller.
-
Restart the web_app.
supervisorctl restart web:app
To view audit logs, navigate to Administration > Audit Logs. Figure 1 shows the Audit Logs page. By default, the audit logs are sorted by the logged time in descending order; that is the most recent audit logs appear on top of the Audit Logs page.
The Audit Logs menu is visible under Administration only if:.
-
The collector_setup.json file is present at /opt/northstar/data, and
-
The
enableAuditLogparameter is set to true in the /opt/northstar/web/config.json file.
If the collector_setup.json file is not present at /opt/northstar/data, try installing analytics and enable Elasticsearch.
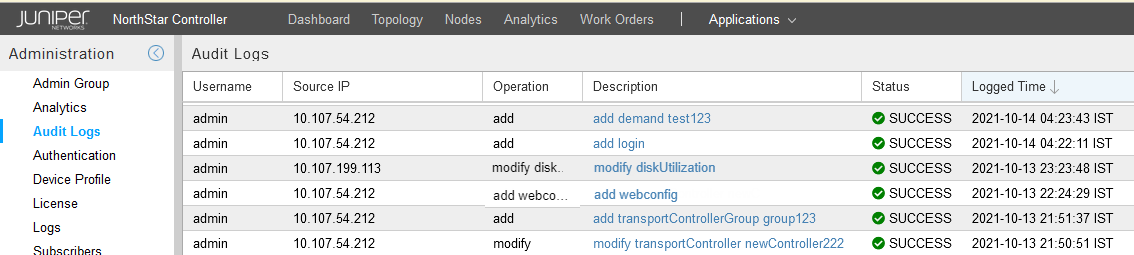
Table 1 lists the fields displayed on the Audit Logs page.
|
Fields |
Description |
|---|---|
|
Username |
User who performed the task, operation, or action in NorthStar Controller. |
|
Source IP |
IP address of the machine that initiated the operation. |
|
Operation |
Name of the operation or task. |
|
Description |
Detailed description of the task. .Hover over an audit log description to view the attributes generated for the task, in JSON format. |
|
Status |
Status of the task—SUCCESS or ,FAILED. If failed, the http error code is also displayed. |
|
Object Id |
ID of the object on which the task was performed. |
|
Object Type |
Type of the object on which the task was performed; for example, node, link, and interface. |
|
Object Name |
Name of the object on which the task was performed. |
|
Path |
Http request path of the task.. |
|
Type |
Displays audit_log. |
|
Logged Time |
Local date and time (displayed in the YYYY-MM-DD HH:MM:SS format) the audit log was generated; The time zone in which the logged time is displayed can be set in the account settings. By default, the time is displayed in the user’s time zone. |
You can perform the following activities on the Audit Logs page:
-
Refresh the page to retrieve the most recent audit logs.
To refresh, click the Refresh icon present at the bottom of the page.
-
Hover over an audit log description to view the code generated for a task, in JSON format.
-
In each column, sort the entries in ascending or descending order.
-
Show or hide columns
The Username, Source IP, Operation description, Status and Logged Time fields are displayed by default on the Audit Logs page.
To view the other hidden columns:
-
Click on the right corner of a column heading and point at Columns.
-
Select the fields that you want to view.
The fields are displayed on the Audit Logs page.
-
-
Apply filters.
You can filter audit logs based on a particular value in a field. For example, you can obtain all audit logs related to the modify node operation by entering modify node as the filter criteria in the Operation field. The Logged Time field provides the options to filter audit logs generated before, after, or on a specific date and time.
-
Export the audit logs to a CSV file
To export audit logs, click the Export to CSV File icon present at the bottom of the page.
-
Set the number of audit logs displayed per page.
To set the number of audit logs to be displayed per page, click the Table Settings icon present at the bottom of the page and enter a value in the text field under Page Size. The default value is 50.