Physical Topology
At the device level, you can view the connectivity details of a device and the details of all the devices that are connected to the specified device by using the Device Connectivity task in Network Director. The Device Connectivity page displays various details about a selected device and its immediate neighbors. The level of detail that Network Director displays in the Device Connectivity page depends on the type of device that you select.
To view the connectivity details of devices:
- While in the Logical, Location, Device, Custom, or Topology
View, under Build Mode, select the device for which you want to view
connectivity from the View pane or the network topology (in case of
Topology View) and click Connectivity > View Device
Connectivity from the Tasks pane.
The Device Connectivity page opens. You can view the device connectivity details either in graph view or in grid view. The default view is the graph view.
In the graph view, each device and its network connectivity to all the connected devices are displayed as shown in Figure 1. Mouse over a device to select a device and view details of the device.
Note:If the selected device is connected to a device that is not managed by Network Director, the latter appears dimmed in the Device Connectivity page.
Figure 1: Displaying Connection Details in Graph View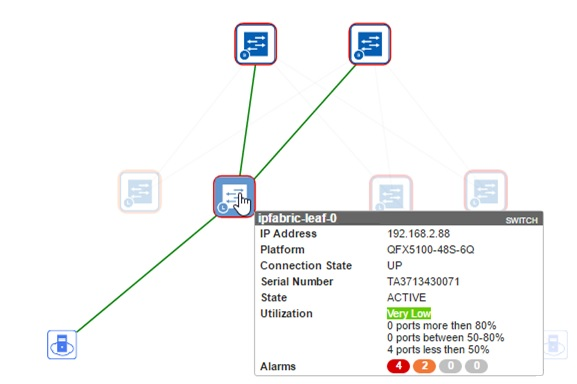
If the selected device is connected to more than sixty devices, then all the connected devices are highlighted in a circular form or a grid form. If the selected device is connected to less than 60 devices, then the links between the interconnected devices are displayed.
The device details displayed include name, IP address, and the alarm state information in colored labels that provide health and reachability information. You can also view the details of the hosts or virtual machines that are connected to the devices.
You can view the following details when you mouse over a device in the Device Connectivity—Graph view:
Note:The level of detail displayed depends on the type of device selected.
Name—The name of the device provided while configuring the device. The device name and the device type are displayed in a label.
IP Address—The IP address of the device.
Platform—The device family and platform information. For example, EX4300-24P, QFX10002-36Q, and so on.
Connection State—Connection state of the device. Connection state can be UP, DOWN, or N/A. Network Director updates and displays the connection state changes in real time.
Config State—Device state. The device state can be online/provisioned or down/provisioned.
Serial Number—Serial number of the device.
Link status—Indicates whether the link between two devices is UP or DOWN. Network Director updates and displays the link status changes in real time. It might take up to 2 minutes for the updates to reflect.
Utilization—Overall color-coded bandwidth utilization level and the breakup of bandwidth utilization by each port on the device.
Alarms—Alarm details displaying the number of critical, major, minor alarms, or info for the device. Alarms details are color coded to indicate their severity level. Network Director updates and displays the alarm status changes in real time.
Slot Number—(Applicable to Junos Fusion satellite devices) The FPC identifier of the satellite device in Junos Fusion. Slot number ranges from 65 through 255, and functions as the FPC identifier in the interface name when satellite device interfaces are being configured.
LAG—Identifies connections that are configured as LAGs as shown in the following figure.
Figure 2: LAGs in the Device Connectivity view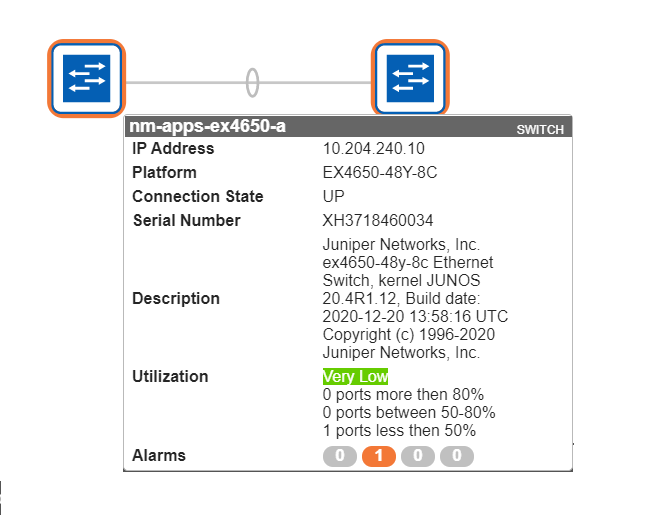
You can view the following details of virtual machines (VMs) that are connected to hosts:
Virtual Machine—Name of the virtual machine.
Host Name—Name of the host to which the virtual machine is connected to.
VNetwork—Name of the virtual network.
OS—Name of the operating system on which the virtual machine is running.
Connection State—Connection status of the virtual machine. Connection state can be UP, DOWN, or N/A.
Power State—State of the power supply: Powered On or Powered Off.
You can view the following details of the Desktop machine:
Host Name—Name of the host to which Desktop machine connected to.
OS—Name of the operating system on which the Desktop machine is running.
Connection State—Connection status of the Desktop machine. Connection state can be UP, DOWN, or N/A.
In the graph view, each networking device has a unique icon for easy identification. Table 1 describes the networking device that each of these icons indicate.
Table 1: Icons on the Device Connectivity Page Icon
Description

Juniper Networks switch

Desktop computer

Desktop IP phone

Printer

Satellite device cluster in a Junos Fusion system. Double-click this icon to view the connectivity of the devices that are part of the cluster.
- You can perform the following tasks from the graph view
of the Device Connectivity page:
Click the number adjacent to a device icon to view details about the device alarms. The Alarm Details by Severity page opens. For more details, see Alarm Detail Monitor.
For example, in Figure 3 click the number 8 to view details of the alarms on the corresponding device.
Figure 3: Alarm Count in the Device Connectivity Page
Double-click the satellite device cluster icon to expand and view the member satellite devices and their connectivity.
Click Links and select Color Code Port Utilization to view the color-coded port utilization level in the graph view. Network Director displays a port utilization legend in the upper right corner of the graph view, which you can use to identify links that are optimally used, overutilized, or underutilized and take necessary corrective actions.
Select Stop Updates, to freeze the link status changes in real time in the Device Connectivity page that might be required while the user is performing some tasks in this page.
Enter the device name, IP address, or the tag name of the device in the search field to quickly locate a device in the graphical view.
- Click Show Grid View to view the device connectivity
details in a tabular format as displayed in Figure 4. This view has
two tabs: the External Links tab and the Fabric Links tab. Clicking
the External Links tab displays the external device interface
details that are connected to the fabric devices. Clicking the Fabric Links tab displays fabric link interface details.Figure 4: Displaying the Connection Details in Grid View
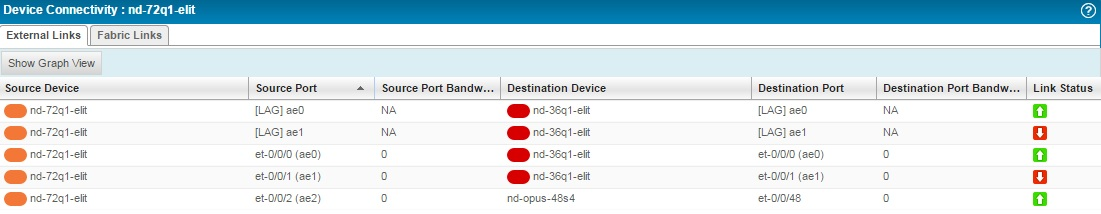
The following details are displayed in the grid view:
Source Device—Name of the device specified while configuring the device.
Source Port—Source port of the device.
Source Port Bandwidth %—Real-time percentage of bandwidth utilized at the source port.
Destination Device—Name of the destination device or devices the source device is connected to.
Destination Port—The port number on the destination device to which the source device is connected to.
Destination Port Bandwidth %—Real-time percentage of bandwidth utilized at the destination port.
Link Status—Indicates whether the link to the device is up or down.
You can sort the details in the table in the ascending order or descending order for each column. You can also use filters to display device connectivity details for specific devices. If you type a text string and click Go, entries that do not contain the text string (filter criterion) are removed from the table