Understanding the Network Director User Interface
Junos Space Network Director provides a simple to use, HTML5-based, Web 2.0 user interface that you can access through standard Web browsers. The user interface is task-oriented, using task-based workflows to help you accomplish administrative tasks quickly and efficiently. It provides you the flexibility to work with single devices or with multiple devices grouped by logical relationship, location, or device type. You can filter, sort, and select columns in tables, making looking for specific information easy.
Figure 1 illustrates the main components of the interface.
This topic describes:
Network Director Banner
Use the Network Director banner, shown in Figure 2, to select the working mode. You can also use the Network Director banner to perform other global tasks, such as setting up your preferences or accessing Junos Space. Table 1 describes the functions available to you on the banner.
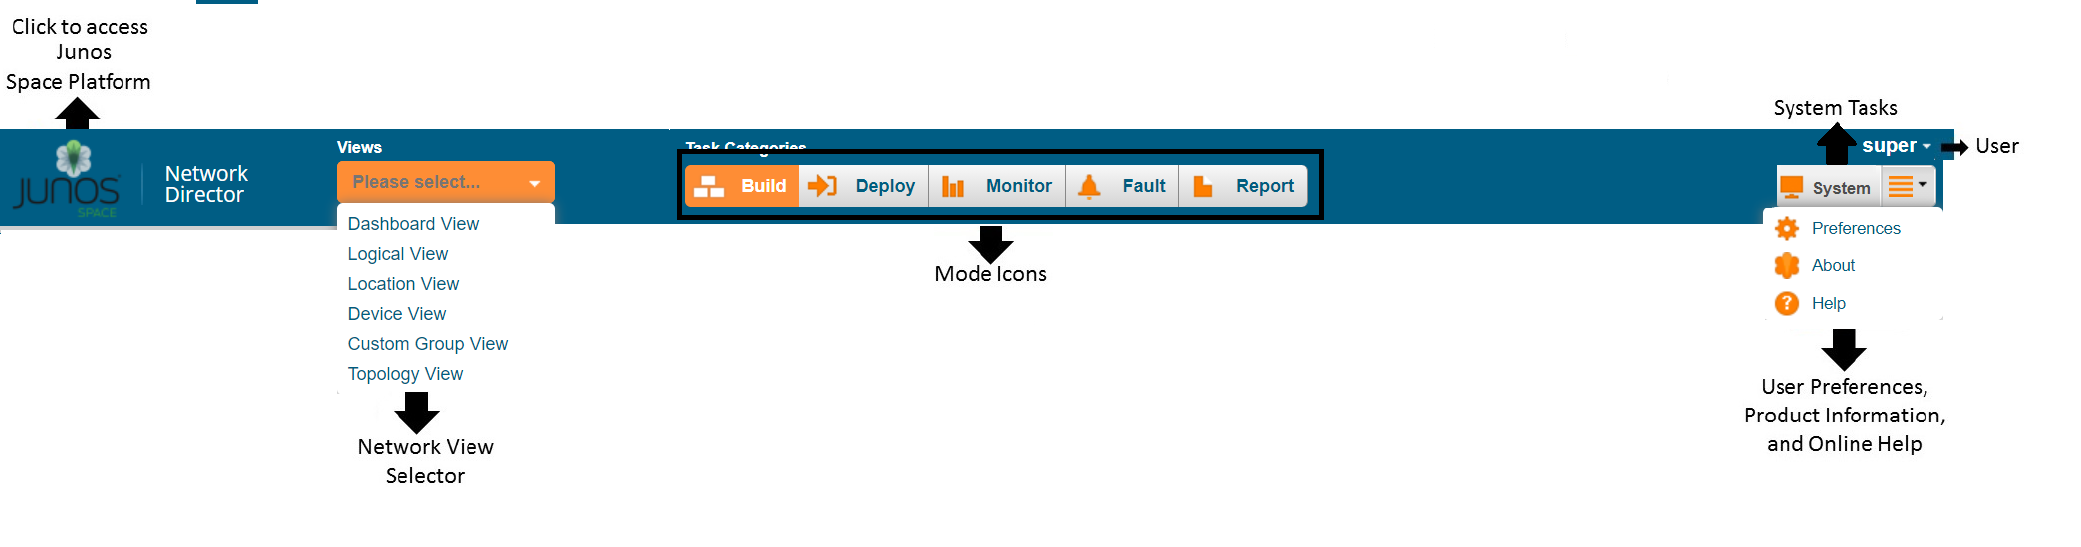
Item |
Function |
|---|---|
Accessing Junos Space Platform |
Click to exit Network Director and open the Junos Space Network Application Platform. You can switch back and forth between Network Director and Junos Space without logging in again. |
Network View Selector |
Select the network view that you want to work in. You can choose from one of the following views:
For more details, see Displaying Devices in Various Network Views. |
Mode Icons |
Select the mode you want to work in. Note:
You might not have access to all the Network Director modes. What modes you have access to depends on your assigned user role. |
User Log out |
Displays the username using which you logged in to Network Director. Click the Down arrow next to the username and select Logout to log out of Network Director and Junos Space. |
System Tasks |
Access the system tasks such as viewing audit logs, jobs, and to collect troubleshooting logs. Click the Down arrow next to System and select Preferences to set your Network Director user and system preferences. |
System Preferences, Product Information, and Online Help |
Click this button and select an appropriate option:
|

In addition to this, Network Director displays the date and time in the local time zone in the bottom right corner.
View Pane
In the View pane, Network Director provides you a unified, hierarchal view of your wired networks in the form of a expand tree that is expandable and collapsible. By selecting both a view and a node in the tree, you indicate the scope over which you want an operation or task to occur. For example:
By selecting the Access node in Logical View, you indicate that the scope for a task is all access switches under the Access node.
By selecting a floor node in Location View, you indicate that the scope for a task is all devices belonging to that floor.
By selecting the EX2300 node in Device View, you indicate that the scope for a task is all EX2300 switches in your network.
You can perform the following actions in the View pane:
- Displaying Devices in Various Network Views
- Filtering the Network Tree
- Expanding or Collapsing Nodes in the Network Tree
- Searching the Network Tree
Displaying Devices in Various Network Views
Use the selection box in the Network Director banner to choose one of the following network views:
Dashboard View—This is a is a customizeable view that provides information about your network, and is the default view that opens when you log in. You can select and add monitoring widgets to the Dashboard View based on your requirements. This is the default view that opens when you log in to Network Director.
Logical View—Devices are organized by their logical relationships in the network. All switches appear in the Switching Network and are categorized by their role in the network: access, aggregation, or core.
Network Director builds most of this view for you as you discover devices. However, you need to manually assign switches to the access, aggregation, or core categories.
Location View—Devices are organized by their physical locations. You build this view by creating sites, building, floors, aisles, racks, outdoor areas, and then assigning your switches to these locations.
Device View—Devices are organized by device type: switches Within device type, devices are organized by device model. For example, all models of EX2300 switches are grouped together under one node in the tree.
View—Displays devices that are part of your network
Custom Group View—If you have defined one or more custom groups, Network Director displays these custom groups in this view. You can manually add devices to a custom group or define a rule to automatically add devices to the custom group once they are discovered in Network Director. The devices are grouped under each custom group.
Topology View—Topology enables you to view all the discovered devices in your network, overlaid on a map where the devices are located across sites, buildings, floors, closets, aisles, and racks along with their physical interconnection with other devices in your network. Topology also provides visualization around physical and logical connectivity between various discovered interconnected devices.
Filtering the Network Tree
To make it easier for you to focus on selected aspects of your network, you can apply predefined filters to your network tree so that only nodes and devices that meet the filter criteria are shown. For example, you can apply a filter so that only devices in a specific building are shown in the network tree in all views.
To apply filters:
Click the filter icon:
In the Filters dialog box, click Show available filters.
The Available Filters section of the dialog box appears.
Under Available Filters, click the tab for the view you want to use to define your filter. For example, if you want to filter on devices—that is, show only certain types of devices–click the Device tab.
The filters that you can apply are listed below the tab.
To select a filter, click its associated plus icon.
The filter appears in the Selected Filters section of the dialog box. You can repeat Steps 3 and 4 until you have selected all the filters you want apply.
Click Apply.
The Filters dialog box closes and the filters are applied. The filter icon changes appearance to indicate that filters have been applied:
To remove a filter, click the filter icon, click the trash can next to the filter in the Selected Filters list, and click Apply.
Expanding or Collapsing Nodes in the Network Tree
To expand a node in the network tree, select the node and then click the Expand All icon:
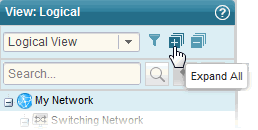
The node you selected and any child nodes under the selected node are expanded to show their contents.
Similarly, to collapse a node in the network tree, select the node and then click the Collapse All icon (next to the Expand All icon). The node you selected is collapsed and no nodes under it are shown.
Searching the Network Tree
To quickly find and select a device or device group, use the search function.
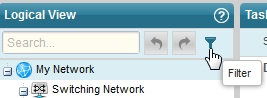
To perform a search, type three or more characters into the Search box and click the Search icon, as shown in Figure 3.
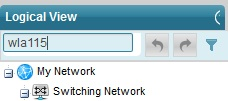
Network Director finds the first instance of a node whose name contains the characters. To find the next instance, click the right arrow.
Searches are not case-insensitive: a search on wla115 and one on WLA115 return the same results.
Tasks Pane
The Tasks pane is available in every mode and lists tasks specific to that mode. In addition to changing according to the mode selected, tasks listed in the Tasks pane can change as you select different scopes in the View pane. For example, some tasks are appropriate only at the device level and thus appear only when you have selected an individual device.
Clicking a task brings up task-specific content in the main window.
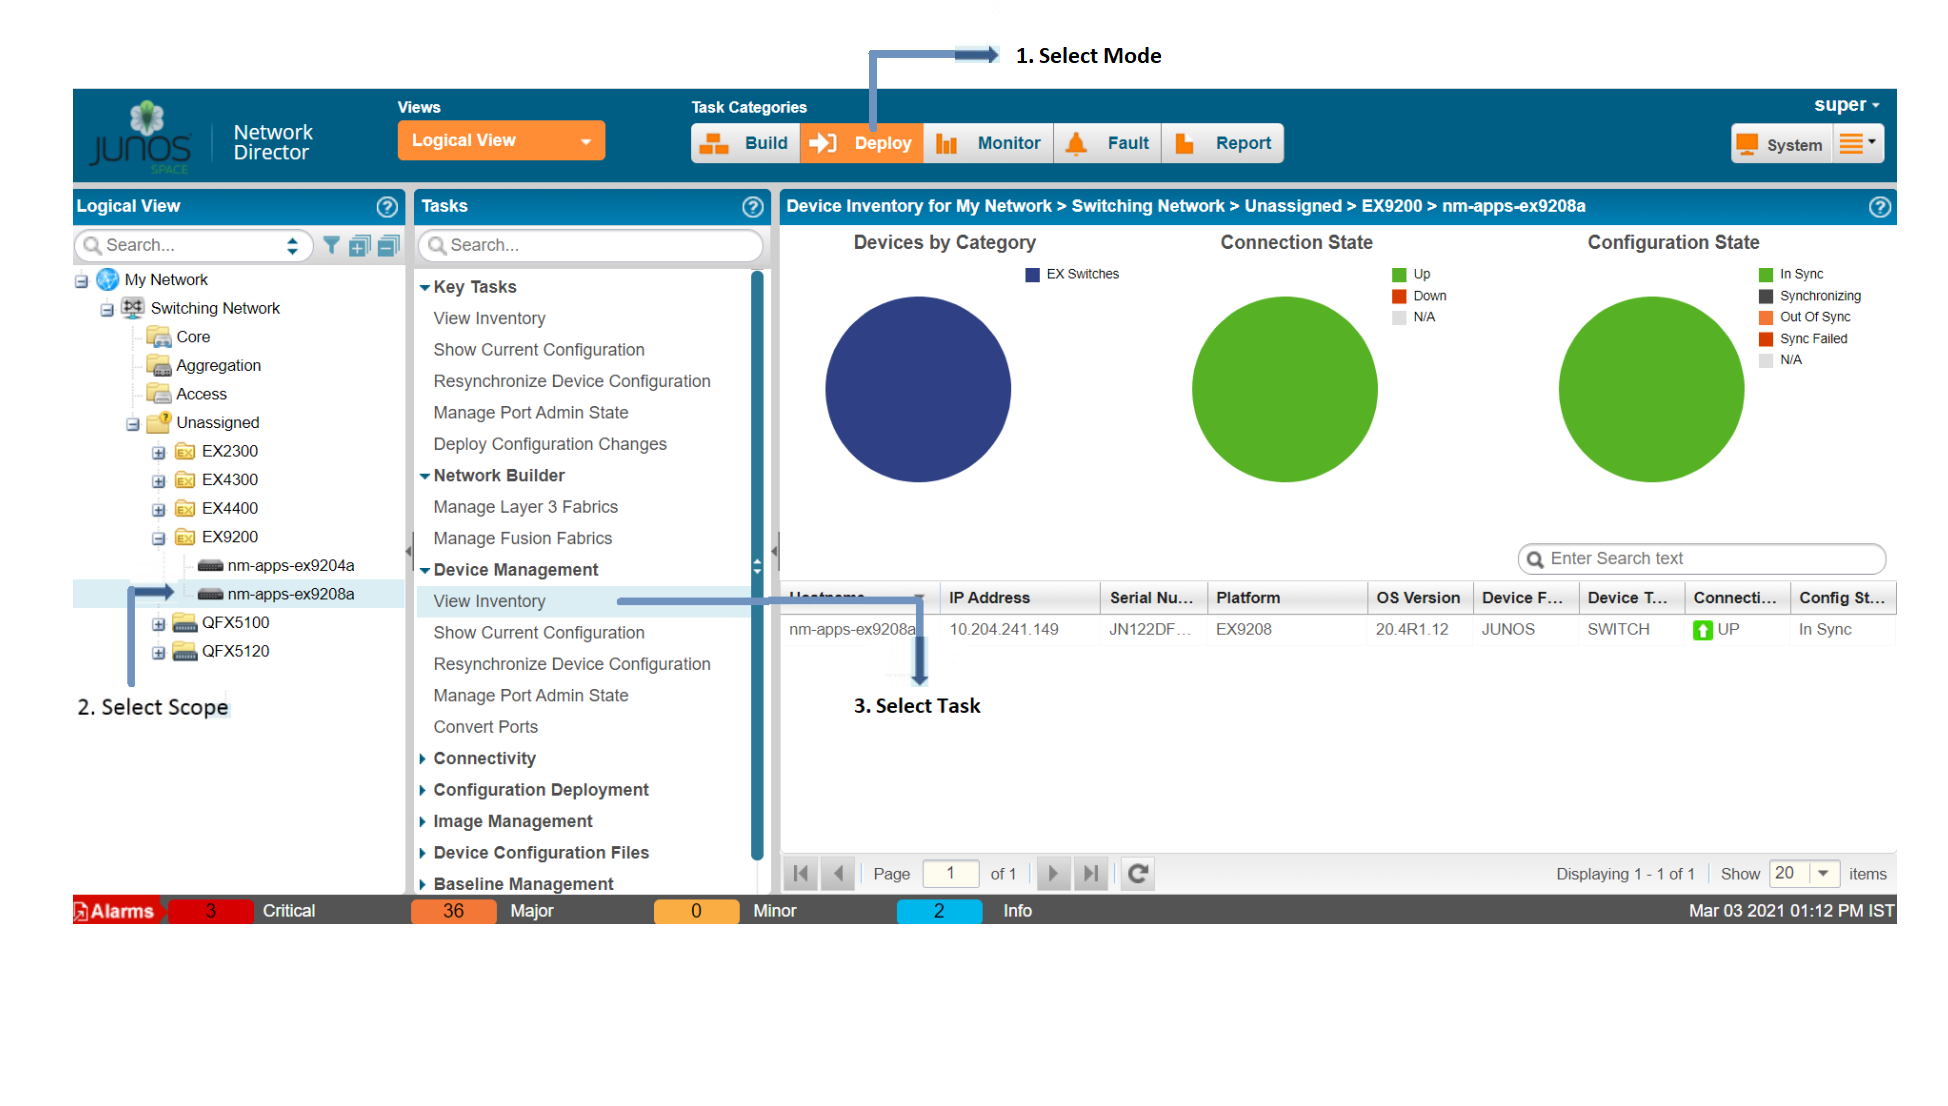
In general, to perform a task in Network Director, you navigate to the task as shown in Figure 4. You select your mode, your scope, and then your task.
The location of the Tasks pane changes with mode. In Build and Deploy mode, it is adjacent to the View pane. In Monitor, Fault, and Report mode, it located to the right of the main window.
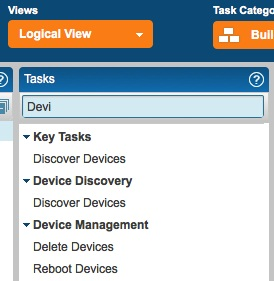
Use the Search box in the Tasks pane to easily locate a task, as shown in Figure 5. To perform a search, type three or more characters into the Search box and press Enter.
Alarms
The Alarms bar that is displayed at the bottom of your browser window provides a quick summary of how many critical, major, minor, and info alarms are currently active in the network and is visible in every mode. To display more information about alarms, click the alarm count or the Alarms banner. You are automatically placed in Fault mode and the Fault mode monitors are displayed.
Main Window or Workspace
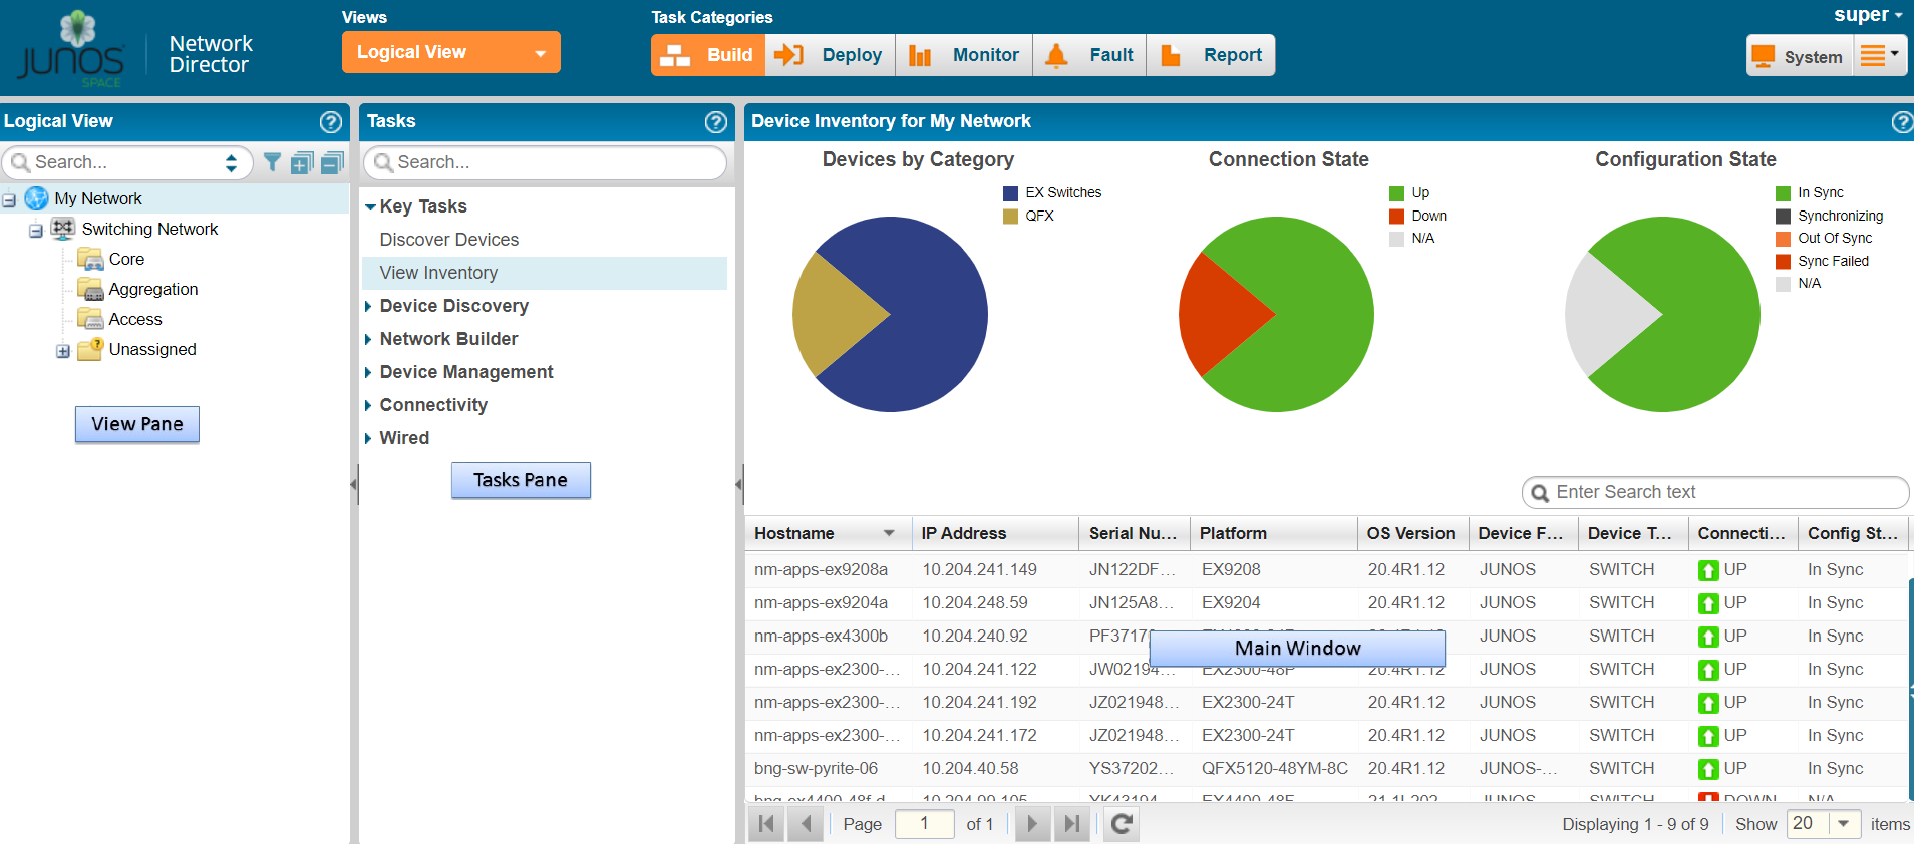
The main window or workspace displays the content relevant to the mode, scope, and task you have selected. When you log in to Network Director, this pane displays the Device Inventory page. The Device Inventory page is the default landing page for Build and Deploy modes. It contains a list of the devices for your current scope. It includes pie charts that permit you to see at a glance the connection states, configuration synchronization states, and device-type distribution for your devices.
Tables in Network Director
Tables are used throughout Network Director to display data. These tables share common features. By becoming familiar with these features, you can navigate and manipulate tabular data quickly and efficiently. The following sections describe:
- Moving and Resizing Columns
- Displaying the Column Drop-Down Menu
- Sorting on a Column
- Hiding and Exposing Columns
- Searching Table Contents
- Filtering Table Contents
Moving and Resizing Columns
You can reposition and resize columns in a table. To move a column, drag and drop the column head to the new location. Network Director displays a green check mark when you mouse over a valid column location.
To resize a column, mouse over the edge of a column until the cursor becomes two vertical lines with outward arrows. Drag the column width to the new size.
Displaying the Column Drop-Down Menu
A drop-down menu is available from each column head, allowing you to perform additional operations on columns. To display the column drop-down menu, mouse over the column head. A downward arrow appears. By clicking the arrow, you display the drop-down menu, as shown in Figure 6.
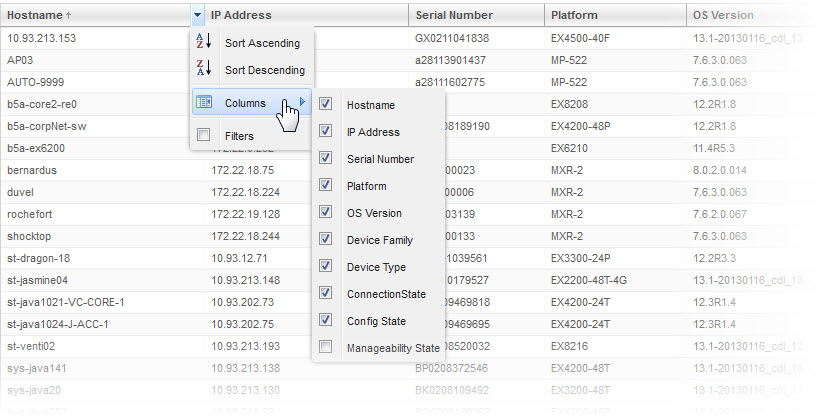
Sorting on a Column
You can sort the table on a column by clicking the column head—each click changes the direction of the sort. In addition, you can use the Sort Ascending and Sort Descending options in the drop-down menu.
When you sort on a column, a small arrow appears next to the column name to indicate that the table is being sorted by the column and the direction of the sort.
Network Director uses a lexical sort for tabular data that is not strict numeric data, which means that data such as IP addresses do not sort in numerical sequence, as shown in Table 2.
Numerical Sort |
Lexical Sort |
|---|---|
10.93.200.65 |
10.93.200.129 |
10.93.200.129 |
10.93.200.199 |
10.93.200.199 |
10.93.200.65 |
Hiding and Exposing Columns
You can customize your tables by hiding or exposing columns. This way, you can choose to see only relevant information.
To hide or expose columns, display the drop-down menu for any column head and mouse over the Columns option, as shown in Figure 6. Select a column to expose it—clear a column to hide it.
As a general rule, Network Director displays all columns in a table by default. However, some tables have more columns than can fit easily within the page. In these tables, some columns are hidden by default.
Searching Table Contents
You can search for specific data in large tables by using search criteria.
To search for an item in a table, enter the search term in the text box. Select ANY for Network Director to search for the term in all columns in the table. Every table has a predefined default column that the system searches first; before it proceeds to search other columns.
You can also choose to search a particular column for a term. Network Director displays a list of all the columns in a table. To search a particular column for a term, select that column for the list.
When you enter a search expression, note the following:
You must add a back slash “\” if you want to use the following special characters in the search text:
+ ~ && || ! ( ) { } [ ] ^ “ ~ * ? : \
Field names are case-sensitive.
For example, if you have a few systems running on Junos OS 19.1 Release 1, then os: 19.1R1 returns search results, whereas OS: 19.1R1 does not return search results. This is because the field name that is indexed is os and not OS.
If you want to search for a term that includes a space, enclose the term within double quotation marks.
For example, to search for all devices that are synchronized (that is, In Sync), enter “In Sync” in the Search field.
You must append "*" if you want to search using partial keywords. Otherwise, the search returns 0 (zero) matches or hits.
You can filter search results by specifying one or more search terms. Network Director uses the AND operator for each search term that you enter. Network Director lists the search results in the table, depending on the search criteria that you specified.
For example, perform the following steps to search for an EX2300 switch that is running Junos OS Release 19.1:
Enter EX2300 as the search term in the text box.
From the list that appears, select to search the Platform column.
Network Director lists all the EX2300 switches in your network.
Enter 19.1 as the search term after the comma separator in the text box.
From the list, select to search from the OS Version column.
Network Director lists all the EX2300 switches in your network that are running Junos OS Release 19.1.
Filtering Table Contents
For large tables, it is helpful to be able to sort data to show only relevant entries. When you mouse over the Filters option in the column drop-down menu, a fill-in box appears where you can type filter criteria. If you type a text string and click Go, entries that do not contain the text string (filter criterion) are removed from the table. A red asterisk appears on the column head to indicate that the column has been filtered. To restore all entries to the table, clear the Filters option.
For example, to filter the Device Inventory page so that only devices in the 192.168.1.0 subnet are displayed:
Mouse over the right side of the IP Address column head to expose the downward arrow.
Click the arrow to display the column drop-down menu.
Mouse over Filters to display the Filter field.
Type 192.168.1. in the field and click Go.
Only the devices in the 192.168.1.0 subnet are shown.