Monitoring Juniper Networks Devices from vROps
After you add and configure Juniper Networks Data Center Switching Management Pack for vROps, vROps discovers and builds the data center network managed by Network Director in vROps. vROps also adds five dashboards to the vROps Dashboards list. Each dashboard contains various dashboard widgets that assist administrators to monitor and manage multiple data center from vROps without having to switch to a different network management application.
vROps adds the following dashboards to the Dashboards list:
Juniper Infrastructure Overview
Juniper Network Fabric Monitoring
Juniper Network Fabric Member Monitoring
Juniper Top Network Fabrics
Juniper Top Network Fabric Members
This topic describes:
Using the Juniper Infrastructure Overview Dashboard
Enables you to view the topology and monitor the health of the data center network, by providing widgets. The Datacenter Overview widget displays all the data centers, underlying fabrics, hosts, and the connected virtual machines. If you click any data center to select it, the widget highlights the fabrics, hosts, and virtual machines that are part of that data center. You can view the top alerts, if any, for the selected data center in the Top Alerts widget. The Object Relationship widget displays the connectivity between the data center and the fabrics.
You can also filter the Datacenter Overview widget and the Object Relationship widget by two criteria—Health and Risk.
The Juniper Infrastructure Overview dashboard gives you an overview of the topology of the data center network and also enables you identify the top alerts for each data center network. The Figure 1 shows the Juniper Infrastructure Overview dashboard comprising of three widgets—Datacenter Overview, Top Alerts, and Object Relationship. These widgets display all the data centers, underlying fabrics, host devices, and virtual machines that are part of your data center network. Each of these entities are grouped under the respective categories.
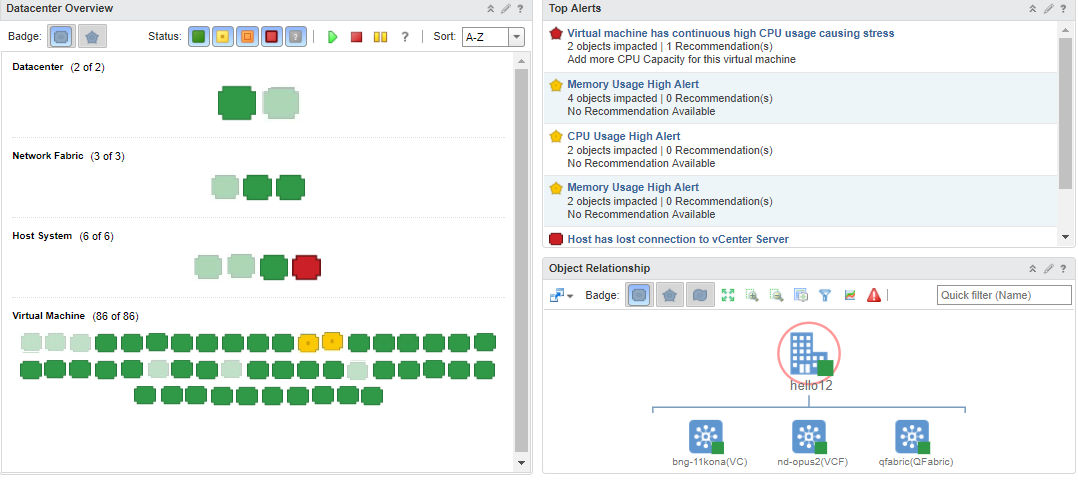
You can perform the following tasks from the Juniper Infrastructure Overview dashboard:
- View the Data Center Connectivity
- View the Top Alerts for your Data Center
- View Relationship Between Various Devices in the Data Center
View the Data Center Connectivity
You can view the connectivity between the various devices that form your data center, by using the Datacenter Overview widget. You can do the following:
Select a data center, network fabric, host device, or a virtual machine to display the connected devices that form that data center. For example. if you select a data center, vROps highlights the connected network fabrics, host devices, and virtual machines in the Datacenter Overview widget.
In the Figure 2, you can see that the data center hello12 is connected to two network fabrics which is connected to two host devices. The host devices host a set of virtual machines between them and these are highlighted in the Virtual Machines section.
Figure 2: Datacenter View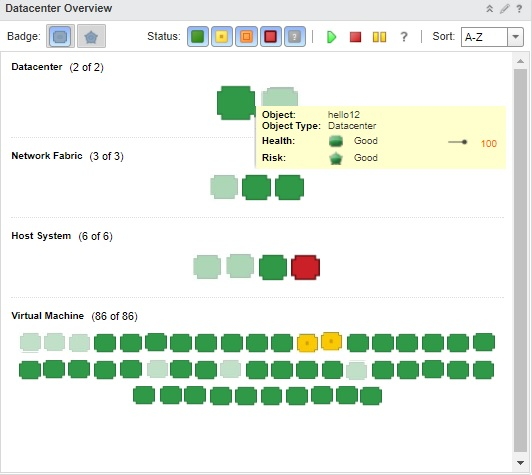
View devices using two different modes—Health and Risk. Use the Health
 and the Risk
  buttons to view data center devices in the
respective modes (see Figure 2). These modes display device icons of different colors based
on the health and risk status of a device.Table 1 describes
what each device icon color indicates in each of these modes.
buttons to view data center devices in the
respective modes (see Figure 2). These modes display device icons of different colors based
on the health and risk status of a device.Table 1 describes
what each device icon color indicates in each of these modes.Table 1: Descriptions for Device Icons Based on Their Colors Device icon color
In Health Mode
In Risk Mode

Indicates that the device works fine.
Indicates that there are no risks or threats identified as of now.

Indicates one or more minor issues in the device that might not impact the functioning of the device–for example, memory contention.
Indicates that the device has one or more minor risks that might not impact the functioning of the device. These include high CPU utilization, high memory utilization, high port utilization, high port latency high, or high port packet drop rate.

Indicates an issue in the device that might impact the normal functioning of the device—for example, redundant connectivity or a disk Input/Output write latency issue.
Indicates that the device has major risks that can impact the normal functioning of the device.

Indicates a major issue in the device that needs to be fixed immediately—for example, the link between two devices is down.
Indicates major risks that need immediate attention.
View the Top Alerts for your Data Center
You can view the top alerts for your data center in the Top Alerts widget.
To view the alerts:
- From the Top Alerts widget, you can:
View the severity of the alert based on the color of the alert badge. Table 1 describes what each icon color indicates in the Health mode and the Risk mode.
Click the short description of the alert to open and view a summary of the alert and the corrective action that you must take to get rid of the alert.
vROps opens the Risk Issues page as shown in Figure 3. This page displays the details about the alert and a table listing the alerts.
Figure 3: Risk Issues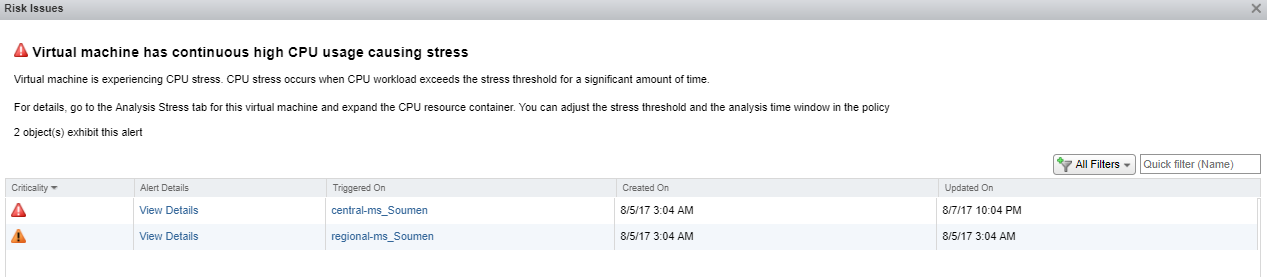
Click View Details in the Alert Details column to view the alert details.
The Alert Details opens, which displays details about the alert.
You can also click on the alert name in the Triggered On column to view the review the summary alert information for hosts and virtual machine.
You can enter the alert name in the Quick filter (Name) field to display details of that only that alert in the table.
Close the Risk Issues page to return to the Home page.
View Relationship Between Various Devices in the Data Center
You can view the relationship between devices in the Object Relationship widget.
To view relationship between devices:
- Select an object in the Datacenter Overview widget.
vROps displays the connection between the selected object and the connected devices. For example, if you select a host system in the Datacenter Overview widget, vROps displays the connected network fabric and the virtual machines that are part of the host system, in the Object Relationship widget as shown in Figure 4.
Figure 4: Object Relationship Between Hosts and Virtual Machines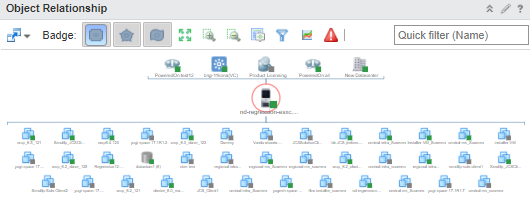
- From the Object Relationship widget, you can:
Toggle the Health
Risk, and Efficiency  badges to view devices based on the health, risk, or efficiency.
 Click
 to view the list
of alerts for the devices that are displayed.
to view the list
of alerts for the devices that are displayed.
Using the Juniper Network Fabric Monitoring Dashboard
Enables you to monitor Juniper devices that are part of a data center, by providing dashboard widgets. You can view the list of fabrics that are part of the data center in the Network Fabrics widget. You can then select a fabric from the list to see the CPU utilization and memory utilization of the fabric in the CPU Utilization History and Forecast widget and the Memory Utilization History and Forecast widget respectively.
The Juniper Network Fabric Monitoring dashboard enables you to monitor Juniper Networks fabric devices such as Virtual Chassis, Junos Fusion data center fabric, QFabric systems, Layer 3 Fabrics, and Virtual Chassis Fabric that are part of a data center, using the following widgets:
Network Fabrics widget
CPU Utilization History and Forecast widget
Memory Utilization History and Forecast widget
To open the Juniper Network Fabric Monitoring dashboard:
While in the vROps home page, select Juniper Network Fabric Monitoring from the Dashboard List.
The Juniper Network Fabric Monitoring dashboard opens.
You can use the Juniper Network Fabric Monitoring dashboard to:
View Data Center Fabric Details
The Network Fabrics widget displays the list of network fabrics that are part of all the data centers that are managed by Network Director. Table 2 describes the fields that are displayed in the Network Fabrics widget.
Field |
Description |
|---|---|
Name |
Name of the device. |
Description |
Short description of the device. |
Adapter Type |
Type of adapter. |
Object Type |
Type of object. |
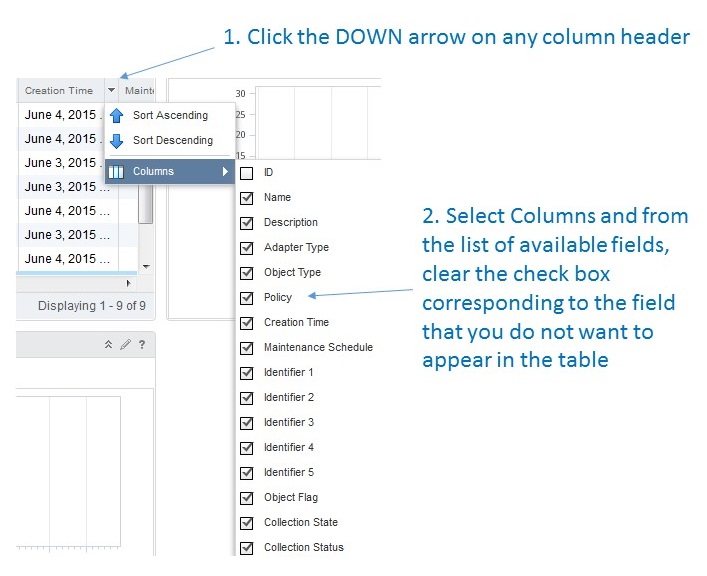
By default, the table displays a few prefiltered fields. However, you can filter the table to display the fields that you want to, by following the steps shown in Figure 5.
View CPU and Memory Utilization History and Forecast of a Fabric
Select a fabric from the Network Fabrics table. vROps displays the CPU utilization and the memory utilization of the selected fabric in the CPU Utilization History and Forecast widget and the Memory Utilization History and Forecast widget respectively. You can use these widgets to view the historical, current, and the projected CPU and memory utilization for the selected fabric. The historic utilization data and the utilization forecast data are plotted in different colors as shown in the legend under the utilization graph.
Using the Juniper Network Fabric Member Monitoring Dashboard
Enables you to monitor the fabric members of each Juniper device, that is part of a data center, by providing dashboard widgets. You can view the list of fabric members that are part of the device in the Network Fabric Members widget. You can then select a fabric member from the list to view the CPU utilization and memory utilization of the member in the CPU Utilization History and Forecast widget and the Memory Utilization History and Forecast widget respectively.
The Juniper Network Fabric Member Monitoring dashboard enables you to monitor the members of Juniper Networks fabric devices such as Virtual Chassis , Virtual Chassis Fabric that are part of a data center, using the following widgets:
Network Fabric Members widget
CPU Utilization History and Forecast widget
Memory Utilization History and Forecast widget
To open the Juniper Network Fabric Member Monitoring dashboard:
While in the vROps home page, select Juniper Network Fabric Member Monitoring from the Dashboard List.
The Juniper Network Fabric Member Monitoring dashboard opens.
You can use the Juniper Network Fabric Member Monitoring dashboard to:
View Fabric Member Details
The Network Fabric Members widget displays the list of fabric members that are part of the network fabrics managed by Network Director. Table 3 describes the fields that are displayed in the Network Fabric Members widget.
Field |
Description |
|---|---|
Name |
Name of the member device. |
IP Address |
IP address of the member device. |
Member Type |
Indicates whether the member device belongs to a QFabric, Virtual Chassis Fabric, or a Layer 3 Fabric. |
Device Name |
Name of the data center fabric to which the member belong. |
Collection State |
Indicates the status of data collection from the member. |
View CPU Utilization and Memory Utilization of a Fabric Member
Select a fabric member from the Network Fabric Members table. vROps displays the CPU utilization and the memory utilization of the selected member in the CPU Utilization History and Forecast widget and the Memory Utilization History and Forecast widget respectively. You can use these widgets to view the historical, current, and the projected CPU and memory utilization for the selected fabric member. The historic utilization data and the utilization forecast data are plotted in different colors as shown in the legend under the utilization graph.
Using the Juniper Top Network Fabrics Dashboard
Enables you to view and identify potential performance issues in your data center. The dashboard provides four widgets—The Top Network Fabrics by CPU Utilization widget, the Top Network Fabrics by Memory Utilization, the Top Noisiest Network Fabrics based on Alerts widget, and the Top Volatile Network Fabrics based on Metrics widget. You can click a row to view more details about that fabric and possible causes for the vulnerability of the fabric, if any.
You can view the top network fabrics based on CPU utilization, memory utilization, alerts, and volatility metrics by using the Juniper Top Network Fabrics dashboard. This dashboard enables you to assess the health of your data center network by identifying the fabrics that have a high CPU or memory utilization and large number of alerts.
To open and view the Juniper Top Network Fabrics dashboard:
- Select a fabric and click
 to view more details about the selected fabric.
Using the Juniper Top Network Fabric Members Dashboard
This dashboard displays member details only for Virtual Chassis and Virtual Chassis Fabric devices.
Enables you to view the performance of network fabric members, in terms of CPU utilization, memory utilization, alerts, and metrics. This dashboard provides four widgets—Top Network Fabric Members by CPU Utilization widget, Top Network Fabric Members by Memory Utilization widget, Top Noisiest Network Fabric Members based on Alerts widget, and Top Volatile Network Fabric Members based on Metrics widget.
You can view the top network fabric members based on CPU utilization, memory utilization, alerts, and volatility metrics by using the Juniper Top Network Fabrics dashboard. This dashboard enables you to assess the health of your data center devices by identifying the members that have a high CPU or memory utilization and alerts.
Juniper Networks Data Center Switching Management Pack for vROps supports only fabric devices—Virtual Chassis, Virtual Chassis Fabric, QFabric, or Layer 3 Fabric, Junos Fusion data center fabric—that are part of a datacenter in Network Director.
To open and view the Juniper Top Network Fabric Members dashboard
- Select a fabric member and click to view more details about the selected member.