Marvis Query Language
SUMMARY Start using the Marvis Query Language to structure queries that pull data from Marvis.
The Marvis Query Language provides a structured framework for querying Marvis to get data that helps you monitor or troubleshoot your network. You can use queries to quickly find details about an event or failure in your network and about the affected devices.
Video Demo
In today's product highlights, we are going to cover the query language aspect of Marvis. With a query language, what you get is a structured format of asking a query which will result in the raw or the tabular data. This is very powerful when you want to quickly find out if a certain event or a certain type of failure is actually occurring in your environment and which all devices are impacted by that.
There are additionally other features as well which we can go through which take us beyond the simple aspect of searching for a certain event and seeing the impact. So, let's get started. The one I'm going to walk through today and go through is the list query.
So, I simply select the option from the drop down, hit my spacebar key and go through the different options. In our case, I'll go through list client events with, I'll go for an event type. Say we're interested in DHCP and we're looking for DHCP failures.
So, let's take DHCP denied and we want to see it for a certain WLAN and this is the only place in the system which you can filter out based on WLAN. So, I'm going to search on my WLAN call live demo and see what the results are. So, right away we can see there are 56 such events where the DHCP was denied but all the pertinent information with respect to which client, what's the one who called that event, the WLAN we already specified, it's the WLAN live demo do not remove, the IP address it had before or what it was trying, the AP in terms of the BSSID, protocol, band, channel, so on and so forth.
You can definitely drill deeper into each event if you click on this option here and see that this indeed was a DHCP negative acknowledgement, usually seen when the client is trying to ask for an IP address which is already in use or which is not in that subnet. Additionally, you can also download this entire list so that you can take it offline and then slice and dice it based on your requirements. The next piece I'll go through is with respect to the AP, so I'll clear this out and we'll go back to list.
This time I'll do AP events with AP event type and one of the most popular ones we know about and we know you care about is APs which are disconnected and that's the one we'll focus on today. So right here we can see these are the, this is the only AP which is disconnected but of course you may want to look at it on a more historical time window and again this is the only place in the system where not only till seven days, you can also go as far as 30 days worth of data since it's the raw data, be able to present it to you for a longer time window to see what all went through during that time period. For our purpose today, I'll just select seven days since most of the times that's a good window to look at for APs which are disconnected with all the required information of what the AP is, what site it was at, so on and so forth.
Let's move on to the next use cases of listing and in our case, I'll go for listing switch events. Again, this is the net new feature in addition to the Wi-Fi based event querying where you can now get to listing Juniper EX switch events with respect to whatever is of interest to you. In my case, we'll say with switch event type and I want to take a look at if there were any significant STP topology changes in my environment during the last seven days.
Here you can see these are the switches which had their STP topology changed and as discussed earlier, more details about which the root ID was, what was the root cost, the port, so on and so forth. This is one such way you can use query language. Again, we went through the list query looking at the client's access point switches for different event types.
I highly recommend you go through the other list query options and see what all may be of use to you further. Additionally, there are other query options as well such as listing the count of certain entities, ranking them. The one I'm going to focus on and which is of supreme importance especially in troubleshooting is the roaming off query.
So, I'm going to select roaming off. I can continue using the same site called live demo or you can select any other site of your choice and I'm going to pick a sample client such as one of these iPhones here and look at its roaming behavior during the last seven days. So, right away we can see here all the APs this client was connected to and then the client's experience in terms of roaming.
Now, why this is crucial is for a number of reasons. One, you get the complete picture of where all the client has been especially during the trouble ticket time window and also Marvis highlights and tells you if the roaming was good or bad and if it was bad, what was the reason it was bad as well. For instance, let's take this one case here where we do see overall the roaming looks good but let's zoom in into this time window and see what may have happened.
As an example, we can see here this client was majorly on this EBC AP and for all purposes its connection was good until it decided to go to this test bed AP where we can see clearly Marvis highlighting it's a bad room because the RSSI significantly dropped. Similarly, the client had changed the WLAN or also changed the band. Marvis highlights it for you so that you don't have to hunt and peck to figure out that was the root cause of the client experiencing an issue during that time window.
Additionally, for different views of how the client roamed, we have the floor plan view. As the name suggests, this walks us through where all the client has been so that we understand if a client did make the correct roaming decision or was it sticking on an older access point or did it indeed skip access points when it was transisting through that site. In this case, you can see it started from the GSW AP, pretty much makes its way to other APs which are in line with its path until we get to the AP where we do see the issue and you can see here is where Marvis had flagged the issue and if you look at the AP before it, this AP was far away from the current AP where it had a poor experience.
So that does give you insights into how the client experienced roaming or how the client roamed. As we know, roaming is a client decision which AP to connect to, when to connect to are all client-based decisions. In this case, we can see Marvis highlighted this since the RSSI drop was significant when it moved to this IDF AP.
And finally, for the raw data analysis, we do provide the tabular view where apart from it being downloadable, you can also go through the entire journey in terms of the metrics of the client, everything to do with if it changed the WLAN, the band, and also the old and new RSSI with respect to the different access points so that you can directly pinpoint as to the time window when the trouble came in and what the experience was for the client when it roamed.
Marvis Query Language Structure
A query can contain the following elements:
-
Query Type—Defines what you want Marvis to do (for example, COUNT, LIST, RANK, LOCATE, or TROUBLESHOOT).
-
Value—Specifies a unique value that is specific to an organization, such as a client's name.
-
Query Object—Indicates Mist-defined objects (for example, APEvents, ClientEvents)
-
Clause—Acts as a qualifier for the overall query (for example, of, with, or by).
-
Filter Type—Narrows the results based on pre-defined filter types.
You can also add a duration to the end of a Marvis query. Note that you need to press the space bar after entering each element to see the available options.
Finding the Marvis Query Page
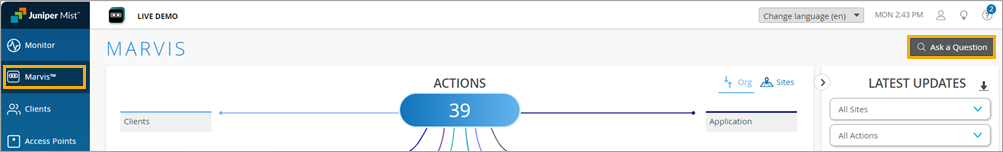
Select Marvis in the left menu of the Juniper Mist™ portal, and then click the Ask a Question button at the top-right corner of the Marvis Actions dashboard.
Entering a Structured Query
Marvis guides you step by step to enter the required elements in the query.
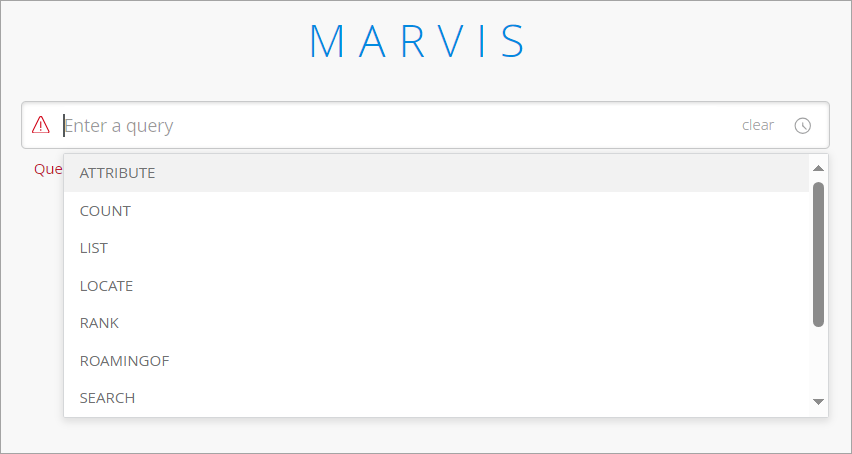
To get started, click in the Enter a query text box. Then click one of the options in the drop-down menu.
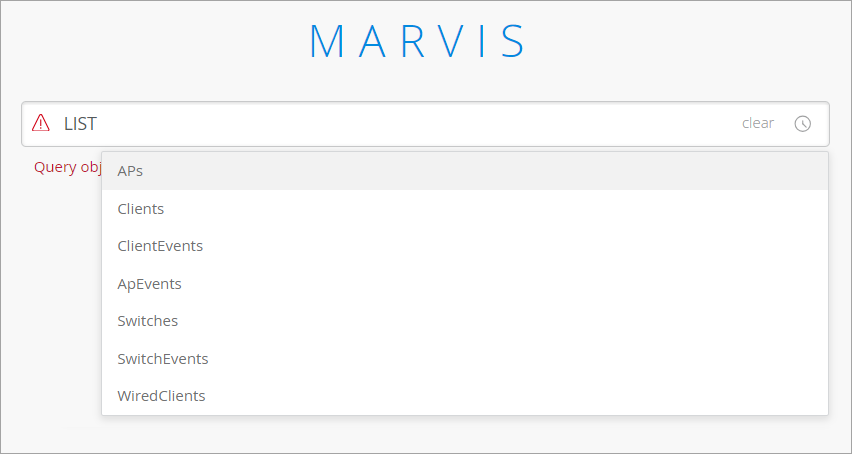
After you click an option, it appears in the query box. Press the space bar, and Marvis displays the available options. Here's an example of the options for the LIST query type.
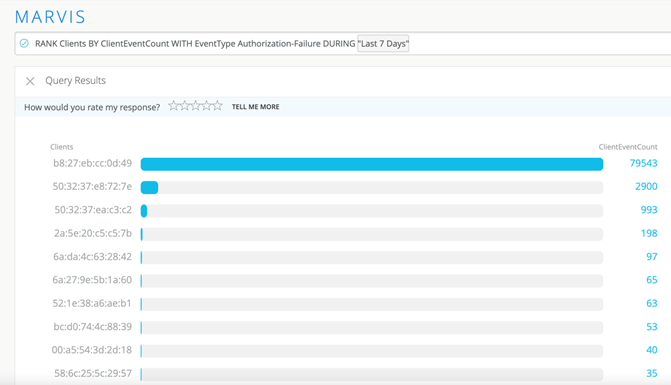
Continue pressing the space bar and selecting options until you've entered a complete query. Here's an example of a RANK query that ranks clients based on the authentication failures:
For more information about useful queries, see Troubleshoot Using Marvis Query Language.