View Zoom Meeting Insights
Get familiar with the types of information that you can use to assess the quality of your Zoom calls and to troubleshoot any issues that occur.
Juniper Mist™ collects Zoom meeting data and displays the insights only if a client joins a Zoom call when connected to a Mist access point (AP). Mist does not display insights for calls that you make outside of the Mist network. You can view the meeting insights both at the site level and the client level.
View Site-Level Zoom Meeting Insights
To view site-level meeting insights:
-
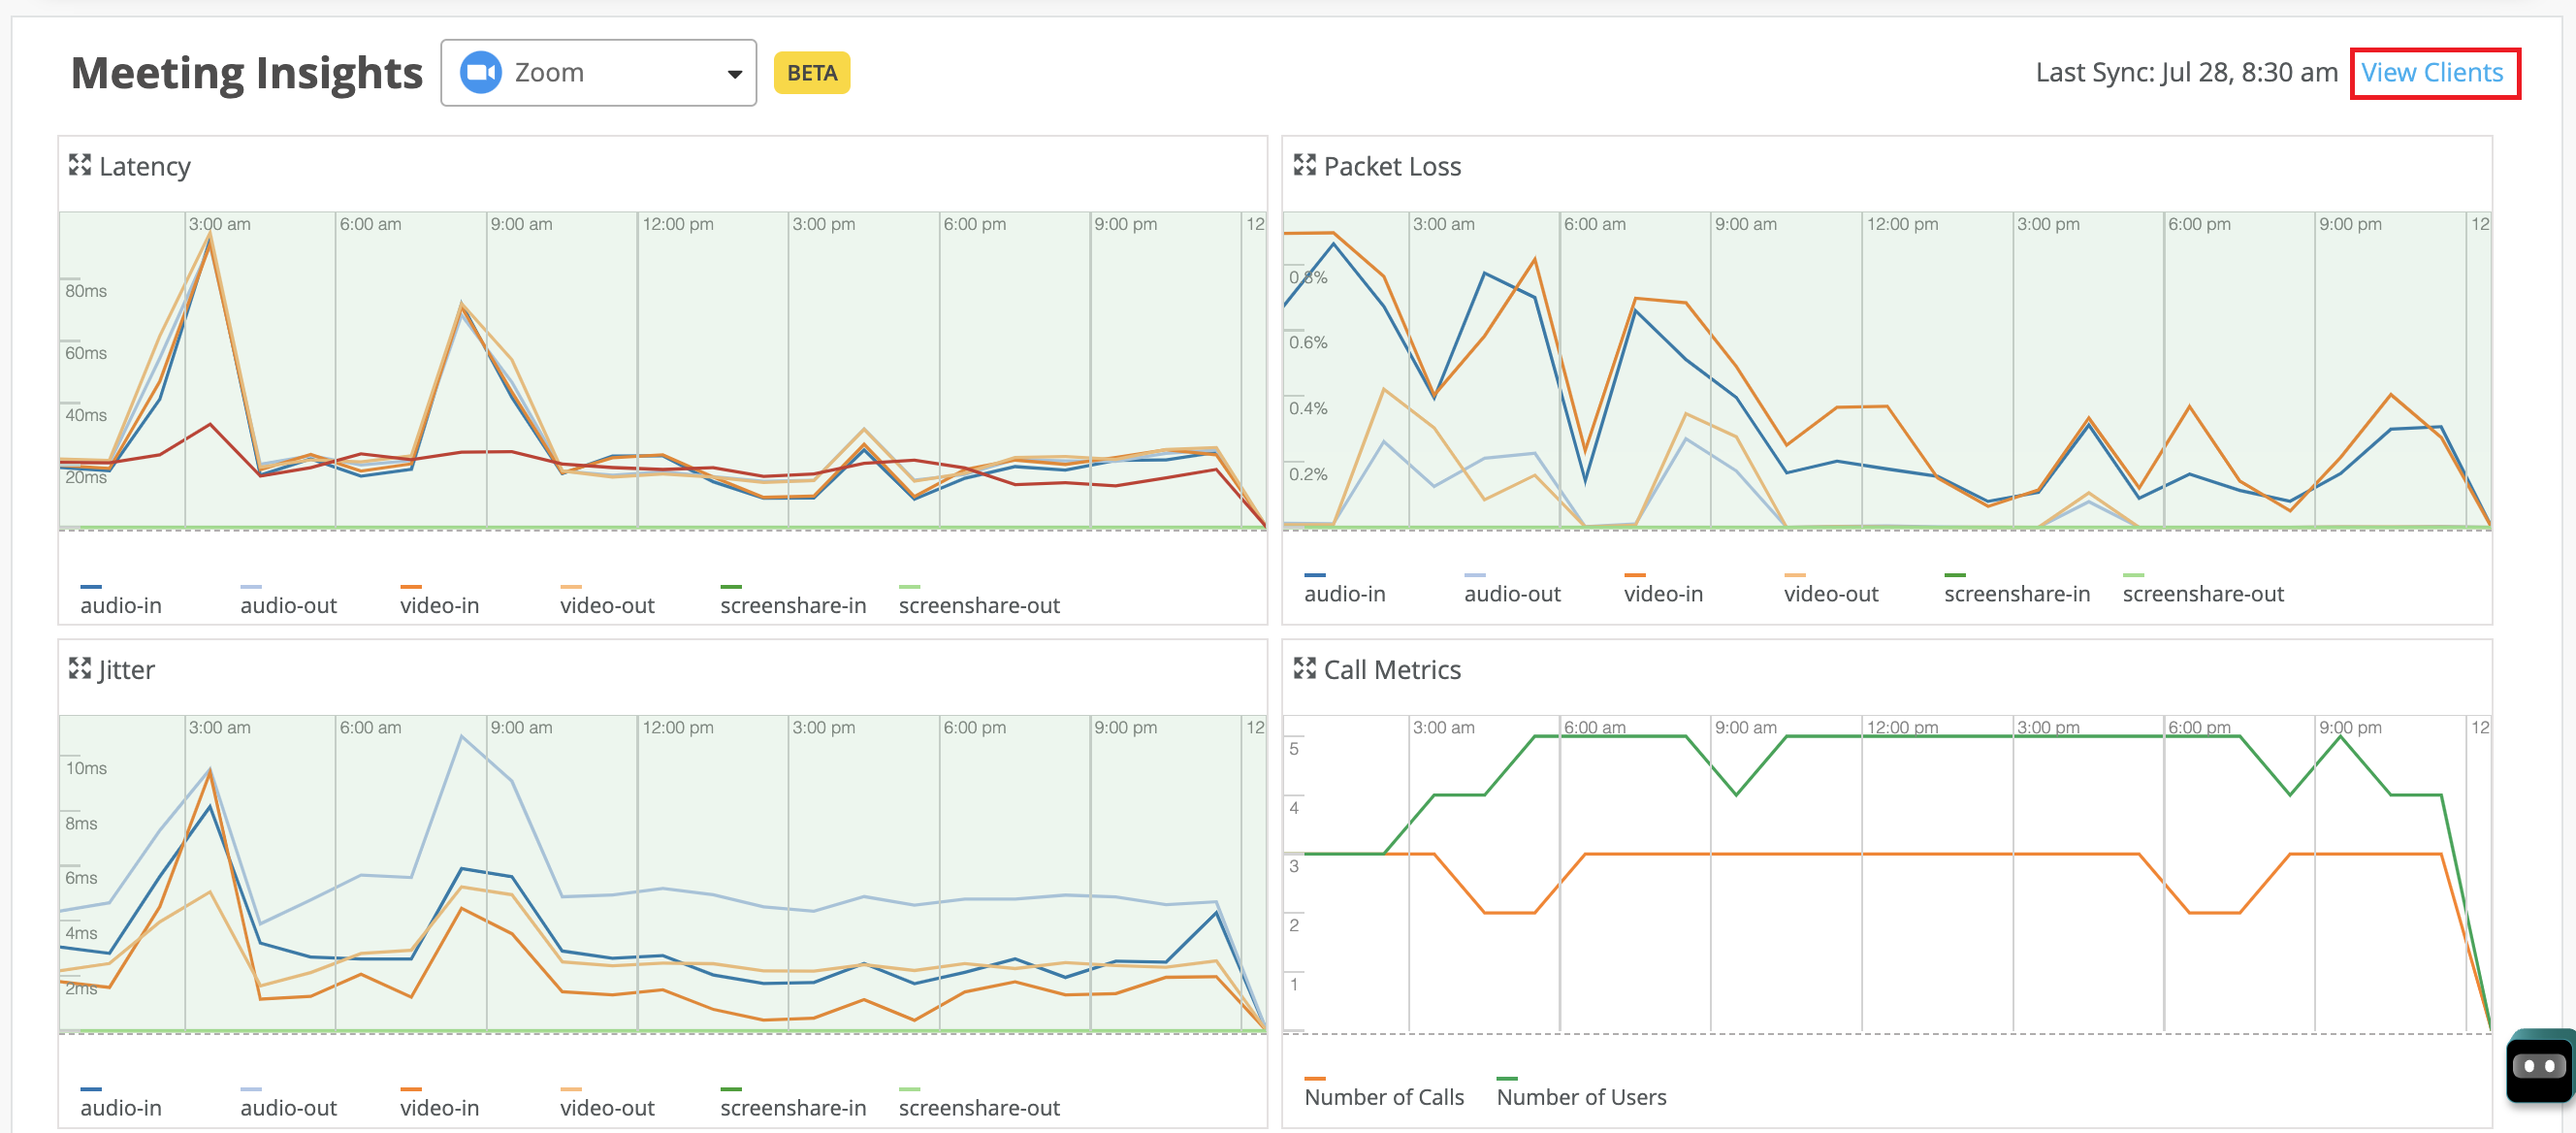
Scroll down to the Meeting Insights section. You can see a graphical
representation of the data that Mist aggregates for all the clients in the
site for the selected duration.
The aggregation interval is:
-
10 minutes for a duration that is less than 24 hours
-
1 hour for a duration that is greater than 24 hours
Mist provides the following time series graphs. You can click the legends in each of the graphs to filter the data.
Latency: Provides client-to-cloud input and output latencies for audio, video, and screen sharing.
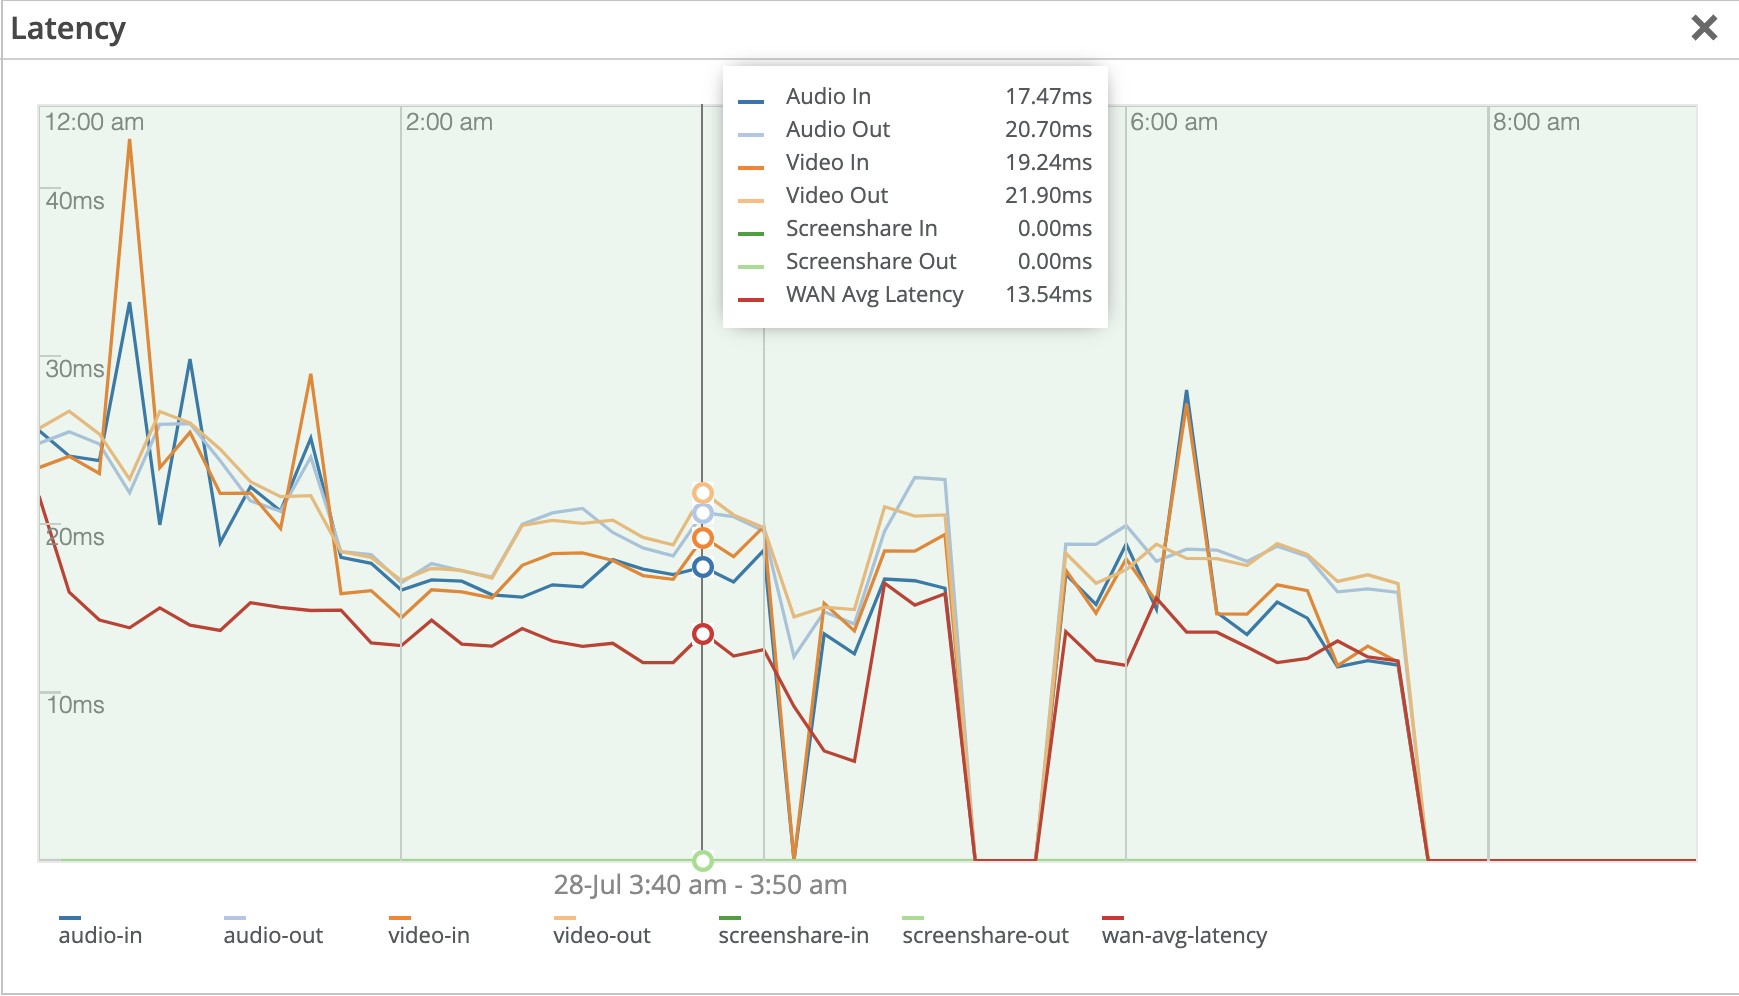
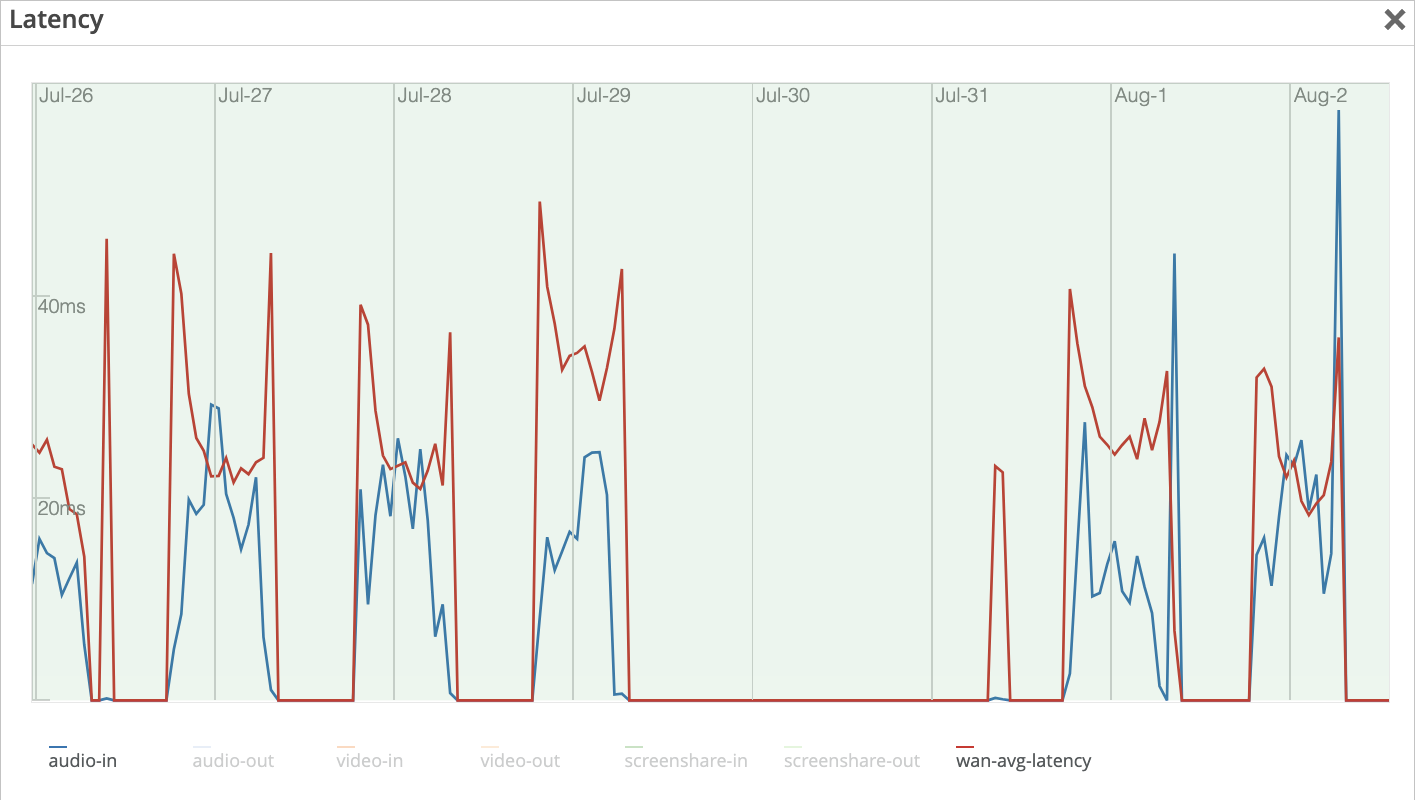
You can compare the latency that Zoom observes with the average WAN latency, represented by wan-avg-latency for the site. You can also compare the latency for a specific parameter with the wan-avg-latency value. For example, the following screenshot provides a comparison between the audio-in parameter and wan-avg-latency.
 Note:
Note:All the parameters are enabled by default in the graph. To select a parameter, click all the other parameter labels to disable the parameters and hide their data in the graph. You can click the labels again to enable the parameters and see the data in the graph.
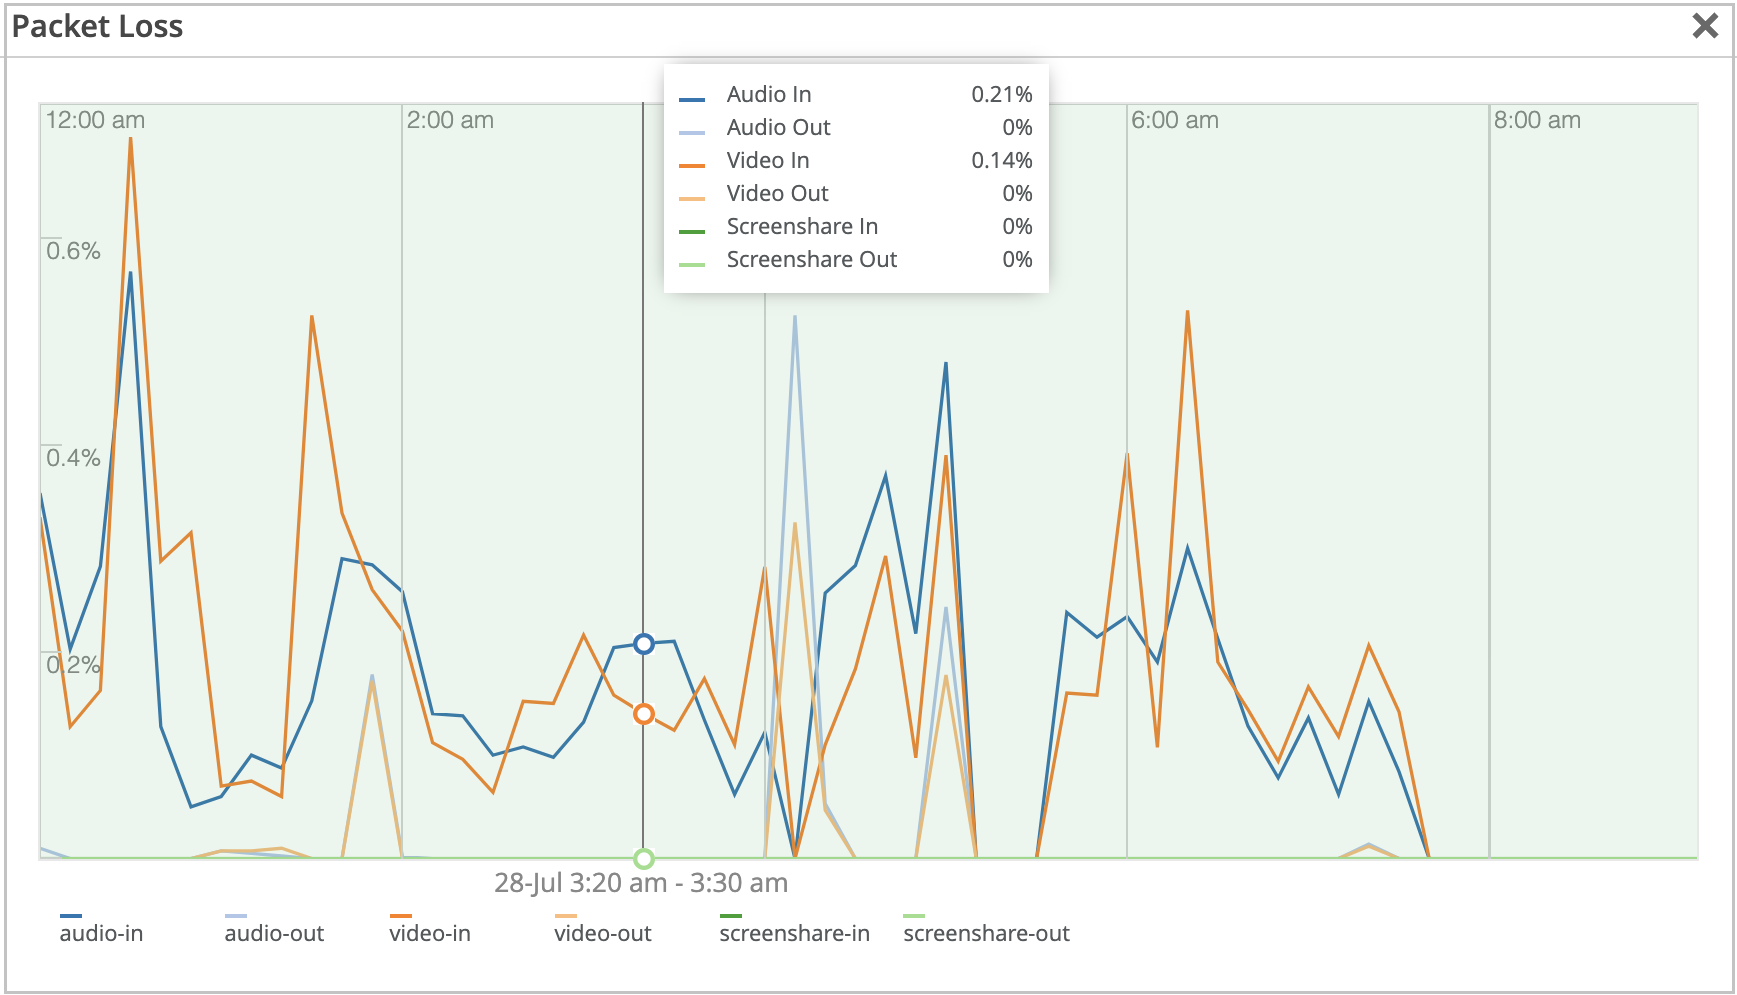
Packet Loss: Provides client-to-cloud input and output packet loss for audio, video, and screen sharing.
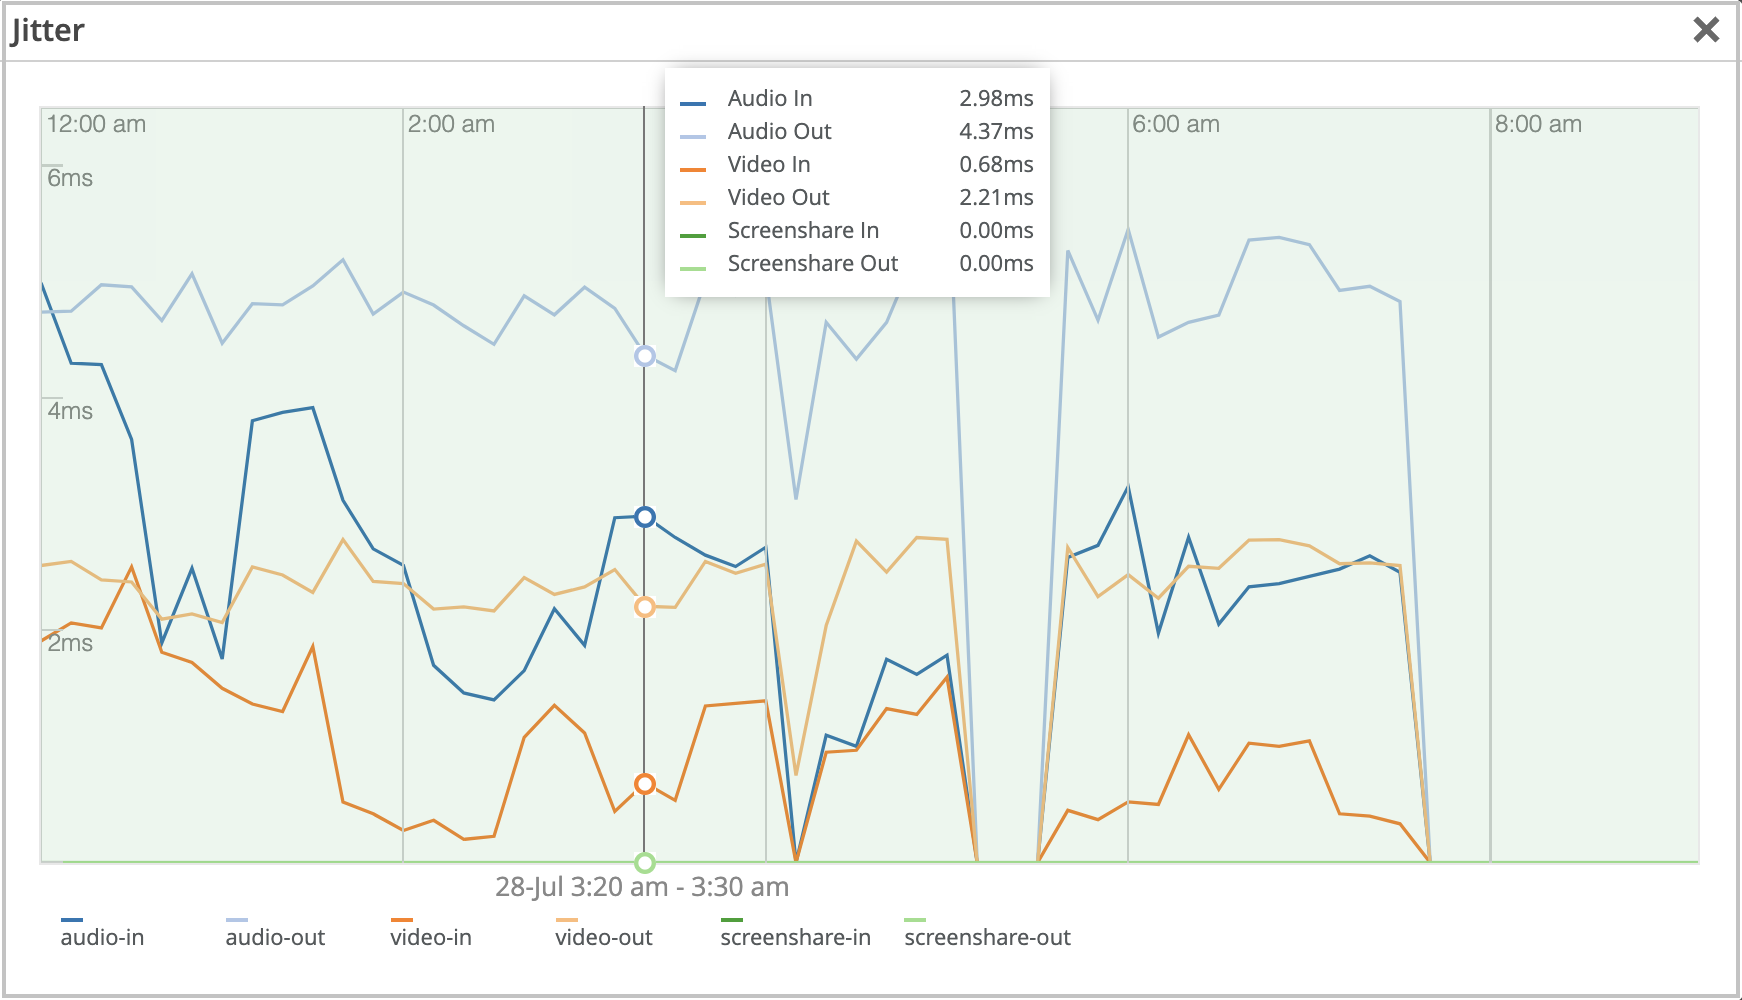
Jitter: Provides client-to-cloud input and output jitter for audio, video, and screen sharing.
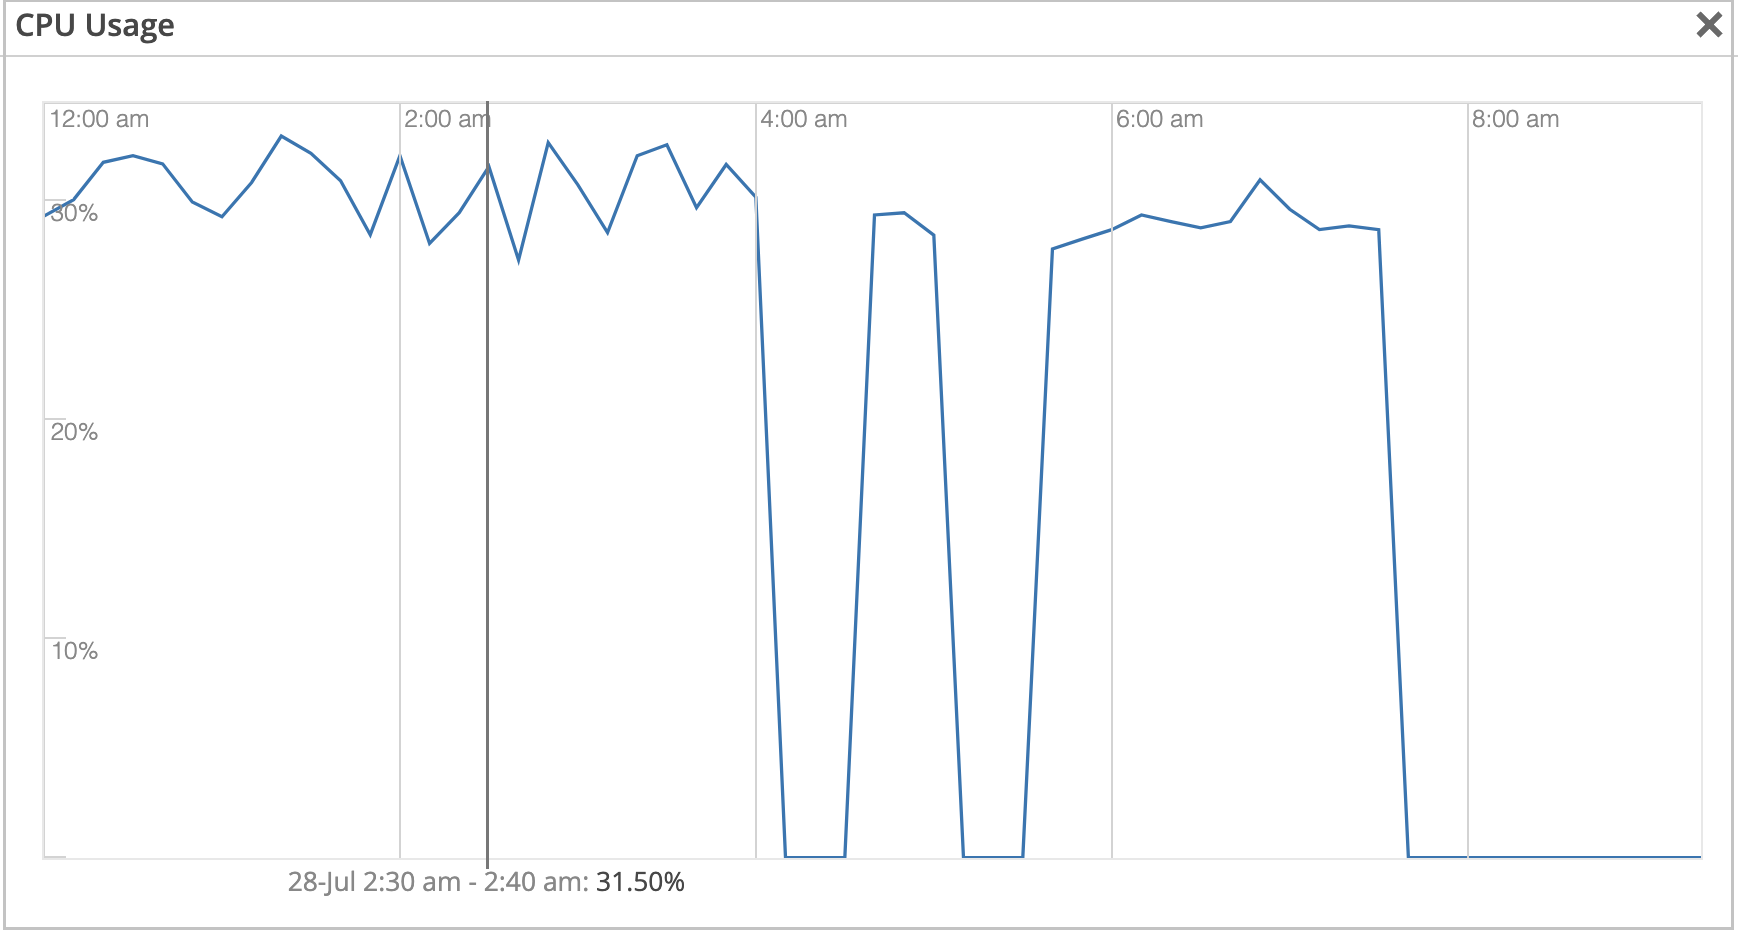
CPU Usage: Provides client CPU usage data.
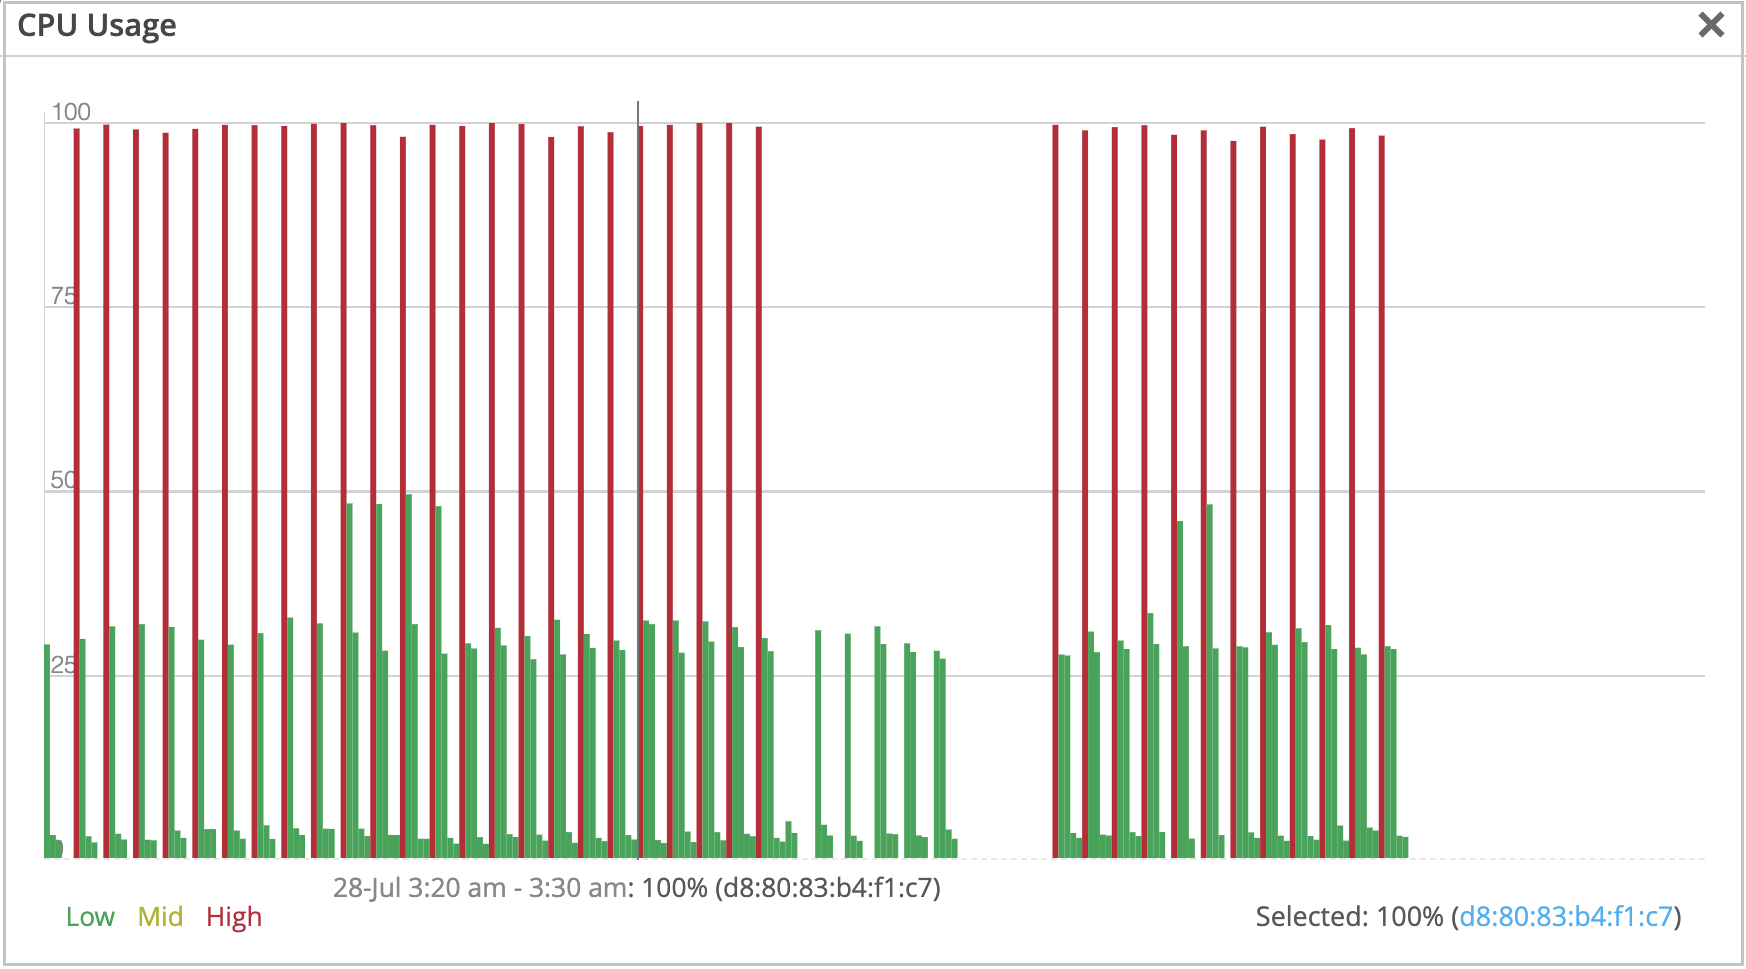
You can click a data point on the graph to see the CPU usage and the client MAC address. You can click the MAC address (in blue) to navigate to the Client Insights view for that client.
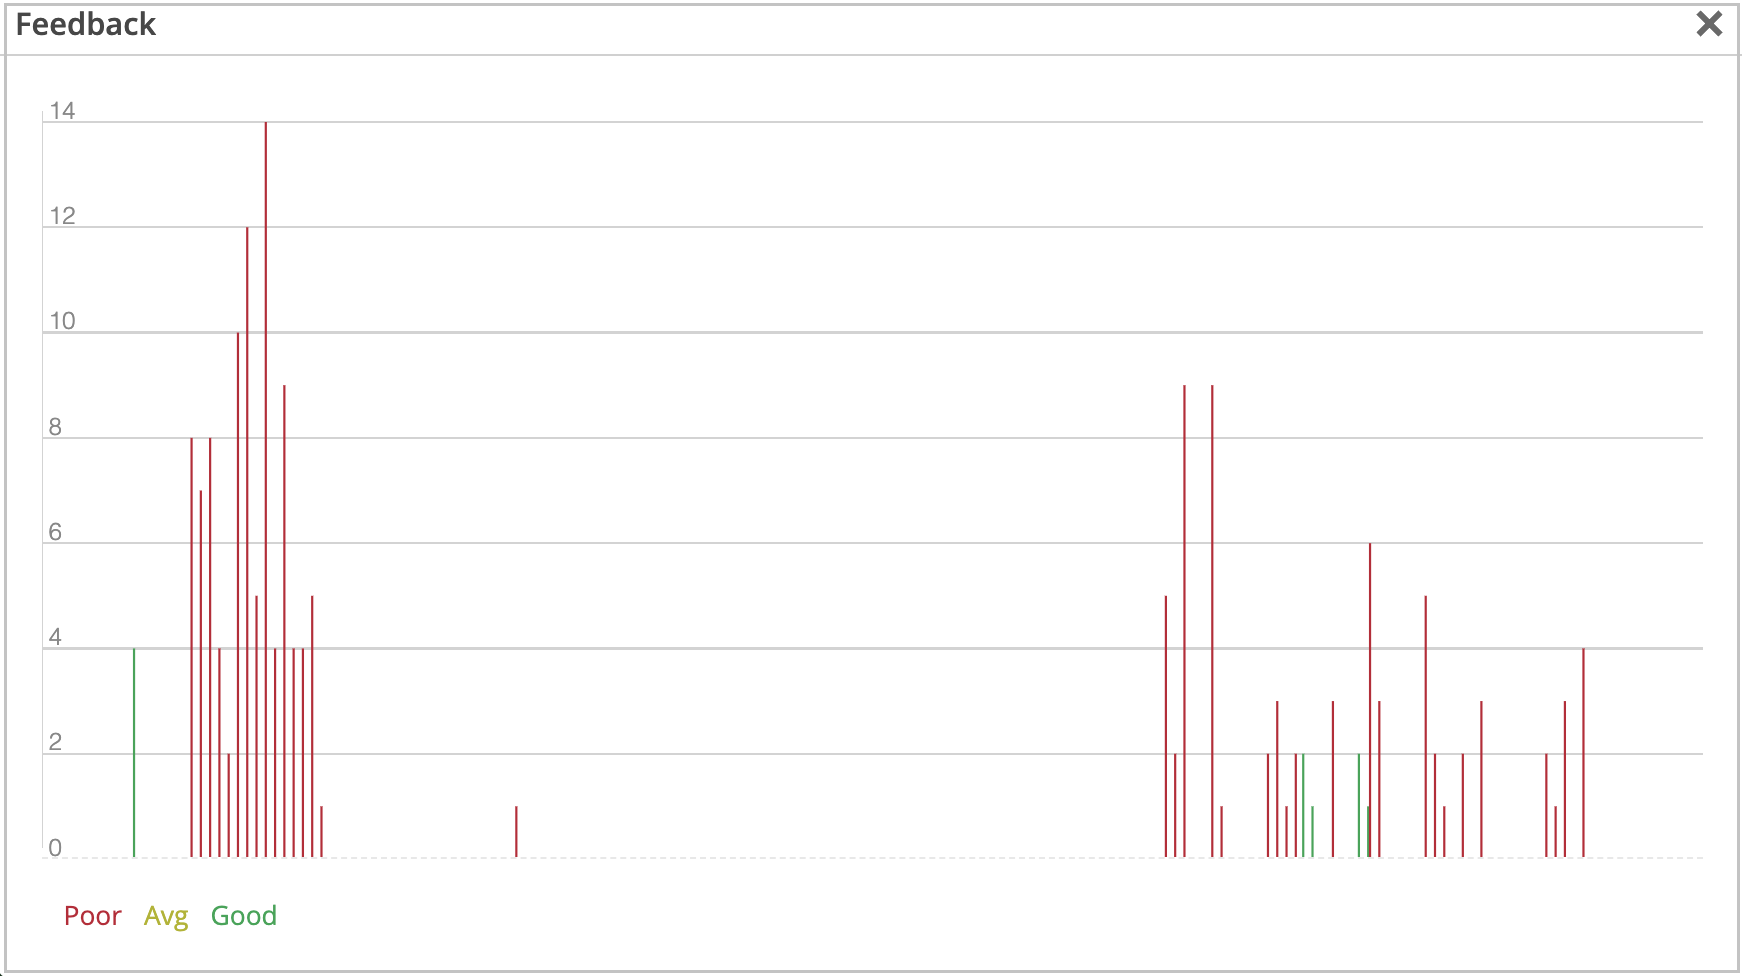
Feedback: Provides a histogram of user feedback. The Y-axis indicates the number of users who have given feedback. The color of each bar indicates whether the feedback is poor, average, or good.
-
View Client List for a Site
-
Click View Clients.
 Mist lists the clients that are connected to Zoom meetings. You can click a MAC address (in blue) to go to the Client Insights page for that client.
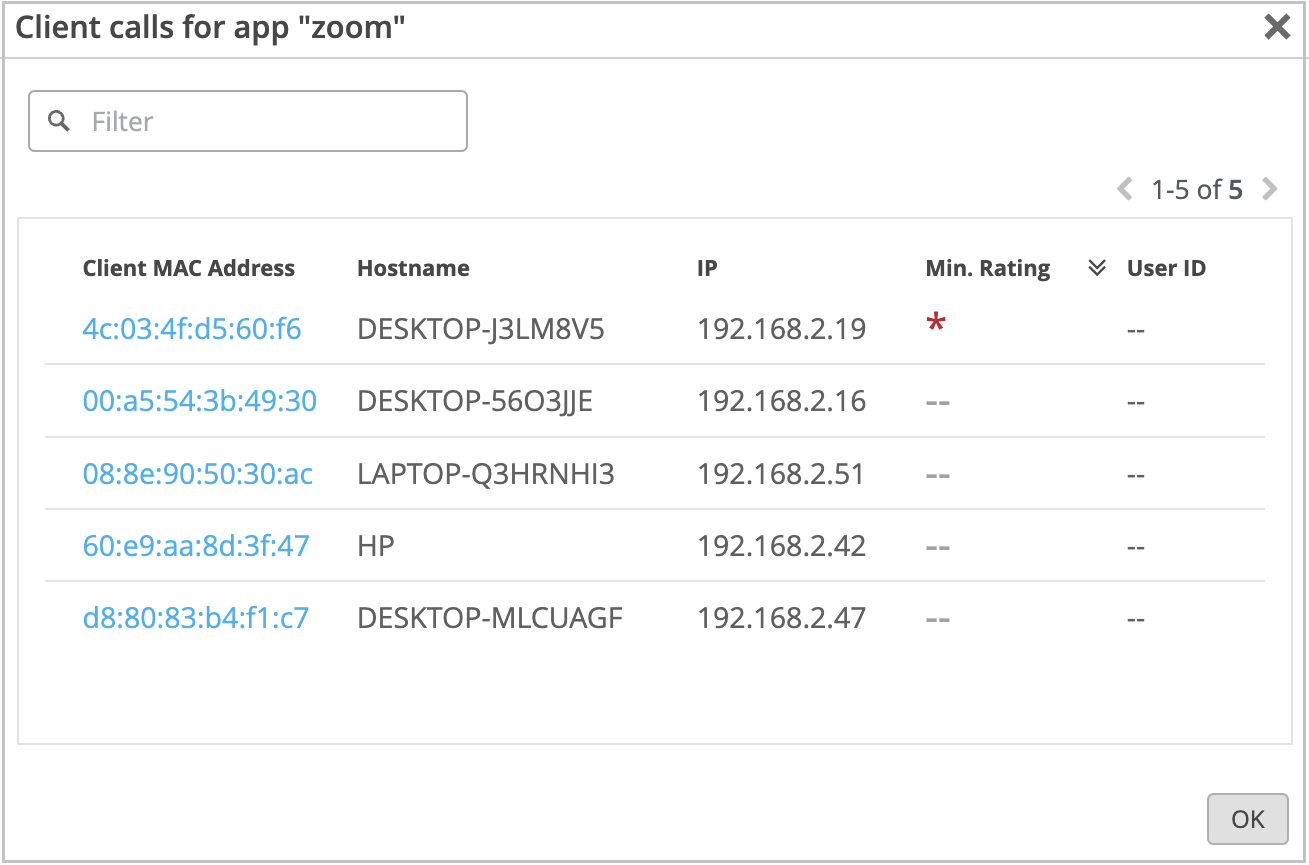
View Client Insights
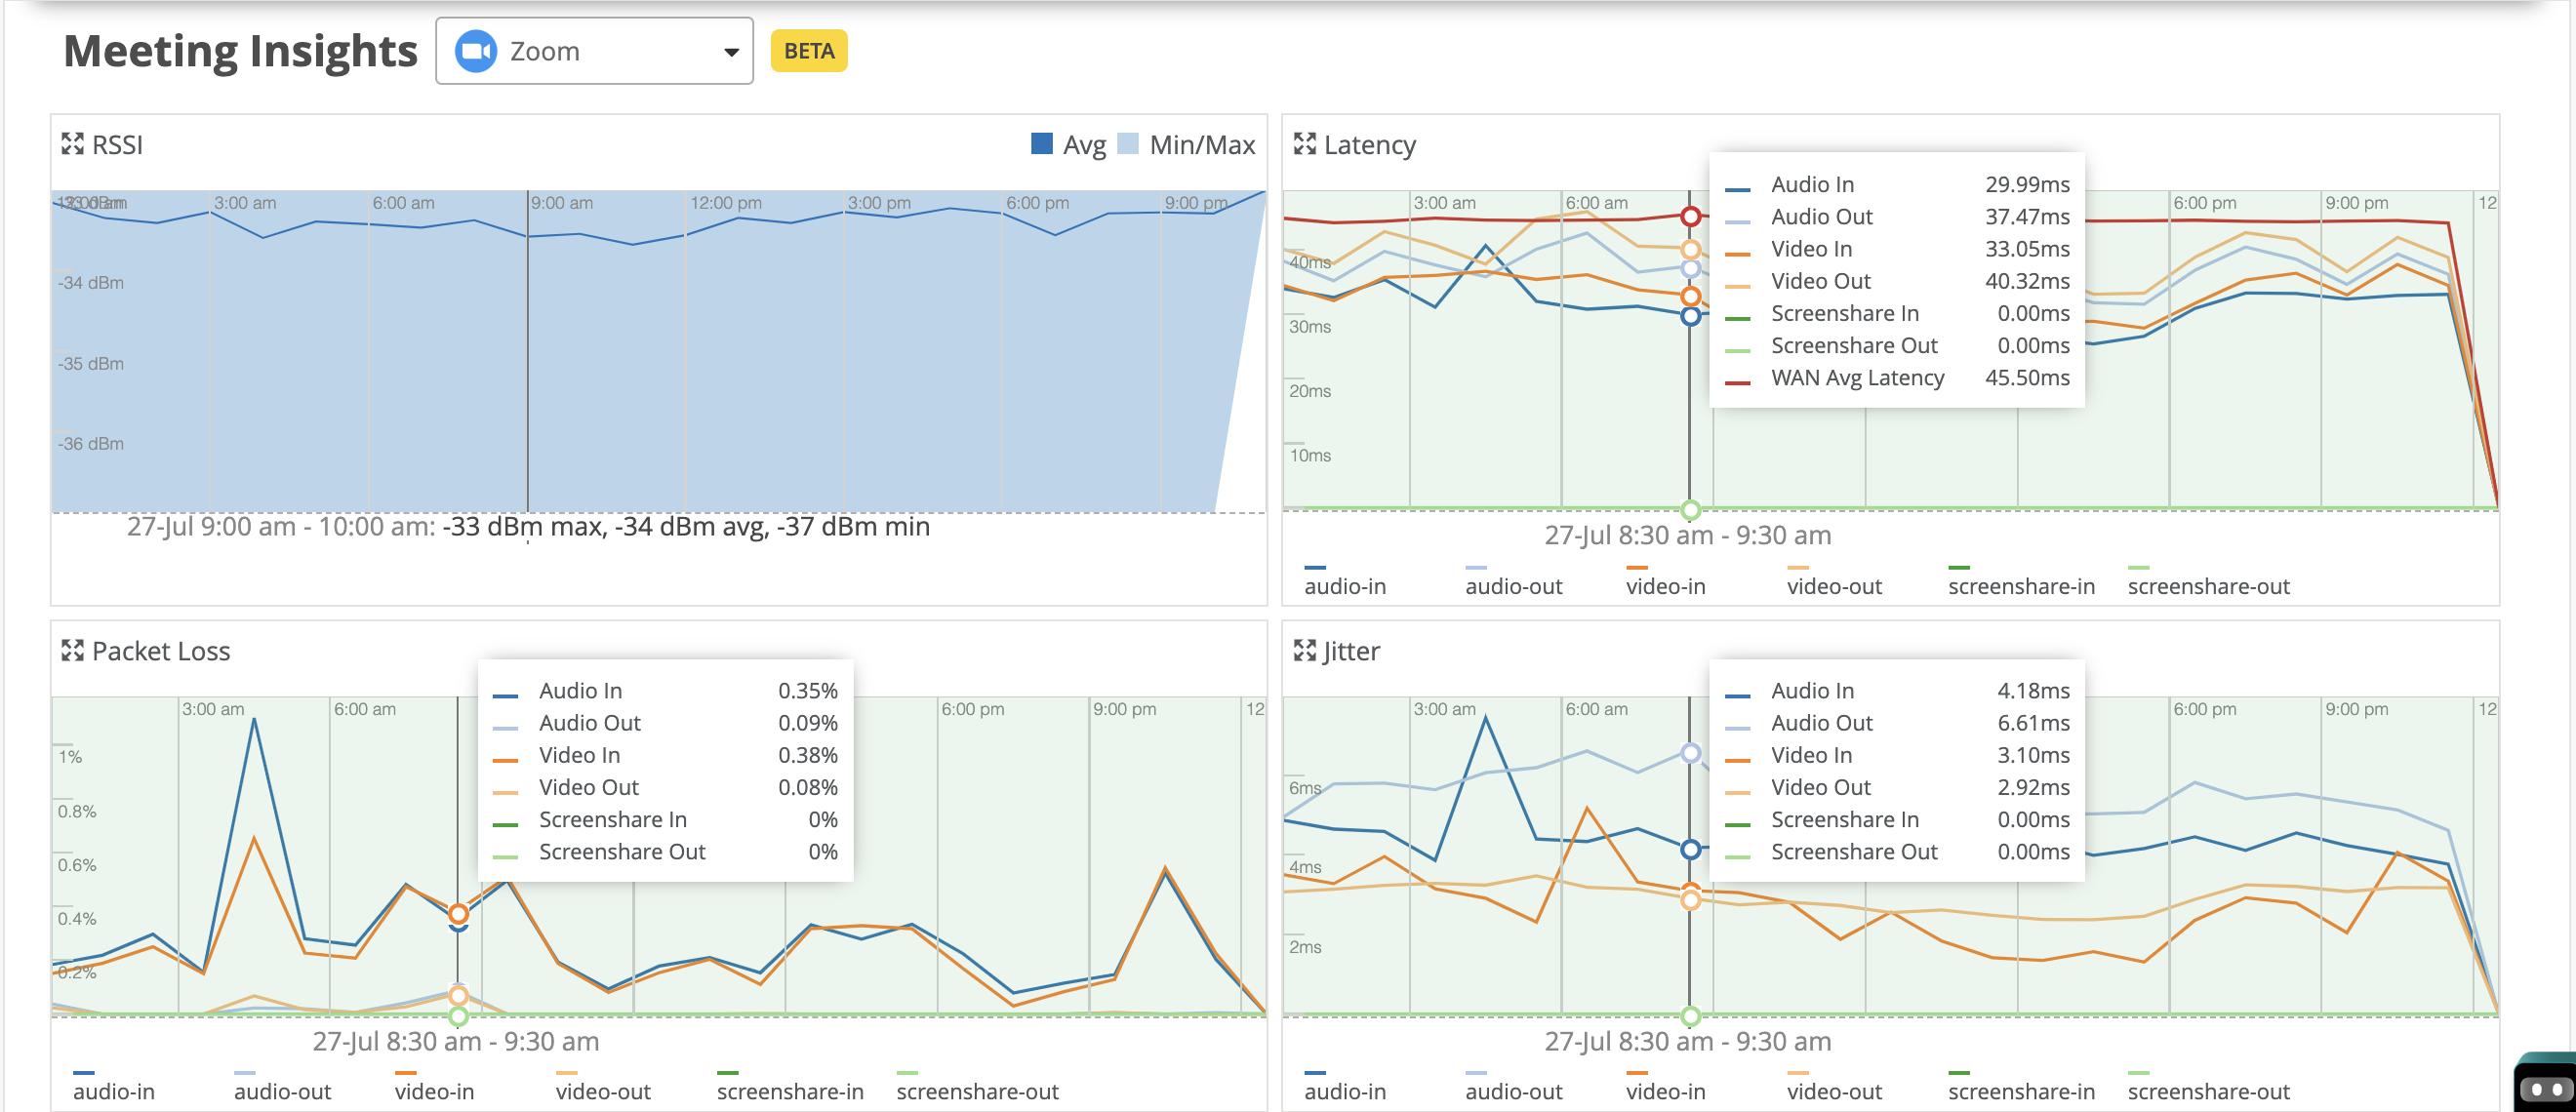
For an individual client, you can compare the received signal strength indicator (RSSI) value with the latency, packet loss, and jitter data.
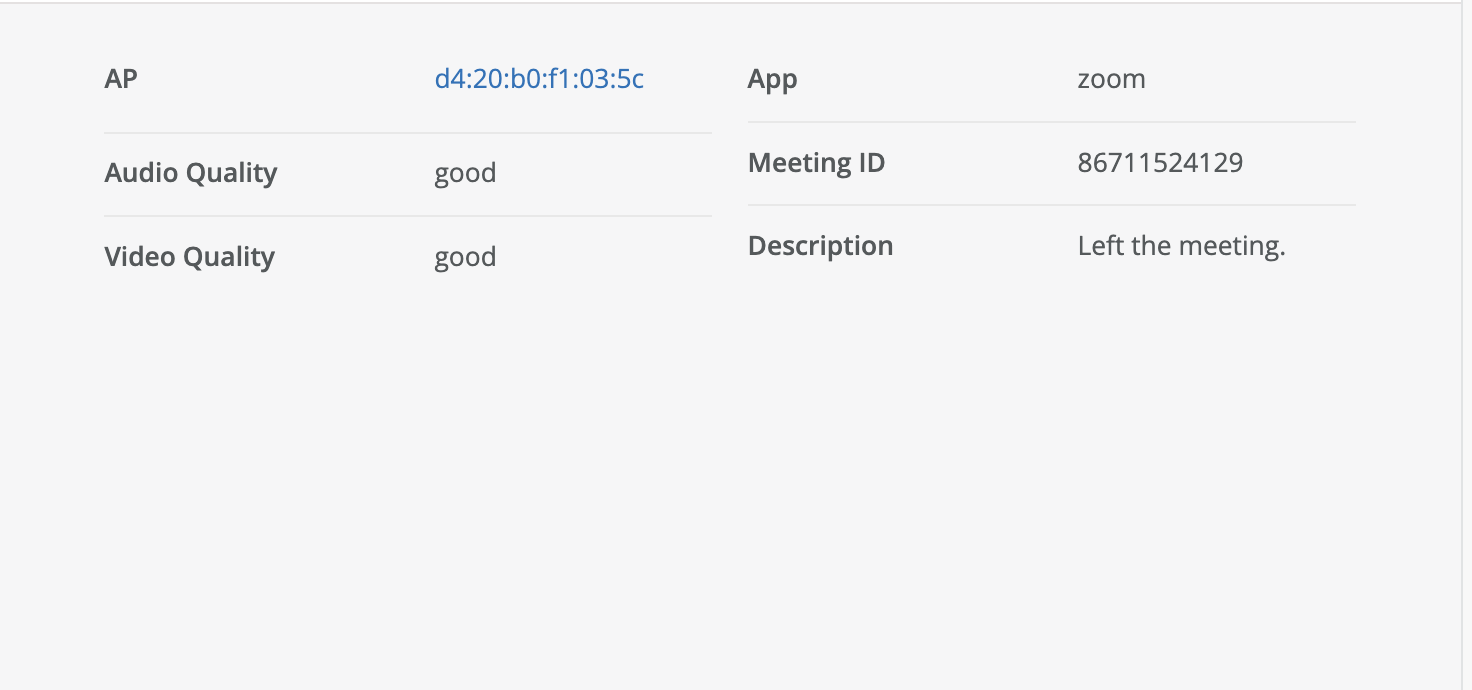
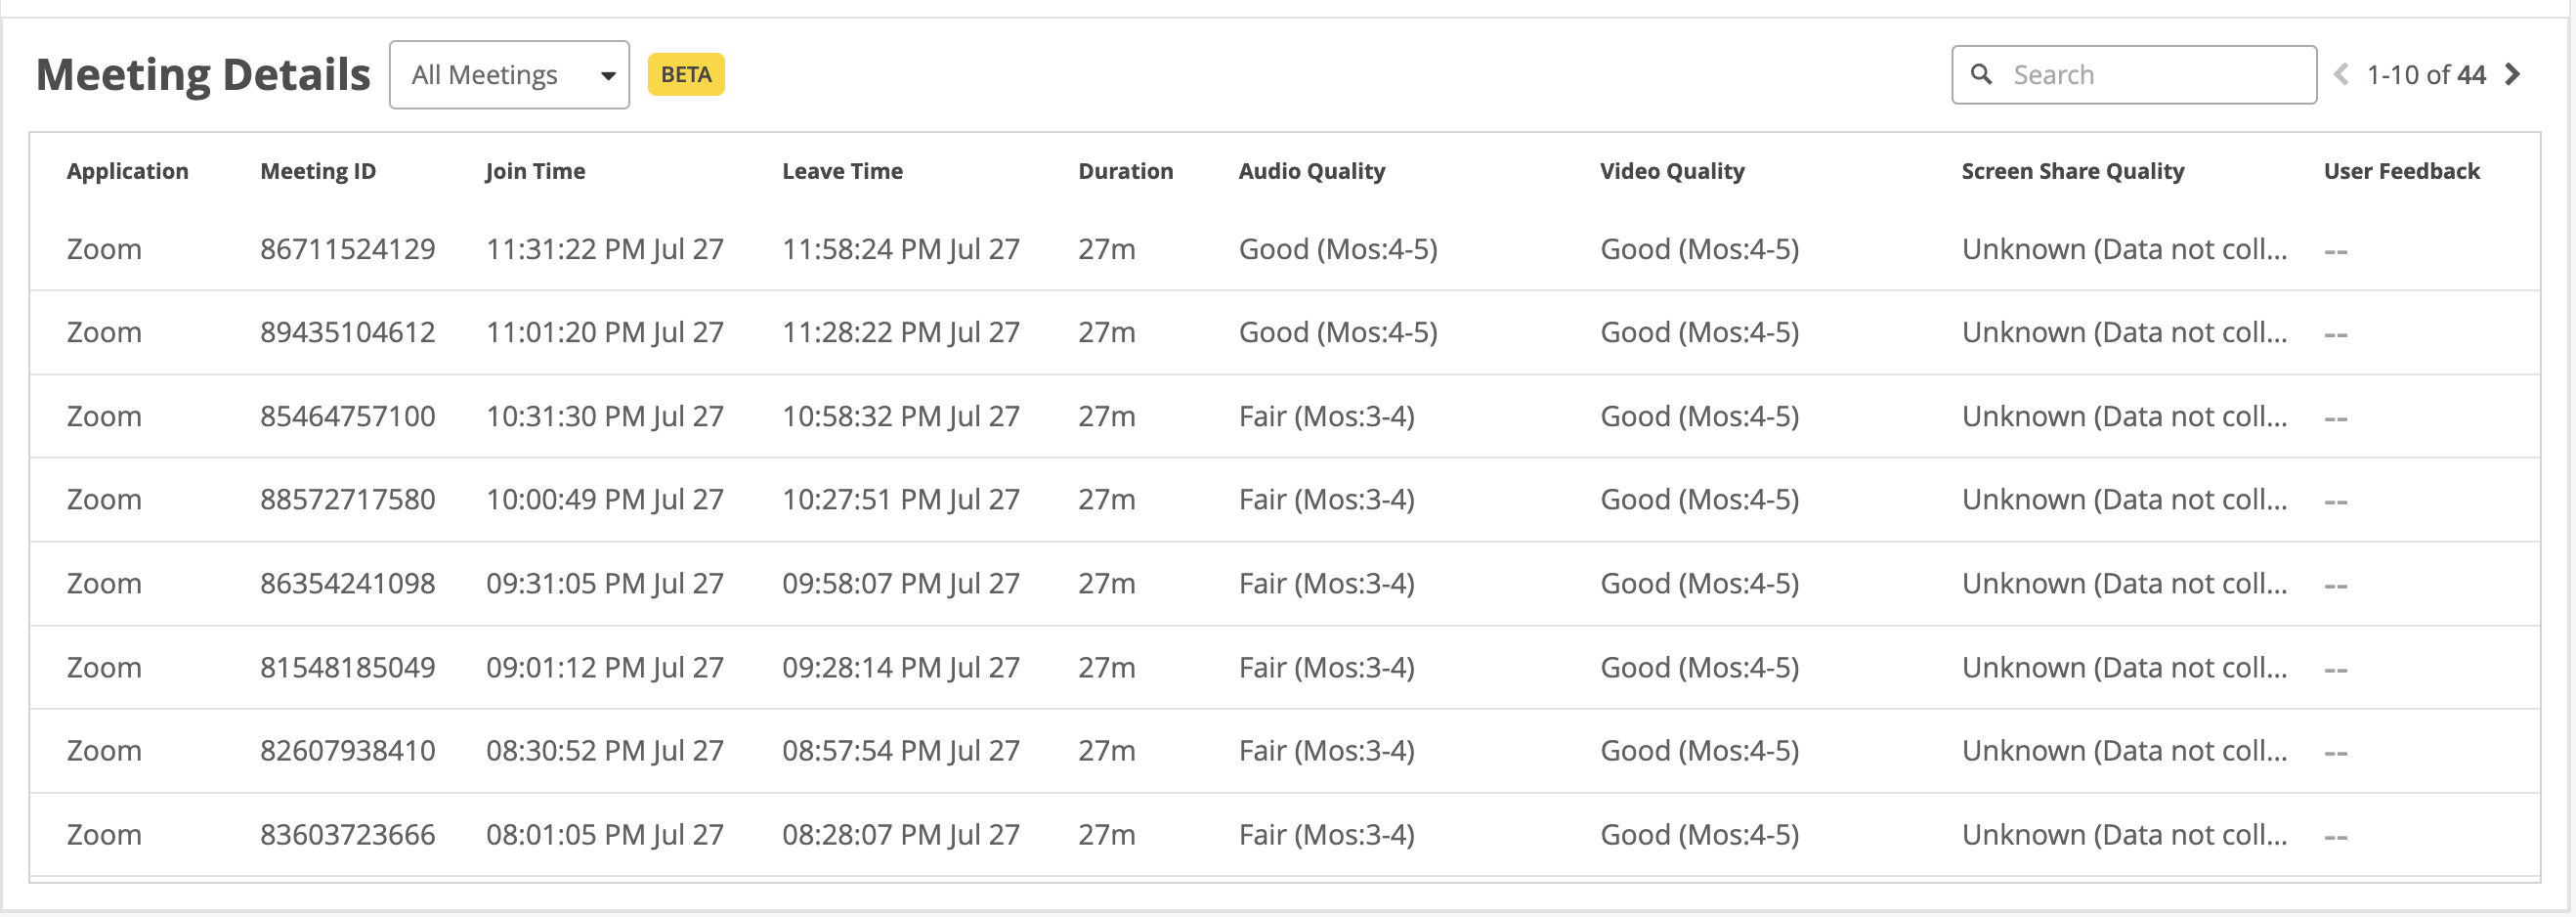
The
Meeting Details section provides details of the meetings that the client joined.
View Client Events
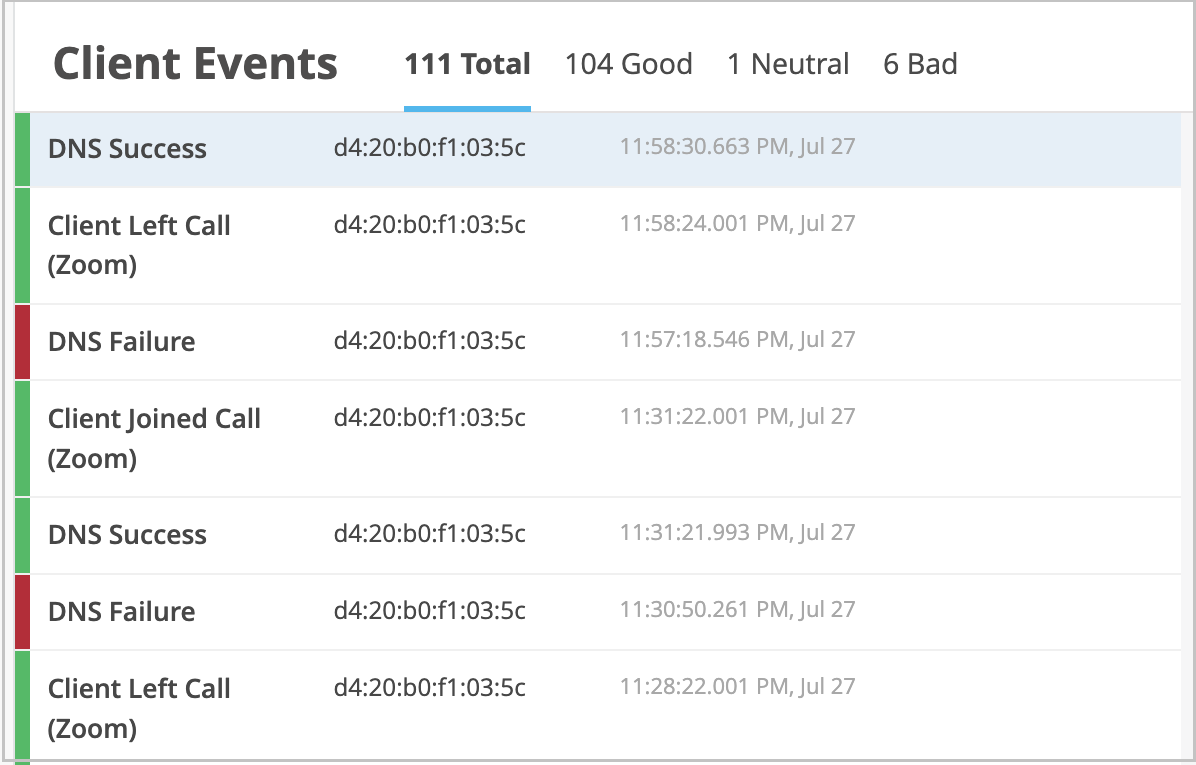
You can click each event to view
the details.