Configure Secure Edge Connector with Zscaler (Manual)
Follow this workflow to use manually provision tunnels when integrating Zscaler as your Secure Edge provider.
Juniper Mist provides pre-built connectors specifically designed for the Juniper Networks SRX Series Firewalls and Session Smart™ Routers deployed as WAN Edge devices. These connectors facilitate seamless integration with Secure Edge (SSE) deployments.
This topic walks you through how to manually provision tunnels when integrating Zscaler as your Secure Edge provider. A tunnel is configured between the WAN Edge device and the SSE using the Zscaler Secure Edge Connector configuration in Mist. As a result, your WAN Edge device establishes connections to the SSE using IPsec tunnels.
Overview
Juniper Mist WAN Assurance with Mist AI enhances security, and integration with Zscaler offers a comprehensive SASE solution for secure access across locations. Zscaler provides cyber-security capabilities and zero trust connectivity, all integrated seamlessly with the Mist Cloud.
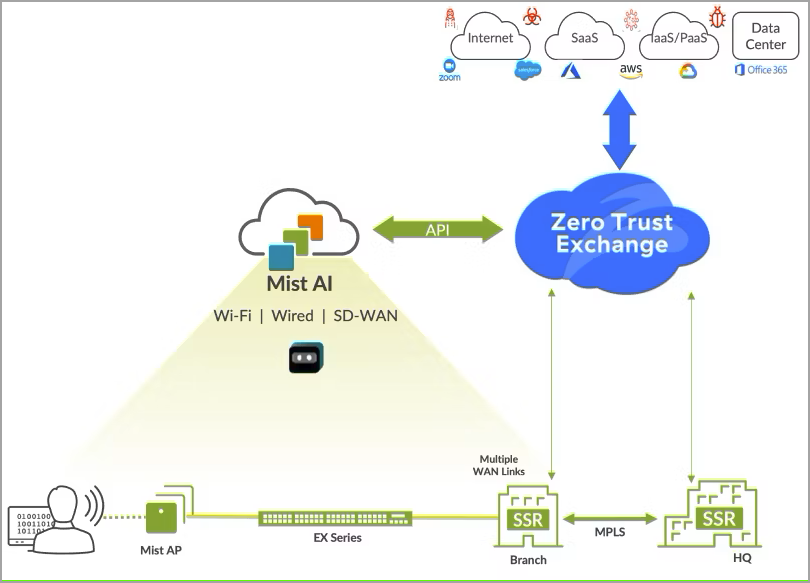
Read the following topic to understand how to configure tunnels manually from the Mist Cloud portal when you select Zscaler as your Secure Edge Connector.
Manually Provision Tunnels for Zscaler Integration
Prerequisites
For IPsec Tunnels
- Zscaler cloud account
- Local ID and pre-shared key (PSK) configured from the Zscaler account. Ensure that you set the length of PSK between 6 to 255 characters.
- IP addresses or hostnames of the Zscaler public service edges tunnels (primary and secondary). See Locating the Hostnames and IP Addresses of Zscaler Enforcement Nodes (ZENs).
- Check Configuring an IPSec VPN Tunnel.
For GRE Tunnels
- Zscaler cloud account
- IP addresses or hostnames of the Zscaler public service edges tunnels (primary and secondary). See Locating the Hostnames and IP Addresses of Zscaler Enforcement Nodes (ZENs). See Configuring GRE Tunnels.
- Static IP address. See About Static IP.
Manually Provision Tunnels for Zscaler Integration
- On Juniper Mist portal, go to the Secure Edge Connectors section at the WAN Edge Templates-level, hub profile, or at Site-level.
- Click Add Provider.
- In the Add Provider window, select Zscaler.
- In the Add Provider window, use Table 1 to guide you as you enter the
following information for Zscaler manual tunnel provisioning:
- For IPsec Tunnels:
Table 1: Add Provider Settings for IPsec Tunnels Field Value Name Enter the name of the service. Provider Select Zscaler. Protocol Select IPsec. Local ID Provide the login ID of the Zscaler account. Preshared Key Provide the preshared key (PSK) created with Zscaler account. The length of the PSK must be between 6-255 characters. IP or Hostname Provide the IP addresses or hostname of the Zscaler datacenter (see https://config.zscaler.com/zscalerbeta.net/cenr). We recommend adding the IP address of the nearest datacenter to your device location. Source IPs Enter the source IP address of the Zscaler tunnel. Probe IPs Enter the probe IP address. You can use any well-known IP (Example: 8.8.8.8). You need the probe IP address to monitor the status of the Zscaler IPsec tunnel using probes. WAN Interface Assign WAN interfaces for provisioning of primary and secondary tunnels. You can add multiple WAN interfaces, and the first interface listed takes priority. If first interface is down, then the system uses the second interface to establish the tunnel. Figure 2: Add Details for Zscaler IPsec Tunnels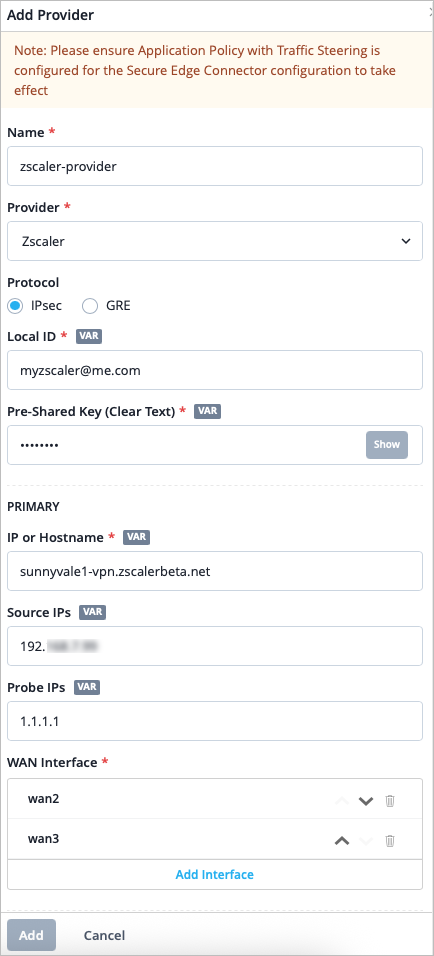
Configure secondary tunnel options (optional). Enter IP or Hostname, Source IPs, Probe IPs, and WAN Interfaces.
Click Add.
- For GRE Tunnels, use Table 2 to
guide you as you enter the following information:
Table 2: Add Provider Settings for GRE Tunnels Field Value Name Enter the name of the service. Provider Select Zscaler. Protocol Select GRE. IP or Hostname Provide the IP addresses or hostname of the Zscaler datacenter. See https://config.zscaler.com/zscalerbeta.net/cenr. We recommend adding the IP address of the nearest datacenter to your device location. Source IPs Enter the source IP address of the GRE tunnel. See Configuring GRE Tunnels. Probe IPs Enter the probe IP address. You can use any well-known IP (Example: 8.8.8.8). You need a probe IP address to monitor the status of the Zscaler GRE tunnel using probes. WAN Interface Assign WAN interfaces for provisioning of primary and secondary tunnels. You can add multiple WAN interfaces, and the first interface listed takes priority. If the first interface is down, the system uses the second interface to establish the tunnel. Configure secondary tunnel options (optional). Enter IP or Hostname, Source IPs, Probe IPs, and WAN Interfaces
.
Figure 3: Add Details for Zscaler GRE Tunnels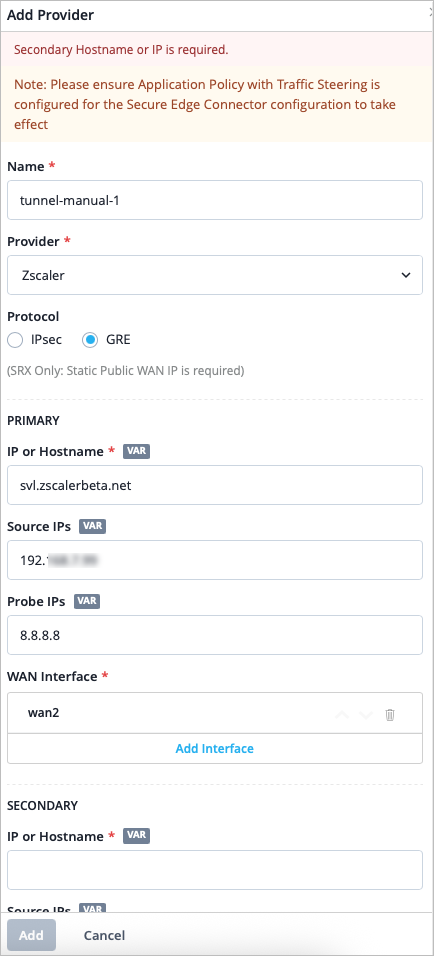
- For IPsec Tunnels:
- Click Add to continue.
Add a traffic steering profile on the WAN Edge Templates page or on the WAN Edge Device page. Use the table below to guide you. See Traffic Steering Rules.
Table 3: Traffic Steering Settings Field Value Name Enter the name of the traffic steering rule. Strategy Select a strategy. You can configure the traffic steering profile with any strategy (Ordered/Weighted/ECMP), based on your topology and configuration. Add Path Click Add Paths and enter the following details. - Type—Select Secure Edge Connector.
- Provider—Select Zscaler.
- Name—Select the name of the Zscaler provider you created earlier.
Figure 4: Traffic Steering Path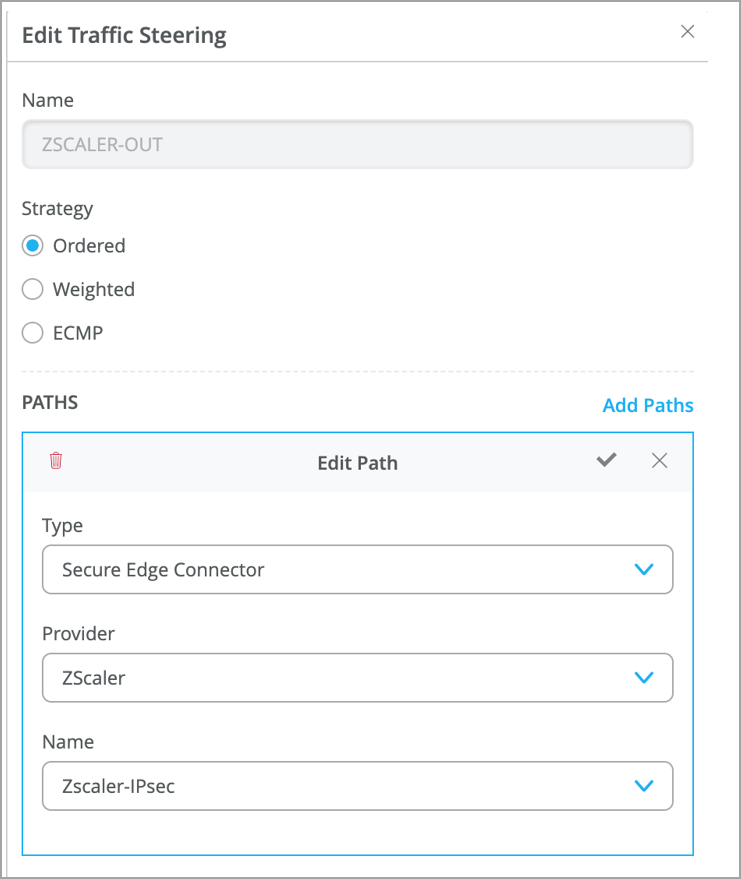
Select the blue checkmark in the Add Paths title bar to save the changes.
Click Add at the bottom of the side panel.
- Add an application policy that uses the traffic steering profile you
created.
This
step is required for provider tunnels to take effect.
Enter the details as described in Table 4 for the
application policy:
Table 4: Application Policy Settings Field Value Name Enter a name for the application policy. Network/User This is the network or user that needs secure access to applications through the tunnel. Action Select an action of Allow for the traffic. Application/Destination Select the applications that you want the Network/User to have access to. Traffic Steering Select the traffic steering profile you created in step 6. This specifies the path that traffic is allowed to take to reach its destination. Figure 5: Application Policies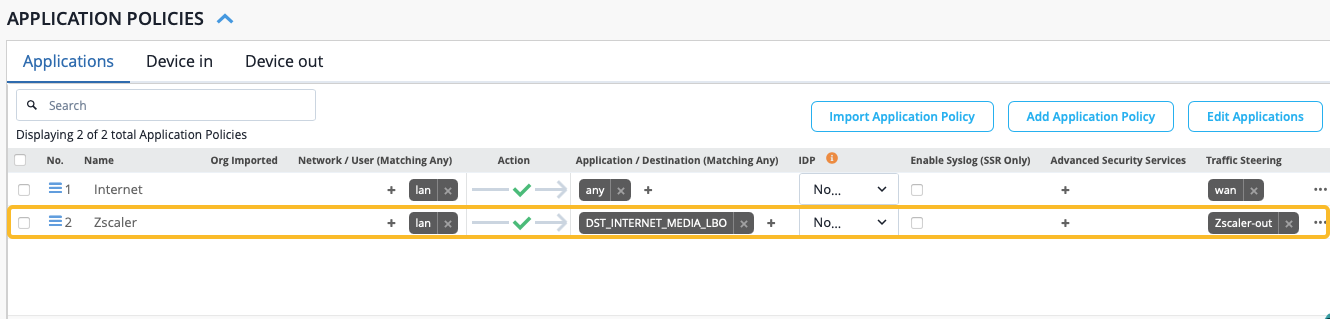
Verification and Troubleshooting
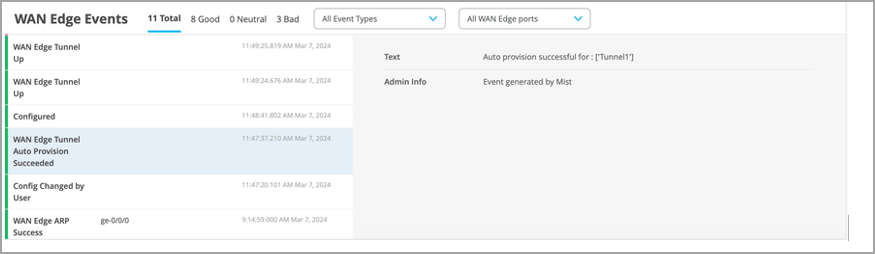
Verification
On the Mist portal, you can verify the established tunnel's details by navigating to WAN Edges > WAN Edges > WAN Edge Insights > WAN Edge Events. You should see the WAN Edge Tunnel Up event.
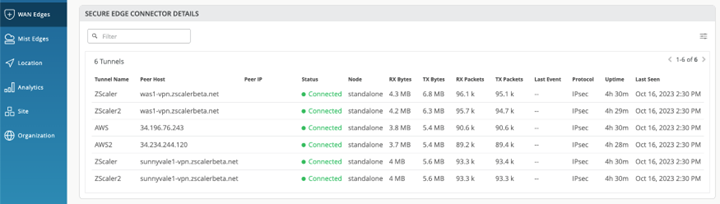
Once the Zscaler tunnel configuration has been deployed, you can see the tunnel status by navigating to WAN Edges > WAN Edges. Click on the device name, then scroll down to the Secure Edge Connector Details section in the Juniper Mist portal.
You can view the tunnel statistics under Probe Stats on the WAN Edge Insights page. To view an example of this, see Tunnel Statistics.
Troubleshooting
If you are not able to establish the tunnel, the possible cause could be tunnel configuration issues, or reachability issues from your device. You can use the following options to troubleshoot the issue:
- Check the Zscaler IP address or hostname configured on the Mist portal. Ensure that the local ID and PSK configured on the Zscaler account match with those configured on the Mist portal.
- Ping the Zscaler public IP address from the WAN interface on your device and check if there are responses.
- Using the packet capture tool on the Mist portal. Run a PCAP on the WAN interface with the Zscaler Public IP address as the filter, and check to see if there are bidirectional packets. See Dynamic and Manual Packet Captures.
- If your security device is sending packets to Zscaler and there is no response
from Zscaler, do the following:
- Check if the Zscaler IP address is active.
- Check if any uplink router is blocking the traffic flow.
- Check the NAT configuration if applicable.
Note that packet capture results help you to detect the above issues.