View Device Information for Monitoring
Use the WAN Edge device page to quickly find device information for your WAN Edge devices for monitoring purposes.
This topic walks you through how to use the WAN Edge device page to monitor your WAN Edge device in the Juniper Mist™ portal following your initial deployment phase. You can use the device information page and the detailed information therein for monitoring your WAN Edge devices.
In addition to viewing the device information page, you can also:
Monitor the WAN Edge List
From the left menu of the Juniper Mist portal, select WAN Edges > WAN Edges to view a list of WAN Edge devices for your site. Notice the organization name at the top of the portal. This is the largest container and represents your entire organization.
The tiles across the top provide high-level information:
- Config Success—Percentage of online WAN Edges with successful configuration.
- Version Compliance—Percentage of WAN Edges that have the same software version per model.
- WAN Edge Uptime—Percentage of time a WAN Edge was up during the past seven days, averaged across all WAN Edges.
-
Potential Anomalies—Percentage of WAN Edges that currently have no potential anomalies detected by Marvis.
-
If none of the WAN Edges have potential anomalies, the percentage is 100%.
-
If some WAN Edges have anomalies, the value decreases in proportion to how many are affected. For example, if a site has 10 WAN Edges and 2 of them have anomalies, the percentage is 80%.
If the percentage is less than 100%, you can click Potential Anomalies to view the WAN Edges that have anomalies. Each affected WAN Edge has a Troubleshoot button that opens the conversational assistant with a pre-filled prompt (for example, “Troubleshoot <device> for last 7 days”), enabling you to view the detected anomalies without manually starting a troubleshooting session.
Figure 1: WAN Edges Page - Overall Percentages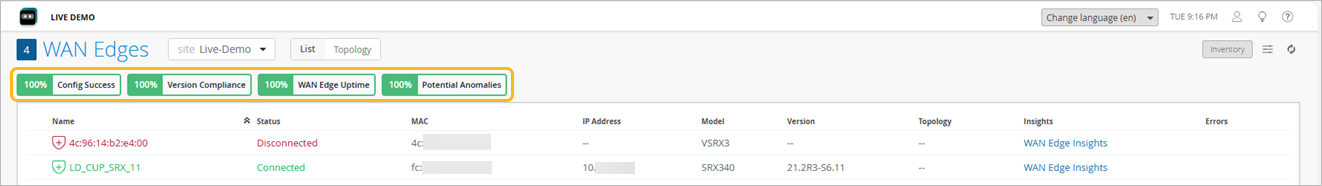
-
Beneath the organization name, you can see your site devices in either a List format or a graphical Topology format.
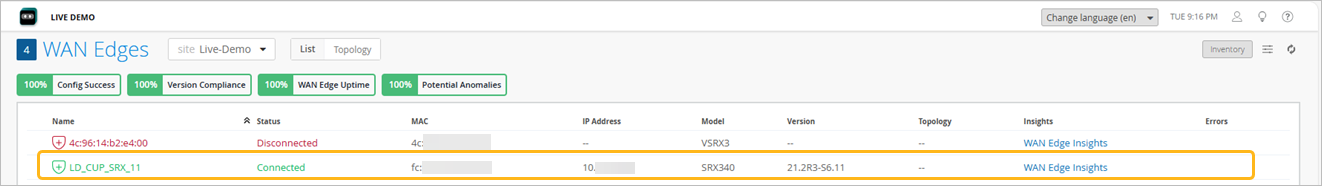
The WAN Edge List view contains columns with device detail information, as shown in Table 1.
| Fields | Description |
|---|---|
| Name | Name of the WAN Edge device |
| Status | Connected or disconnected |
| MAC | MAC address |
| IP Address | IP address |
| Model | Juniper Networks® SRX Series Firewall or Juniper® Session Smart™ Router model. |
| Version | SRX or SSR Software Version |
| Topology | Hub or Spoke |
| Insights | Provides a direct link to the WAN Edge Insights page. |
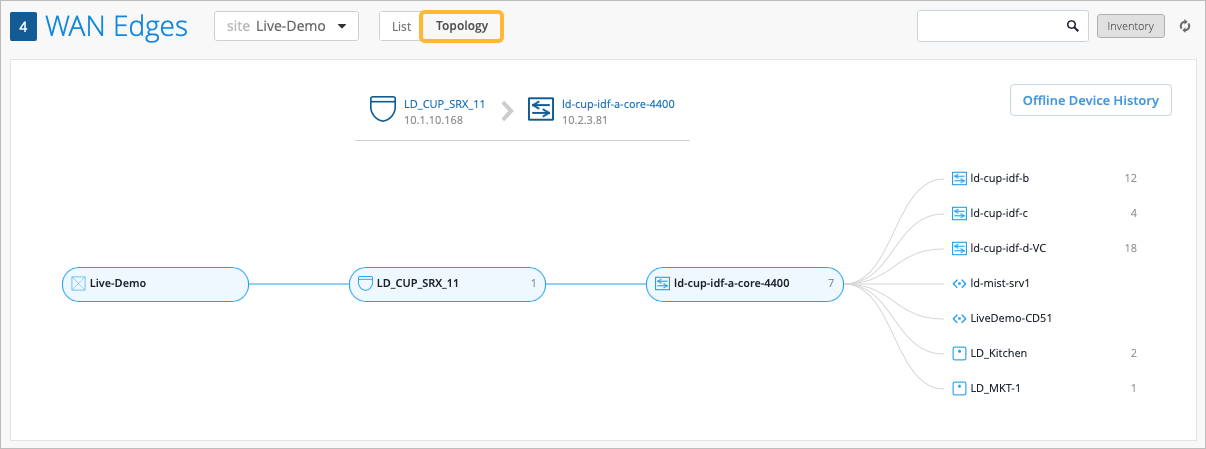
The Topology format presents the same information when you hover over the device name. Hover your mouse or click on the device name to get more detailed information.
Monitor the Device Information Page
Selecting your WAN Edge device from either the List or Topology view brings you to the Device Information page. The Device Information page provides basic device monitoring information for the WAN Edge device you selected.
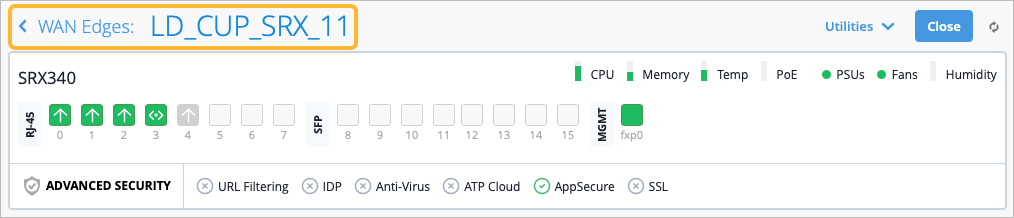
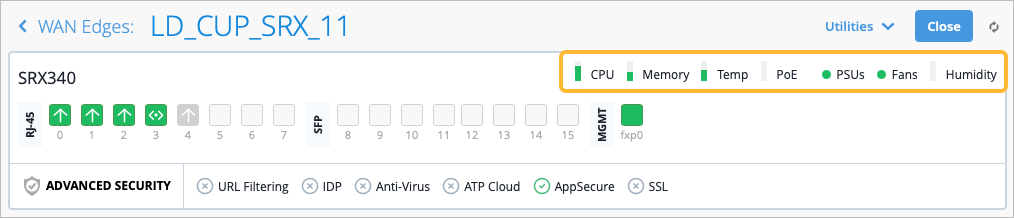
The CPU, Memory, and other status icons indicate the status of those behaviors for the device. Hover over each status icon for deeper insights. The icons that display depend on the type of WAN Edge device you have selected.
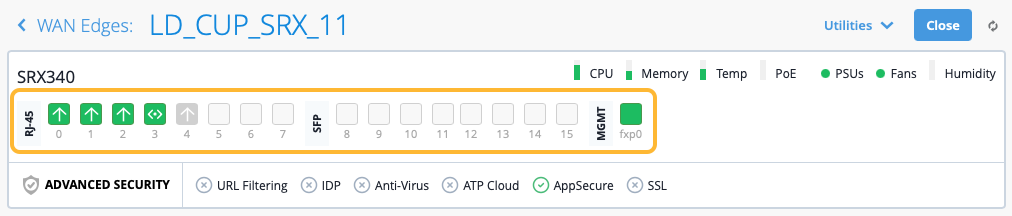
You can see a graphical front view of the device ports and baseline status information. Hover your mouse over an interface to see more information. For each Gigabit Ethernet interface, link information is displayed when you hover.
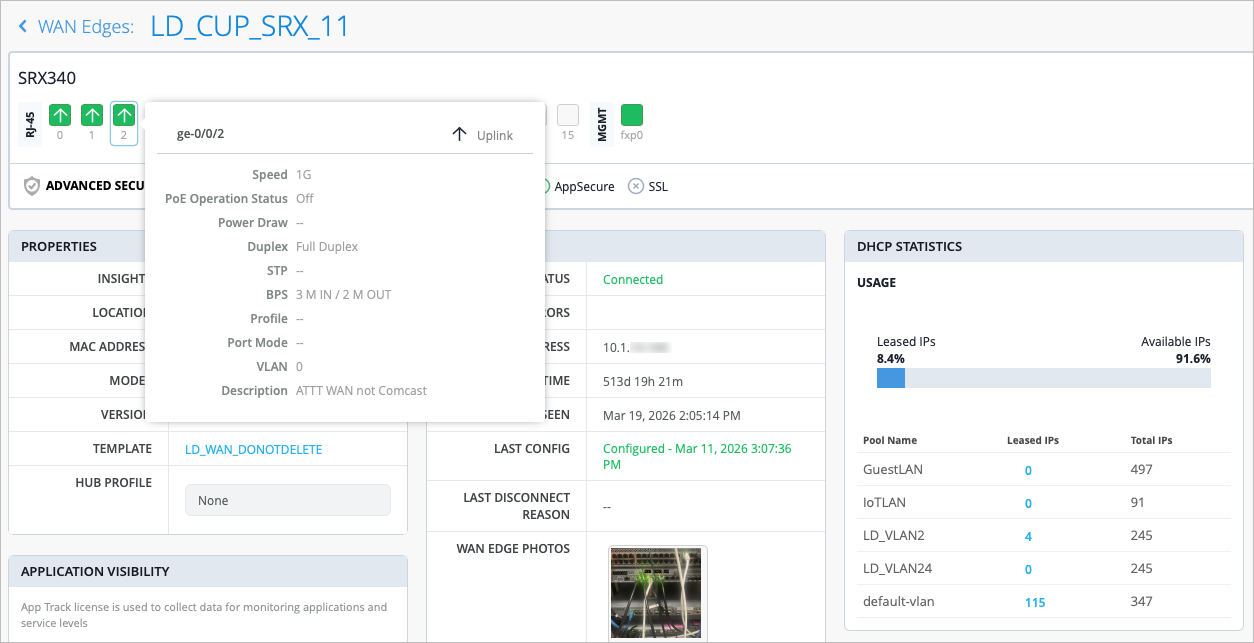
| Fields | Description |
|---|---|
| Speed | Rated speed |
| PoE Operation Status | Enabled or disabled |
| Power Draw (SRX Only) | Measured PoE power draw |
| Duplex | Full or half |
| STP | True or false |
| BPS | Bits/second |
| Profile | The name of the Port profile assigned to the port |
| Port Mode | The mode of the port profile configuration (Trunk, Access, Port Network, or VoIP Network) |
| VLAN | VLAN tag |
| Description | Interface description |
Advanced Security information is listed below the device ports with a green checkmark or an X, indicating whether the advanced security features are active on this device or not. In Figure 8, AppSecure is active with the green checkmark.
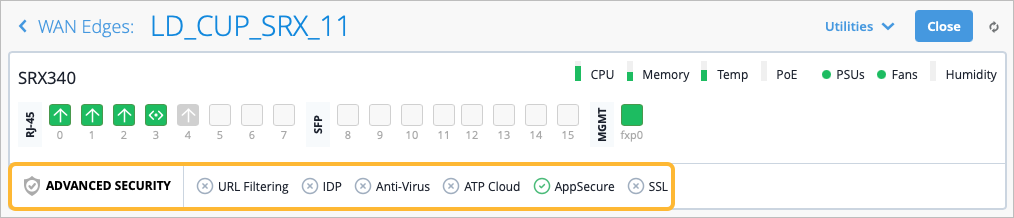
URL Filtering, IDP, and Anti-Virus are availble to configure on all WAN Edge devices, whereas SRX Series Firewalls offer SSL proxy and Advanced Threat Protection features like Advanced Anti-Malware, threat feeds, Domain Generation Algorithm (DGA), DNS tunnel detection, and IoT device policy to be configured as well.
Below the Advanced security section, you’ll find generalized platform-related data for your WAN Edge device in the Properties section, including:
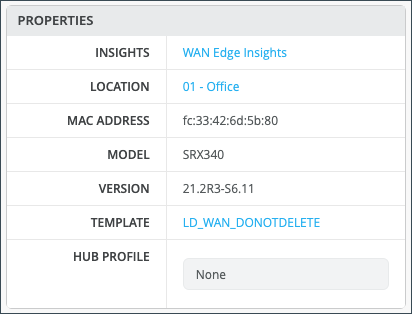
| Field | Description |
| Insights | Provides a direct link to WAN Edge Insights. |
| Location | Provides floorplan information. |
| MAC Address | MAC Address for the WAN Edge device. |
| Model | Indicates the SSR or SRX model. |
| Version | Version of SSR or SRX Software the device is running. |
| Template | The WAN Edge template applied to the device. |
| Hub Profile | The Hub Profile applied to the device. |
The Statistics section displays status and other key information about your platform.
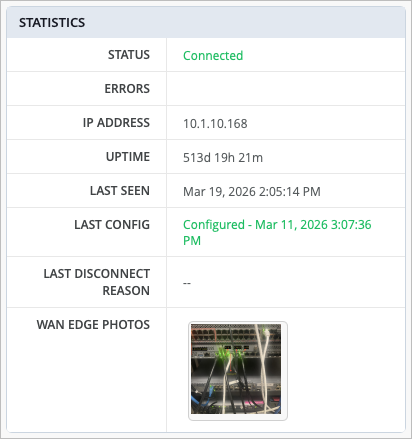
| Field | Description |
| Status | Connected/Disconnected |
| IP Address | The IP address of the WAN Edge device |
| Uptime | Day/Hour/Min uptime information |
| Last Seen | Last login |
| Last Config | Last Commit |
| Last Disconnect Reason | Reason for the most recent disconnection for the device |
| WAN Edge Photos | Photos of the WAN Edge device |
If you configured DHCP servers on the WAN router itself, there will also be a DHCP Statistics section with information about the leased IPs. This section presents IP information related to dynamic distributed IP addresses.
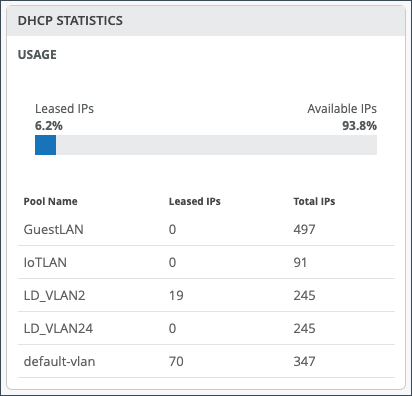
| Field | Description |
| Usage | The total percentage of Leased and Available IPs. |
| Pool Name | The name for given pool of addresses. |
| Leased IPs | The number of used IP addresses in each pool. |
| Total IPs | The total number of available IP addresses in each pool. |
In the Application Visibility (SRX Only) section, you can Enable Application Visibility for the device, which allows the Mist cloud to track and report applications that pass through the device. If the device has an App Track license, the license is used to collect data for monitoring applications and service levels.
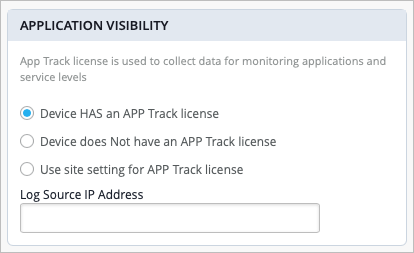
| Field | Description |
| Device has an App Track license | Application Visibility is already enabled on the device. |
| Device does NOT have an App Track license | The device does not have an application security license. |
| Use site setting for App Track license | Application visibility is enabled under Organization > Admin > Site Configuration > WAN Edge Advanced Security. |
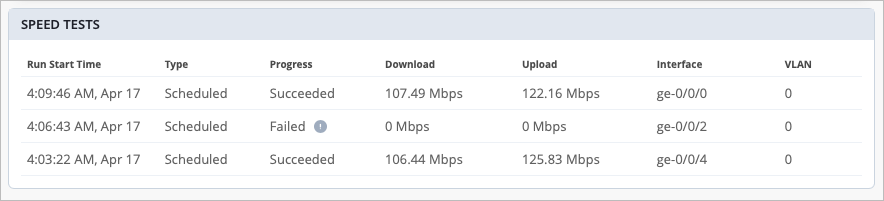
The Speed Tests section (SSR Only) appears only if speed tests have been run on your SSR WAN Edge device. This Speed Tests tool is used to test the speed of the WAN links on your WAN Edge devices to ensure optimal performance. This section displays the results of any speed tests that have been run on your SSR WAN Edge device.
| Fields | Description |
| Run Start Time | The time the test was started. |
| Type | Who performed the test (User or Scheduled). |
| Progress | In Progress, Succeeded, or Failed. |
| Download | Download speed in megabits per second (Mbps). |
| Upload | Upload speed in megabits per second (Mbps). |
| Interface | The interface of the WAN Edge device that the speed test was performed on. |
| VLAN | Displays the VLAN ID number. |
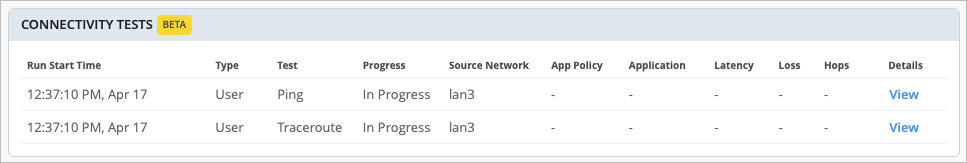
The Connectivity Tests (SRX Only) section is what displays if connectivity tests have been run on your SRX Series Firewalls to test WAN link performance. This section displays the results of any connectivity tests that have been run.
| Fields | Description |
| Run Start Time | The time the connectivity test was started. |
| Type | Who performed the test (User or Scheduled). |
| Test | The type of test (Example: Ping or Traceroute). |
| Progress | In Progress, Succeeded, or Failed. |
| Source Network | The source of the traffic. |
| App Policy | The application policy the traffic is following to reach its destination. |
| Application | The application that is trying to be accessed over the link (the destination of traffic). |
| Latency | The latency on the WAN link in milliseconds (ms). |
| Loss | The loss on the WAN link displayed in percentage. |
| Hops | Hop count |
| Details | Click the View link to see more detailed information about the connectivity test that was performed. |
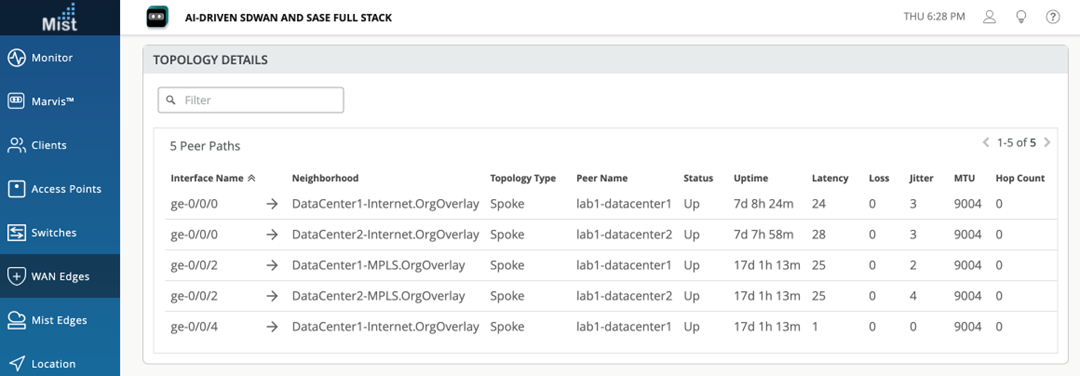
Topology Details (SSR Only) displays Peer Path information. When two SSRs are peered together, they send traffic to one another using Secure Vector Routing (SVR). The peer paths constructed between SSR peers are what generates and constructs the Session Smart SD-WAN network overlay. SSR peers establish and maintain connectivity to one another using Bi-directional Forwarding Detection (BFD).
| Fields | Description |
| Interface Name | Name |
| Neighborhood | The neighborhood that this router and its peer belong to. In Session Smart networking, a Neighborhood is a connected Layer 3 network that constructs the peering connections between SSRs. |
| Topology Type | The topology type of the neighborhood that the peer SSRs belong to. The topology type allows the Session Smart Conductor to distribute peer paths and other configuration to the routers in the neighborhood. |
| Peer Name | The name of the peer SSR. |
| Status | Indicates in the peer path is up or down. |
| Uptime | Time live |
| Latency | The latency on the peer path. |
| Loss | The packet loss as a percentage. |
| Jitter | The jitter on the peer path. |
| MTU | Maximum Transmission Unit |
| Hop Count | How many hops (routers) a packet passes through before reaching its destination. |
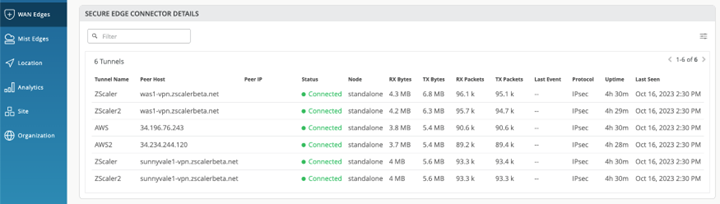
If you have Secure Edge Connectors configured, you will see the Secure Edge Connector Details section, which includes tunnel information from your WAN Edge connection to the Secure Service Edge (SSE). See Juniper Mist Secure Edge Connector Overview.
| Fields | Description |
| Tunnel Name | Name |
| Peer Host | The IP address or hostname of the peer |
| Peer IP | IP address of the peer |
| Status | Connected/Disconnected |
| Node | Standalone/High Availability (HA) |
| RX Bytes | Volume of data, in bytes, received by the interface. |
| TX Bytes | Volume of data, in bytes, transmitted by the interface. |
| RX Packets | Packets received by the interface. |
| TX Packets | Packets transmitted by the interface. |
| Last Event | System events |
| Protocol | Transport protocol the tunnel is using (Example: IPsec or GRE). |
| Uptime | Time live |
| Priority | Primary/Secondary |
| WAN Port | The port the tunnel is using. |
| Last Seen | Last login |
If you continue scrolling, you can view the WAN Edge configuration to help monitor and troubleshoot your WAN Edge device. You can view the WAN Edge configuration to help monitor your WAN Edge device in the Juniper Mist™ portal.