Monitor SRX Series Firewall Deployed as WAN Edge
Use the WAN Edges page, the Insights page, and the Alerts page to quickly find device information, event details, and alerts for your SRX Series Firewalls.
In monitoring a Juniper® SRX Series Firewall deployed as a WAN edge device, you’ll explore the most efficient ways to monitor your WAN edge device in the Juniper Mist™ portal following your initial deployment phase.
Monitoring WAN Edges
From the left menu, select WAN Edges > WAN Edges to view basic device monitoring information. Notice the organization name at the top of the portal. This is the largest container and represents your entire organization. Beneath the organization name, you can see your site devices in either a List format or a graphical Topology format.
In this example, Live Demo is your organization, and LD_CUP_SRX_11 is the selected WAN Edge device.
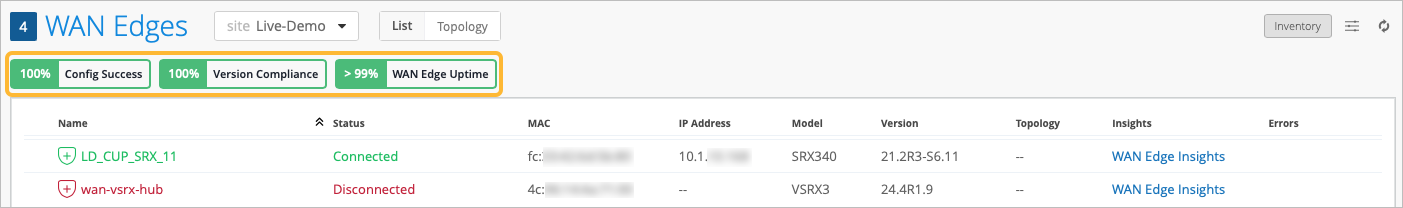
The tiles across the top provide high-level information:
- Config Success—Percentage of online WAN edges with successful configuration.
- Version Compliance—Percentage of WAN edges that have the same software version per model.
- WAN Edge Uptime—Percentage of time a WAN edge was up during the past seven days, averaged across all WAN edges.
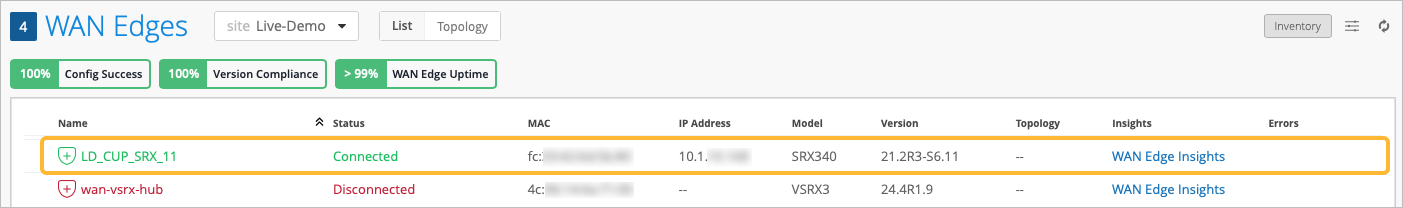
The WAN Edge list view contains columns with device detail information, as shown in Table 1.
| Fields | Description |
|---|---|
| Name | Name of the WAN Edge device |
| Status | Connected or disconnected |
| MAC | MAC address |
| IP Address | IP address |
| Model | Juniper Networks® SRX Series Firewall or Juniper® Session Smart™ Router model. |
| Version | SRX or SSR Software Version |
| Topology | Hub or Spoke |
| Insights | Provides a direct link to the WAN Edge Insights page. |
| Errors | Error state |
The Topology format presents the same information as the List view when you hover over the device name. Hover your mouse or click on the device name to get more detailed information in the topology view.
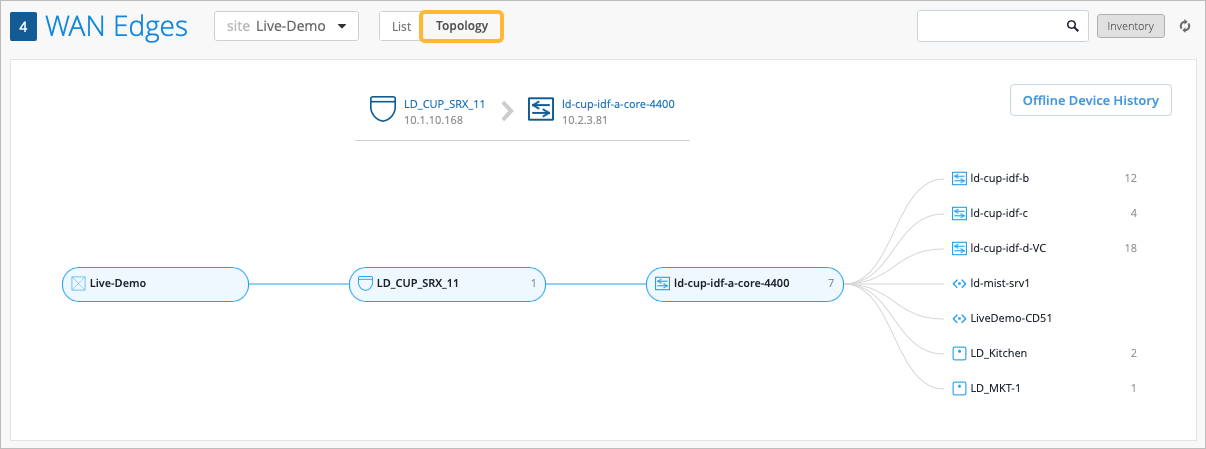
On both the List and Topology view, selecting your WAN edge device brings you to its Device Information page. The Device Information page provides different categories of monitoring information for your WAN edge device.
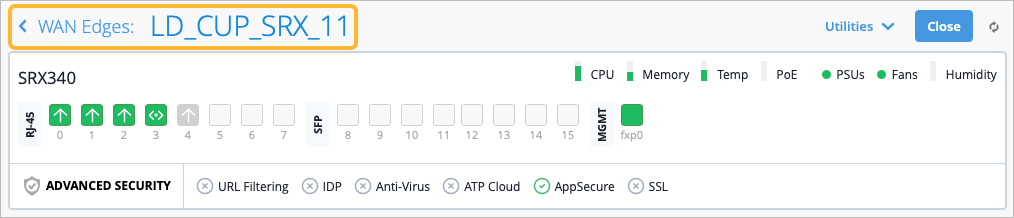
The first thing you’ll notice on the Device Information Page are details about the WAN edge device you selected, (LD_CUP_SRX_11 in the figure). The information includes a graphical front view of the device ports and baseline status information such as CPU and memory utilization.
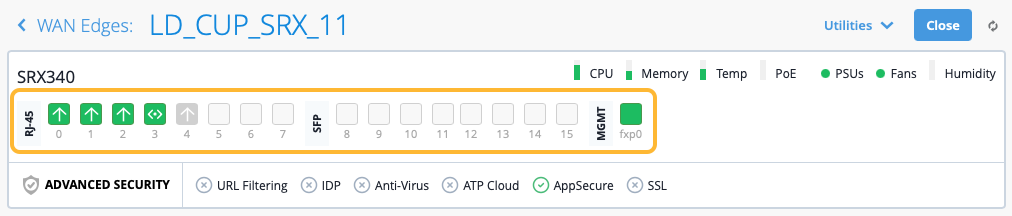
For each Gigabit Ethernet interface, you’ll find link information. Hover your mouse over an interface to see more information.
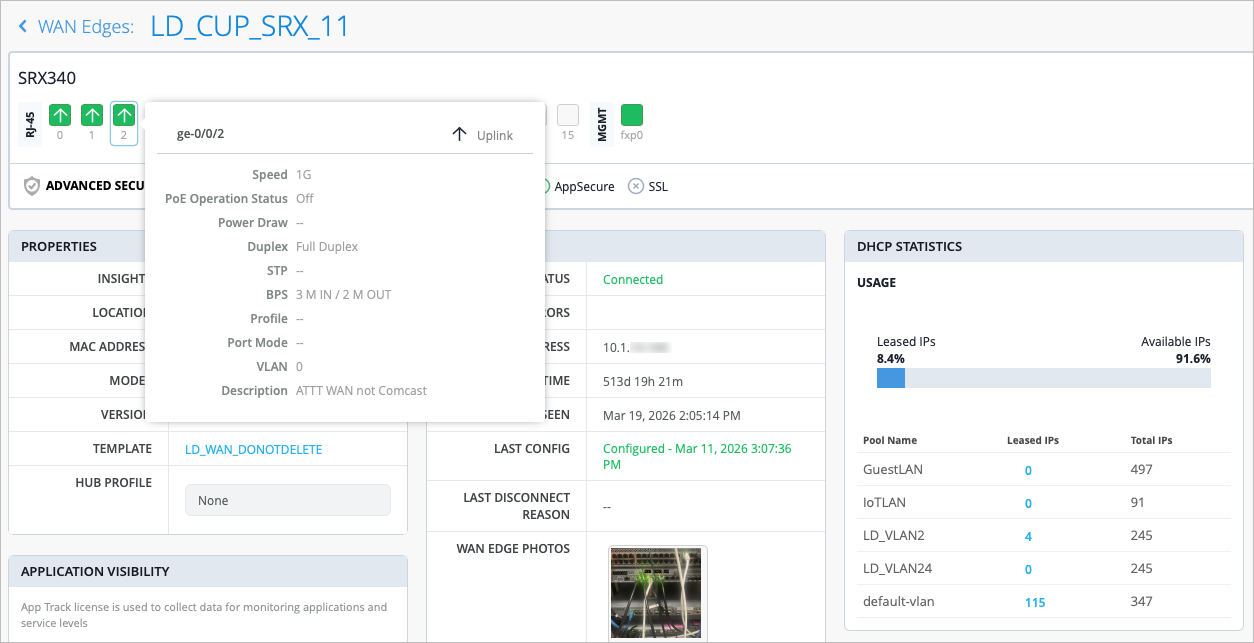
| Fields | Description |
|---|---|
| Speed | Rated speed |
| PoE Operation Status | Enabled or disabled |
| Power Draw | Measured PoE power draw |
| Duplex | Full or half |
| STP | True or false |
| BPS | Bits/second |
| Profile | The name of the Port profile assigned to the port |
| Port Mode | The mode of the port profile configuration (Trunk, Access, Port Network, or VoIP Network) |
| VLAN | VLAN tag |
| Description | Interface description |
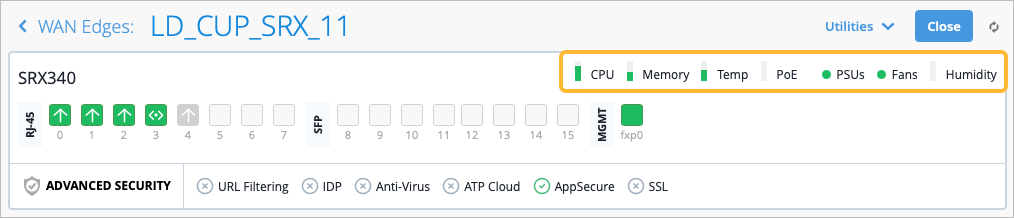
The CPU, Memory, and other status icons indicate how your device behaves. Hover over each status icon for deeper insights.
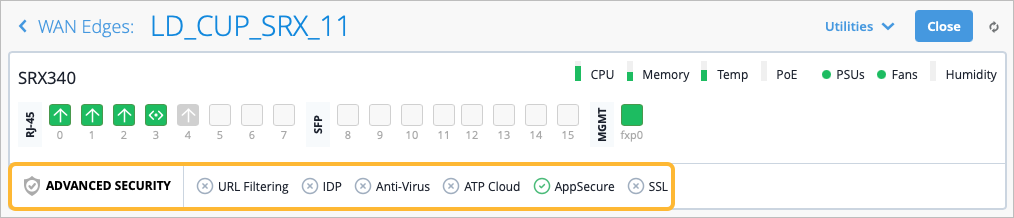
Advanced Security information is listed below the device ports with a check mark or an X, indicating whether URL filtering, intrusion detection and prevention (IDP), AppSecure (for application visibility), and other security features are active on this device. In Figure 8, AppSecure is active with the green check mark.
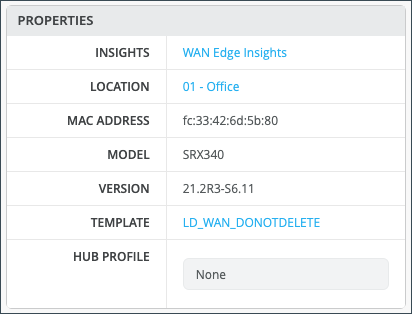
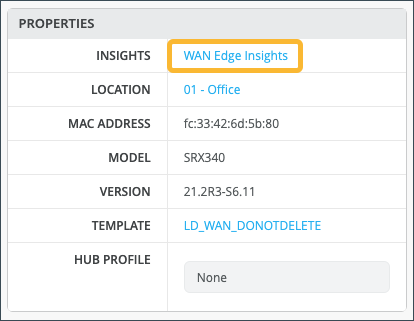
Below the Advanced security section, you’ll find generalized platform-related data for your WAN edge device in the Properties section, including:
| Field | Description |
| Insights | Provides a direct link to WAN Edge Insights. |
| Location | Provides floorplan information. |
| MAC Address | MAC Address for the SRX device. |
| Model | Indicates the SRX model. |
| Version | Version of SRX Software the device is running. |
| Template | The WAN edge template applied to the device. |
| Hub Profile | The Hub Profile applied to the device. |
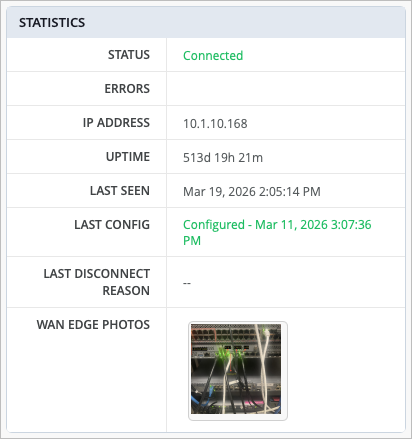
Statistics displays action information about your platform.
| Field | Description |
| Status | Connected/Disconnected |
| Errors | Error Status |
| IP Address | The IP address of the WAN edge device |
| Uptime | Day/Hour/Min uptime information |
| Last Seen | Last login |
| Last Config | Last Commit |
| Last Disconnect Reason | Reason for the most recent disconnection for the device |
| WAN Edge Photos | Photos of the WAN edge device |
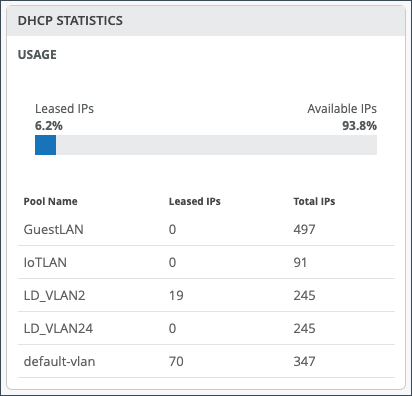
If you configured DHCP servers on the WAN router itself, there will also be a DHCP Statistics section with information about the leased IPs. This section presents IP information related to dynamic distributed IP addresses.
| Field | Description |
| Usage | The total percentage of Leased and Available IPs. |
| Pool Name | The name for given pool of addresses. |
| Leased IPs | The number of used IP addresses in each pool. |
| Total IPs | The total number of available IP addresses in each pool. |
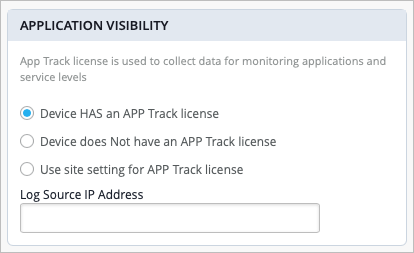
In the Application Visibility section, you can enable application visibility for the device, which allows the Mist cloud to track and report applications that pass through the device. If the device has an App Track license, the license is used to collect data for monitoring applications and service levels.
| Field | Description |
| Device has an App Track license | Application Visibility is already enabled on the device. |
| Device does NOT have an App Track license | The device does not have an application security license. |
| Use site setting for App Track license | Application visibility is enabled under Organization > Admin > Site Configuration > WAN Edge Advanced Security. |
Scrolling down on the Device Information page, configuration information displays for your WAN Edge. Usually, WAN edges inherit WAN Edge Templates or Hub Profiles. However, you can make changes at the device level to have the configuration be pushed to only that device. In this example, a "standalone" WAN Edge Template was used.
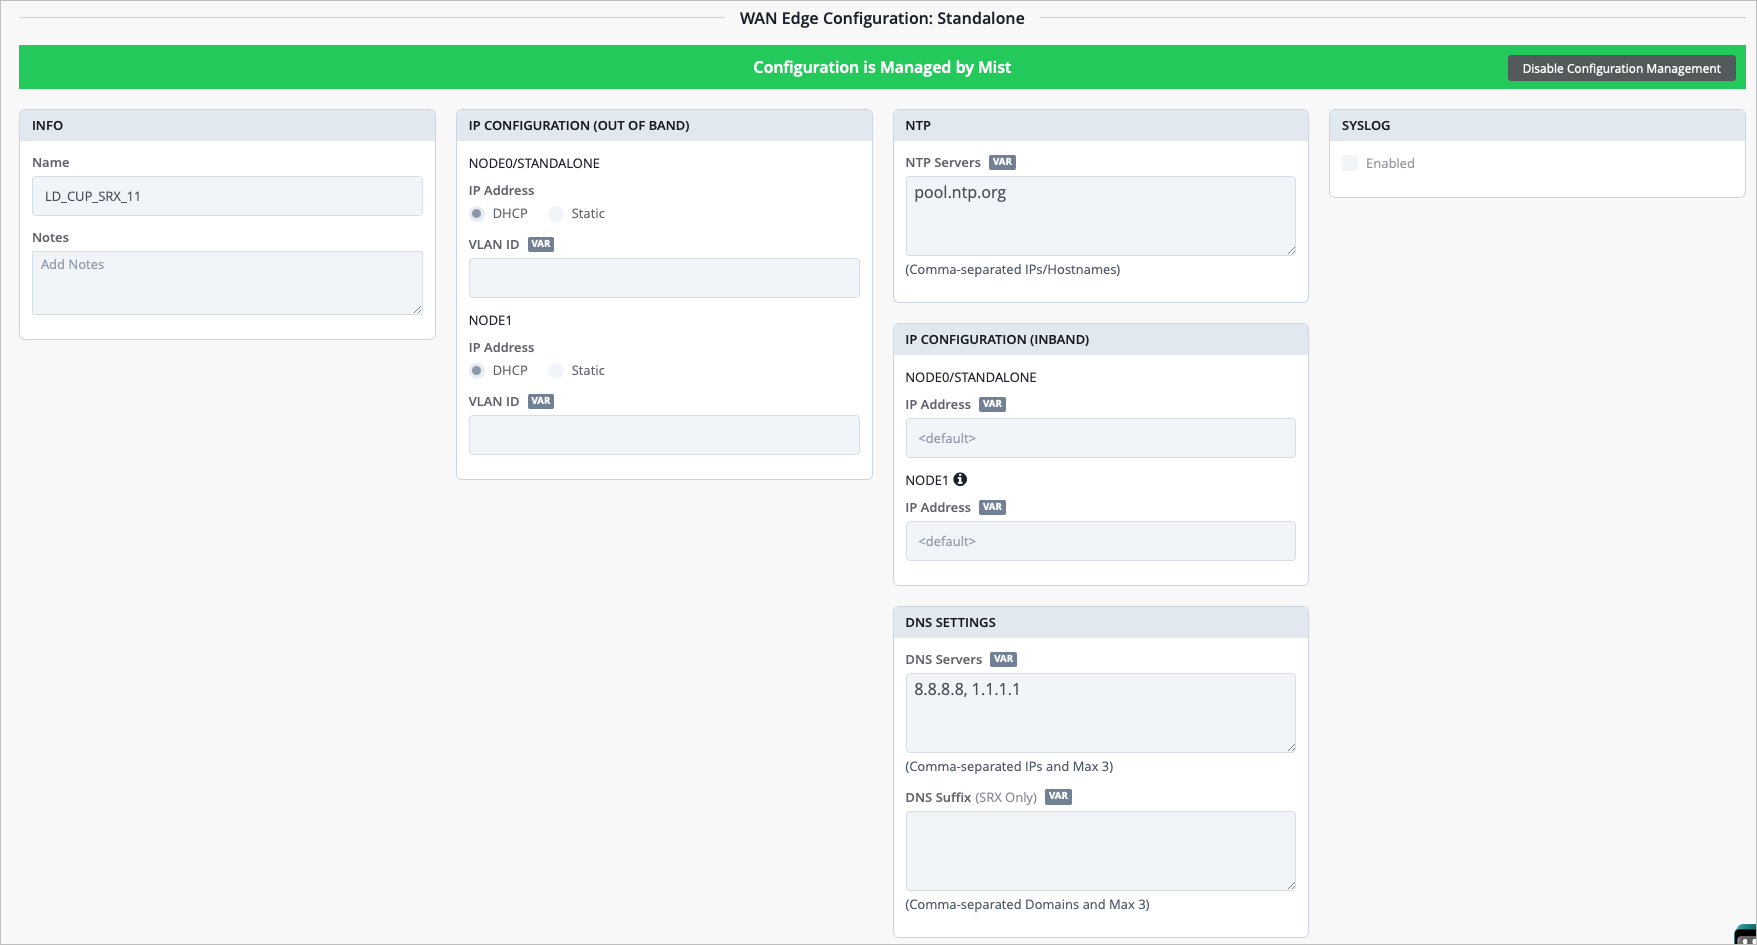
| Section | Description |
| Info | The name of the SRX device and Notes about the device. |
| IP Configuration (Out of Band) | For each node of the device, select DHCP or Static for the IP address and enter a VLAN ID. |
| NTP | Time Servers IP/Hostnames (you can enter comma-separated IP addresses or hostnames). |
| IP Configuration (In Band) | For each node of the device, select DHCP or Static for the IP address and enter a VLAN ID. |
| DNS Settings | DNS Servers, DNS Suffix (SRX Only). |
| Syslog | Select the checkbox to enable Syslog (system logging). |
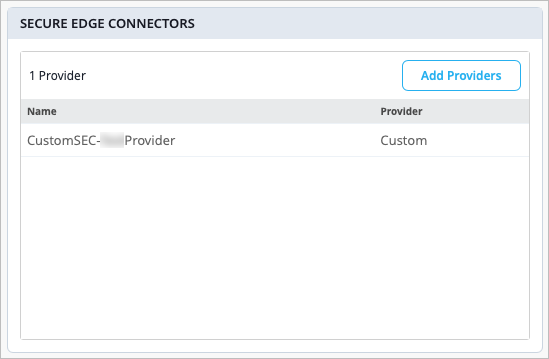
The Secure Edge Connectors section is where you can configure providers for your Secure Service Edge (SSE) deployments. These connectors facilitate seamless integration for such deployments.
Scrolling past the configuration, you’ll find information for your connected WANs and LANs.
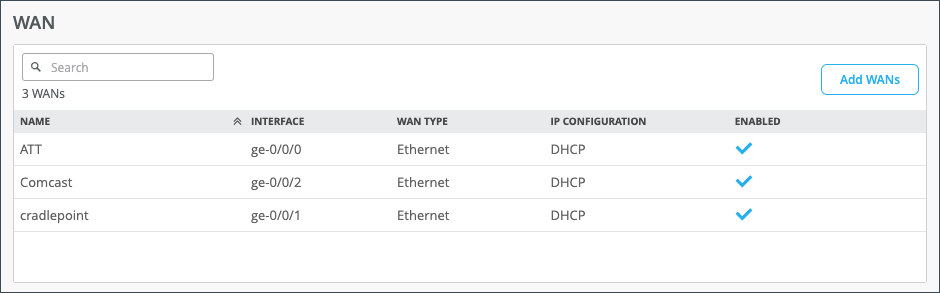
| Field | Description |
| Name | Selected WAN Interface Name |
| Interface | Supports one of these interfaces for aggregation: ge-0/0/1, ge-0/0/1-5, or reth0. |
| WAN Type | Ethernet, DSL (SRX Only), or LTE |
| IP Configuration | DHCP, Static, or PPPoE |
| Enabled | The blue checkmark indicates that the interface is enabled. |
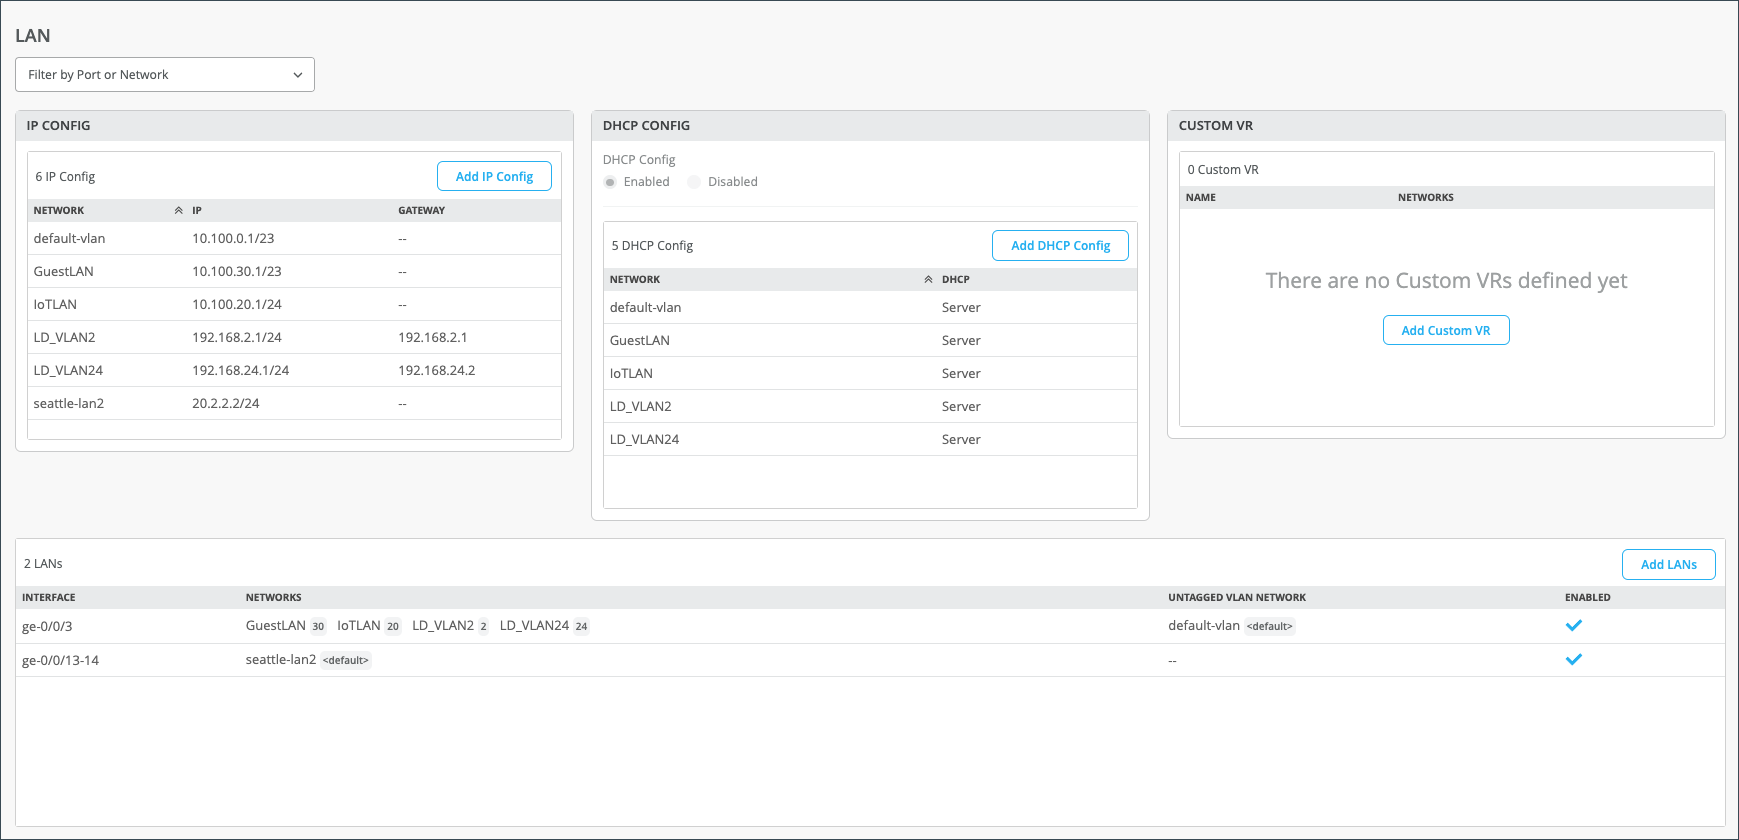
| Section | Description |
| IP Config | Network name, IP Address, Gateway Address (SSR Only). |
| DHCP Config | Server or Relay. |
| Custom VR | A virtual router that you can configure to be used in automatic route leaking. |
| LANs |
|
Scrolling down, you have sections for Traffic Steering, Application Policies, and Routing (OSPF, BGP, Routing Policies, and Static Routes).
The Traffic Steering and Application Policies sections show how you use the SRX Series Firewall to create rules for path preference and routing behavior. Note that on the SRX Series Firewall deployed as a WAN edge, the Application Policy and Traffic Steering path determine destination zones and must be assigned.
Traffic Steering enables you to define different paths that traffic can take to reach its destination. Traffic Steering policies allow you to specify the paths for traffic to traverse, as well as the strategies for utilizing those paths.
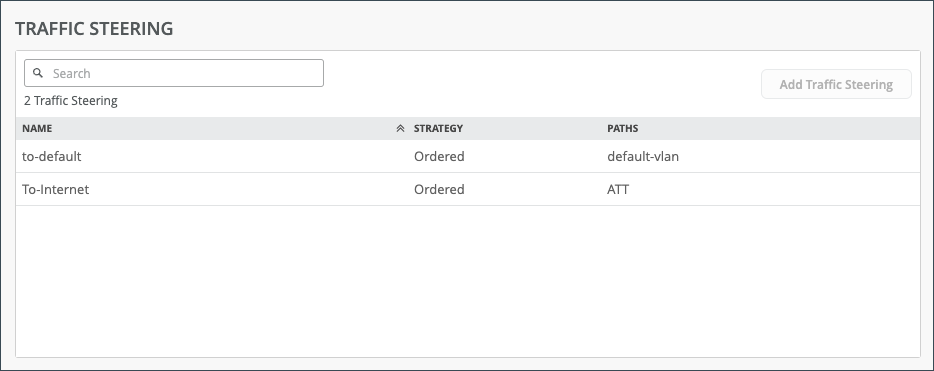
| Field | Description |
| Name | The name of the Traffic Steering policy. |
| Strategy | Ordered, Weighted, ECMP. |
| Paths | LAN, WAN, Secure Edge Connector. |
Application Policies are security policies in the Juniper WAN Assurance design, where you define which network and users can access which applications, and you assign a traffic steering path which those networks or users will use to access the application or destination. These elements become matching criteria to allow access to or block access from applications or destinations.
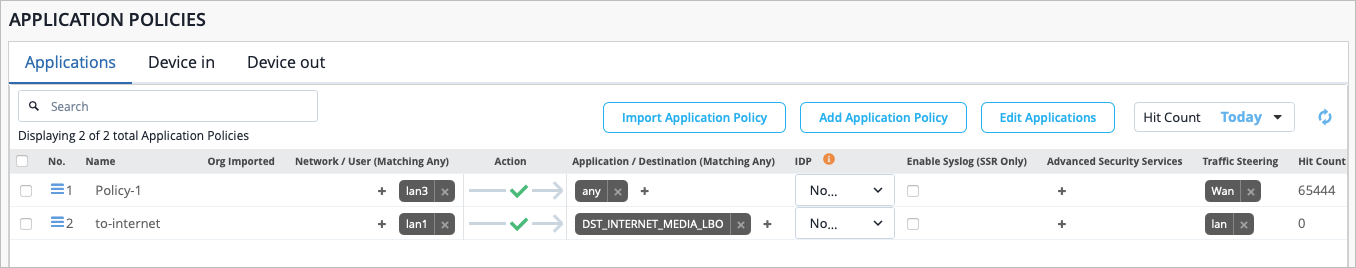
In the Juniper Mist™ cloud portal, the Network/User setting determines the source zone. The Application/Destination and Traffic Steering settings determine the destination zone. Traffic Steering paths determine the destination zone in Juniper Networks® SRX Series Firewalls, so ensure that you assign Traffic Steering profiles to the Application Policies.
| Field | Description |
| Number | Ordered Policy Number |
| Name | Application policy name |
| Org Imported | Indicates if the policy was pushed down from the Organization level to the Site. |
| Network/User (Matching Any) | The “source” of your traffic |
| Action | Allow or Block |
| Application/Destination (Matching Any) | The “destination” for your traffic. |
| IDP | Indicates IDP/URL filtering (requires separate license) |
| Enable Syslog (SSR Only) | Select the checkbox to enable system logging (SSR Only). |
| Advanced Security Services | Add Anti-Virus, SSL Proxy (SRX Only), Security Intel (SRX Only), Anti-Malware (SRX Only), DNS Tunnel Detection, Domain Generation Algorithm, IoT Device Policy, and HTTP Inspection. |
| Traffic Steering | Indicates path for traffic |
| Hit Count | Indicates the number of times an application policy rule has been triggered (matched) by traffic. |
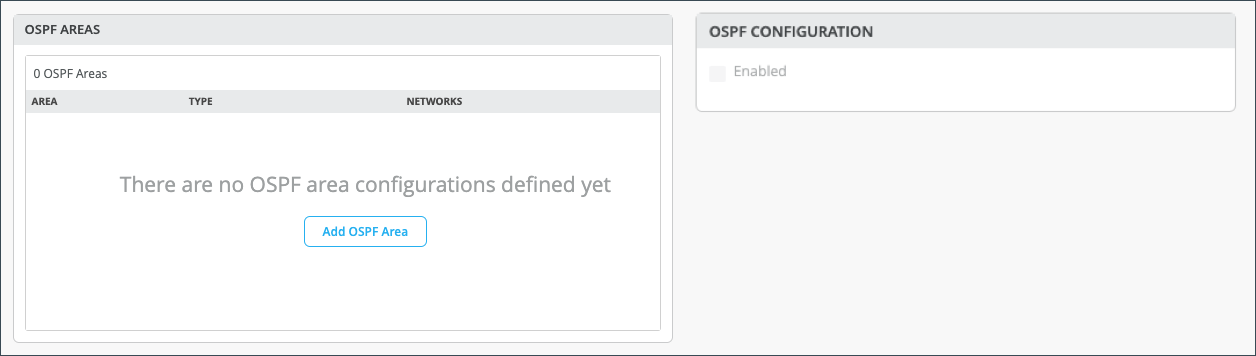
Use the OSPF Areas section to configure Open Shortest Path First (OSPF) on your SRX Series Firewall, which is used to determine the best path for forwarding IP packets. OSPF segments a network to improve scalability and control the flow of routing information. See OSPF .
|
Field |
Description |
|---|---|
|
Area |
The identification area that your OSPF network or SRX Series Firewall belongs to. |
|
Type |
This is the OSPF Area type. Select Default (Area 0), Stub, or Not So Stubby Area (NSSA). |
|
Networks |
The name of your OSPF network. |
| Enabled |
Selecting this check box causes the Enable OSPF Areas button to become selectable. |
You can configure Border Gateway Protocol (BGP) for your SRX Series Firewall deployed as a WAN edge device in the BGP section. You would configure BGP on your SRX device by can clicking Add BGP Group here.
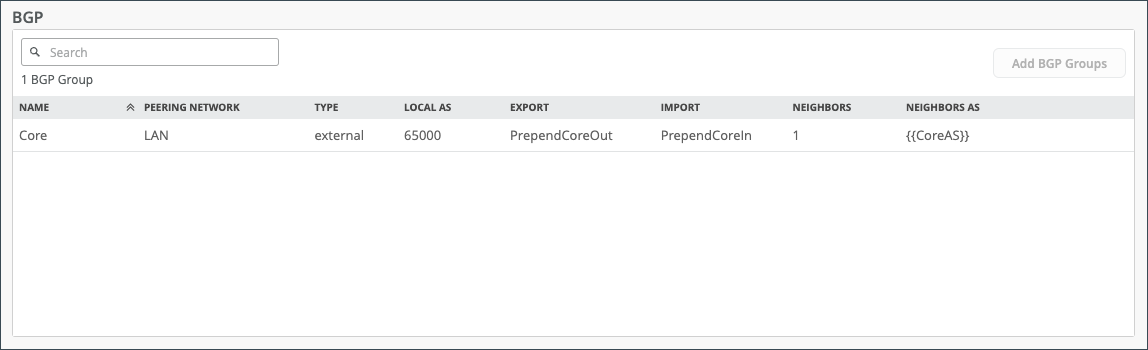
| Field | Description |
| Name | BGP Name |
| Peering Network | The type of network being used for your BGP peering (WAN or LAN). |
| Type | Type of BGP Route (Internal or External). |
| Local AS | Autonomous System Number |
| Export | Export Route |
| Import | Import Route |
| Neighbors | Neighbor Route |
| Neighbor AS | Autonomous System Number for Neighbor Route |
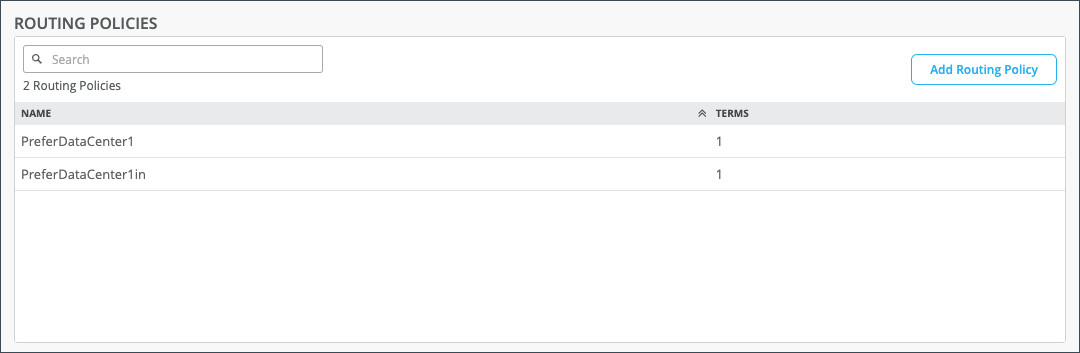
The Routing Policies section enables you to configure path preference and allows you to determine traffic behavior.
|
Field |
Description |
|---|---|
|
Name |
The name of your routing policy. |
|
Terms |
These are the policy conditions such as prefix, routing protocol, and actions. |
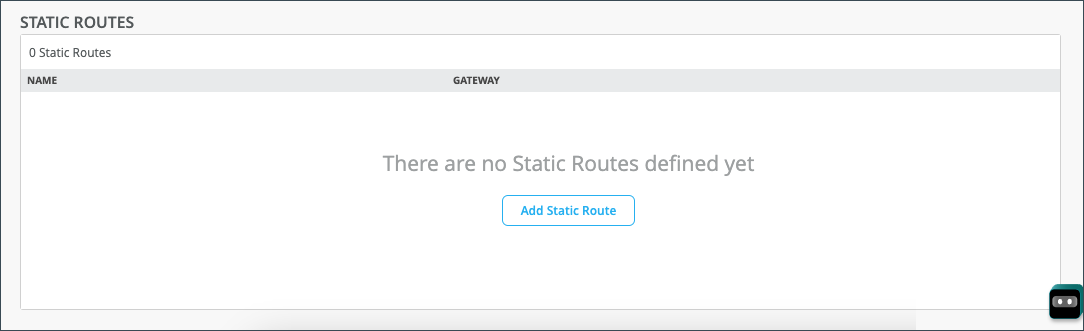
The Static Routes section allows you to manually define the routes that your SRX Series Firewall deployed as a WAN edge device will use.
|
Field |
Description |
|---|---|
|
Name |
The name of your static route. |
|
Gateway |
The gateway that your static route will use when routing traffic. |
View Device Information and WAN Edge Insights
WAN Edge Insights
The Properties pane for your selected WAN Edge contains a link to the WAN Edge Insights page. Click WAN Edge Insights for the next level of information about your WAN edge device.
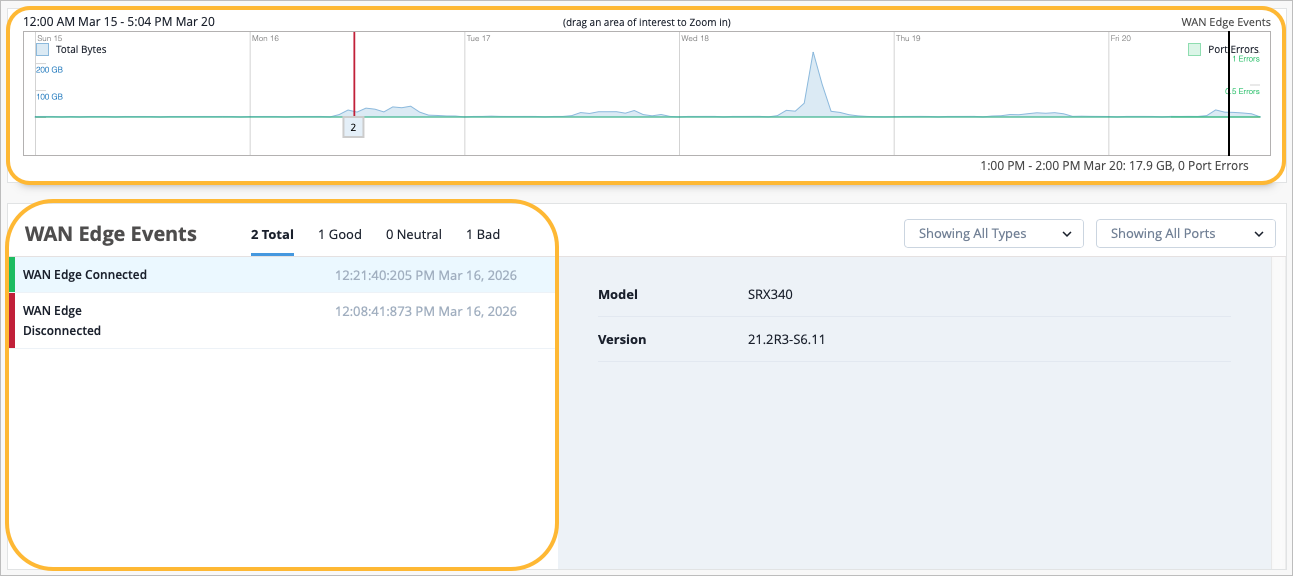
Next to the selected WAN Edge (LD_CUP_SRX_1) on the Insights page, you can select a time frame for selected information. The default view is Today, but this can be set to a customized date or range of dates. Below this, you find (when the site location information is configured) where this WAN edge is configured via a street map.
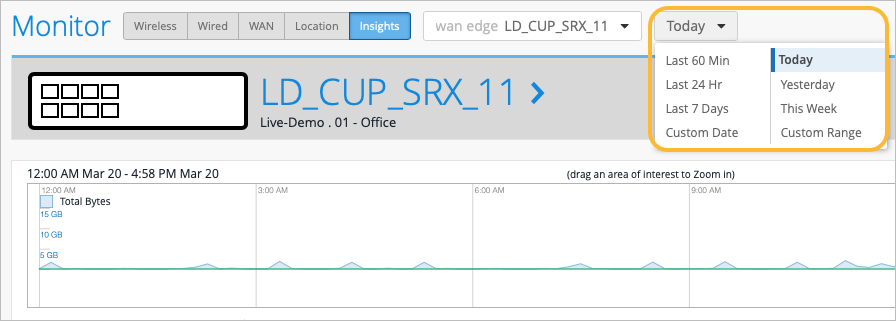
With your time frame selected, WAN Edge Events displays a time line of the traffic through the WAN edge during your specified time, and also displays a list of events.
Select a specific event in the listed WAN Edge Events for greater detail of the Total, Good, Neutral, and Bad events.
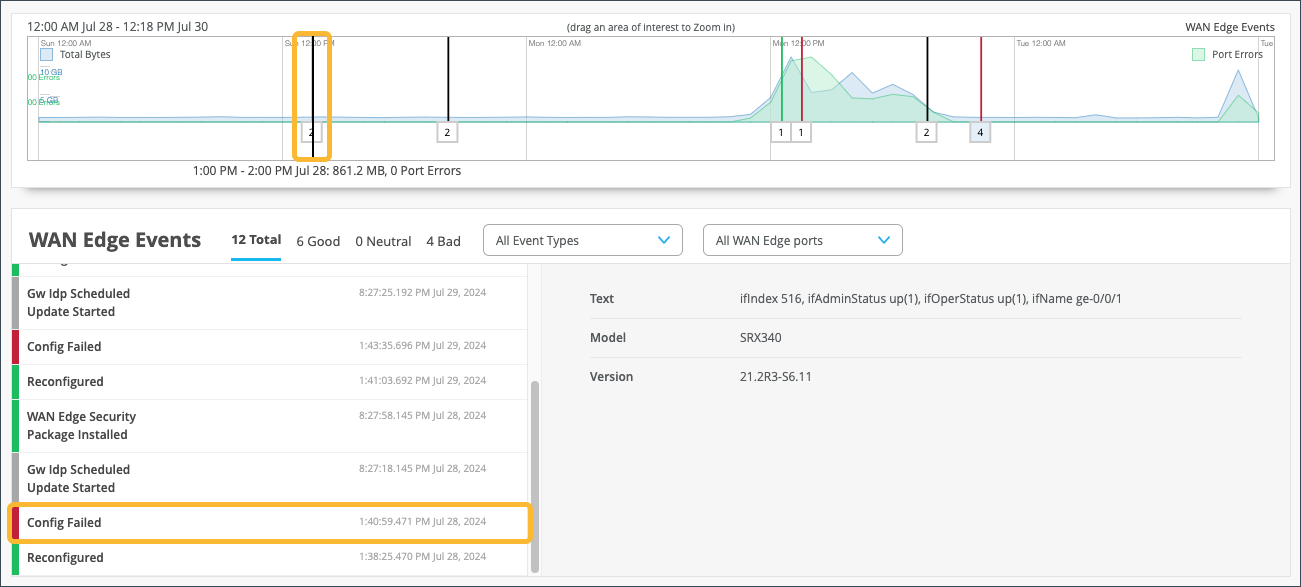
Your selection expands and displays detailed information about the selected time.
For a detailed portion of time, select a window of time with the mouse cursor. By doing this, you’re able to adjust the window of events and isolate specific Good, Neutral, and Bad occurrences that happened on your network. With a smaller section, you’ll get a more detailed view of that period.
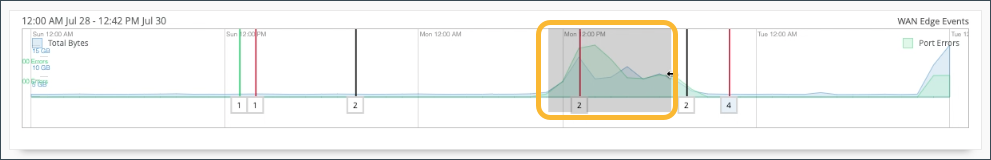
Scroll down on the WAN Edge Events page for deeper insights within your selected period.
In the WAN Edge Events section, you can narrow down the type of event by selecting a modifier in the Event Type drop-down menu. You can also filter your search by limiting the event types to a specific port.

The Table Capacity section provides you with quick access to the FIB tables and Session tables for each node of your device:
-
FIB Entries: Displays the current number of FIB entries and the percentage of utilization; essentially showing how much of the available FIB space is currently being used.
-
Session Flows: Displays the current number of active sessions and the percentage of session flow utilization based on the device's capacity.
In the case of a high availability cluster, Table Capacity indicators are displayed for each node.
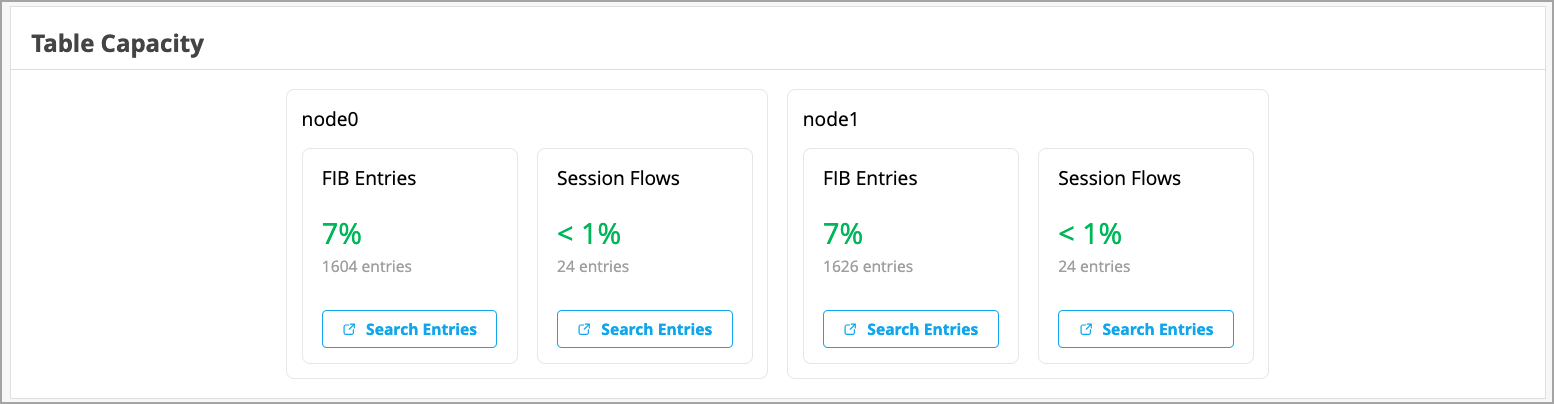
You can also click the Search Entries button under each metric to open a shell view in a new window where you can search for entries after specifying filters.
The Applications section of the Insights page lets you view reports on applications. It is divided into four tabs (Categories, Apps, Applications, and Clients).
Ensure you’ve had a few hours for these metrics to be populated following initial deployment.
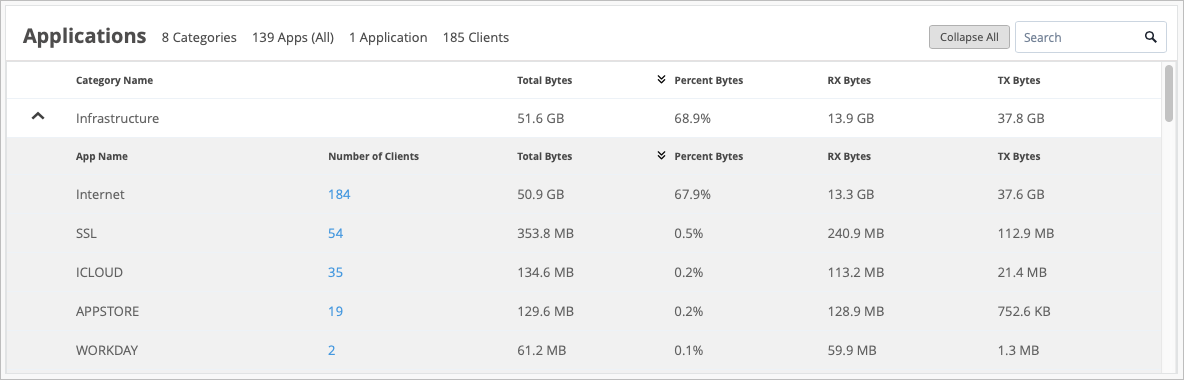
On the Categories tab, in the Number of Clients column, you can click on the number to see more information about the clients using the application, such as the Client name, MAC Address, IP Address, Device Type, Bytes, and % Bytes being used.
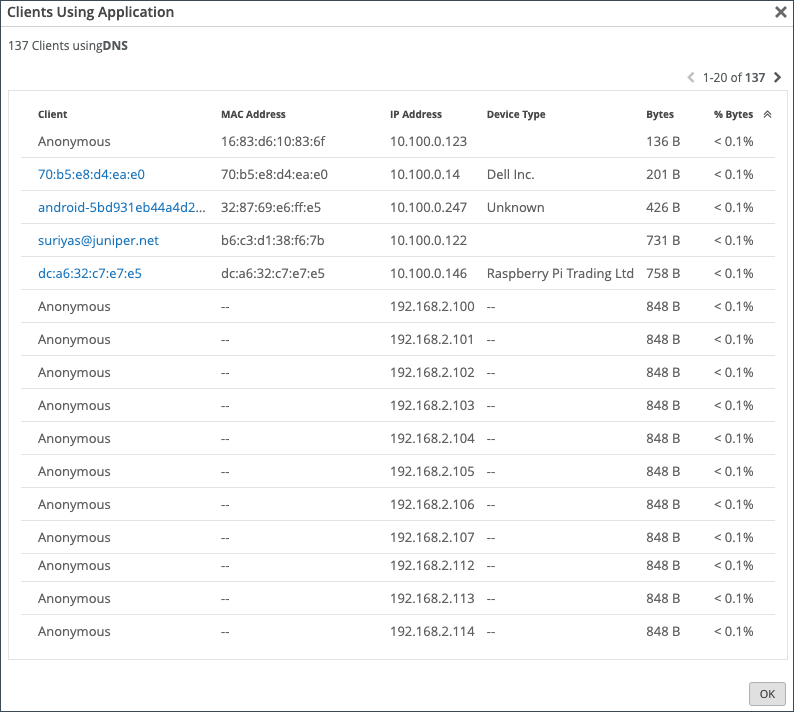
For SRX Series Firewalls deployed as a WAN Edge running a DHCP server, clients using that application will display a HostName in the Client column if available. Otherwise, the MAC address will be displayed. Device Type and MAC Address columns will be populated as well.
In the Apps tab, hover over the App Name to see more details about the services.
Use the Applications tab to monitor and troubleshoot specific application behavior.
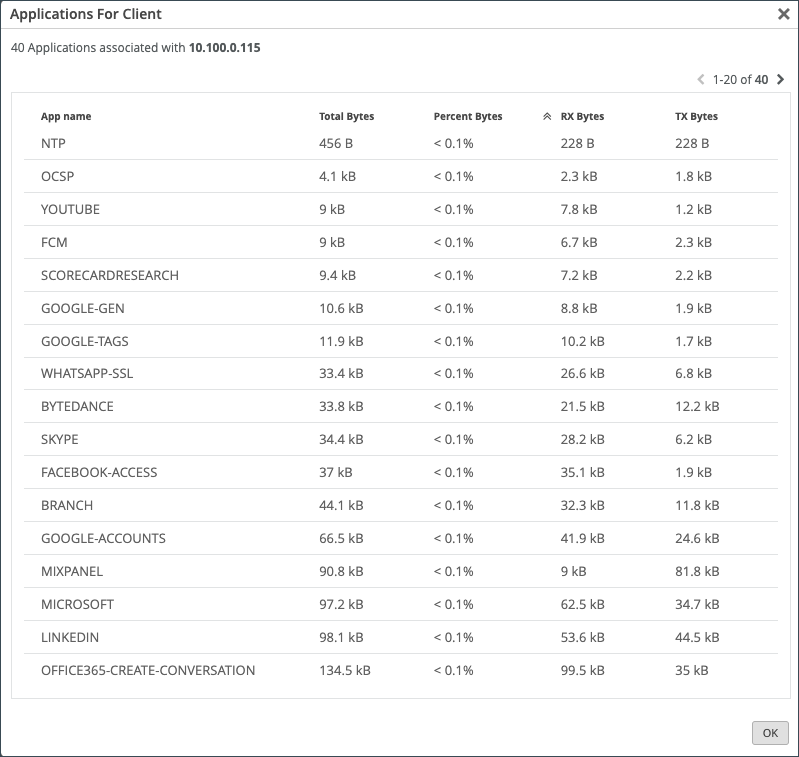
Click the Clients tab to see how much bandwidth a particular client is using, as well as a client's use of a particular application. You can click the number in the Number of applications column to see more information regarding the client's application use.
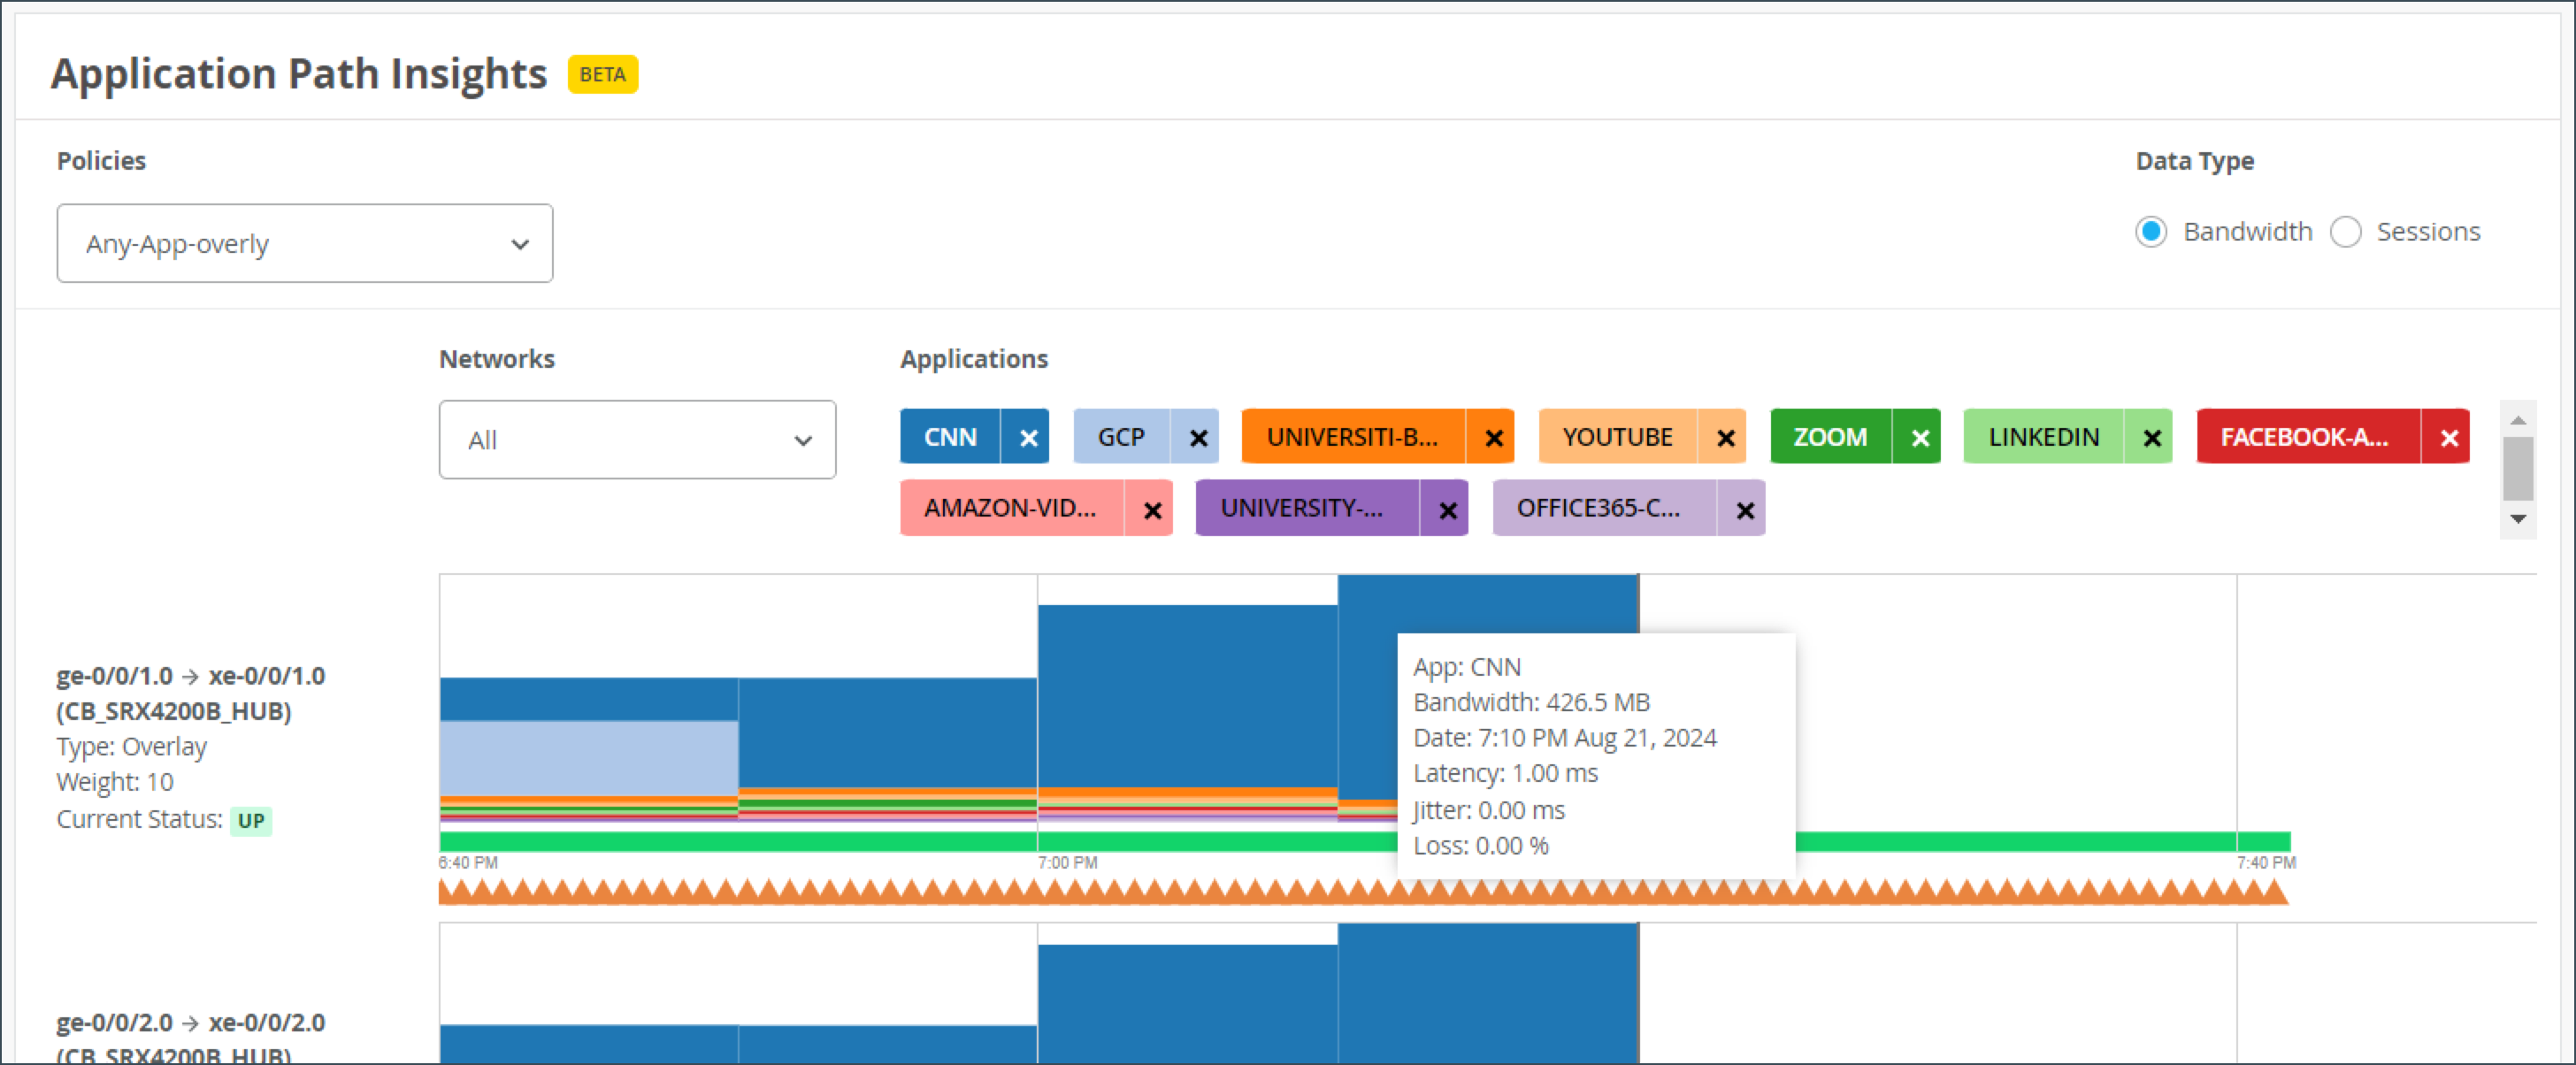
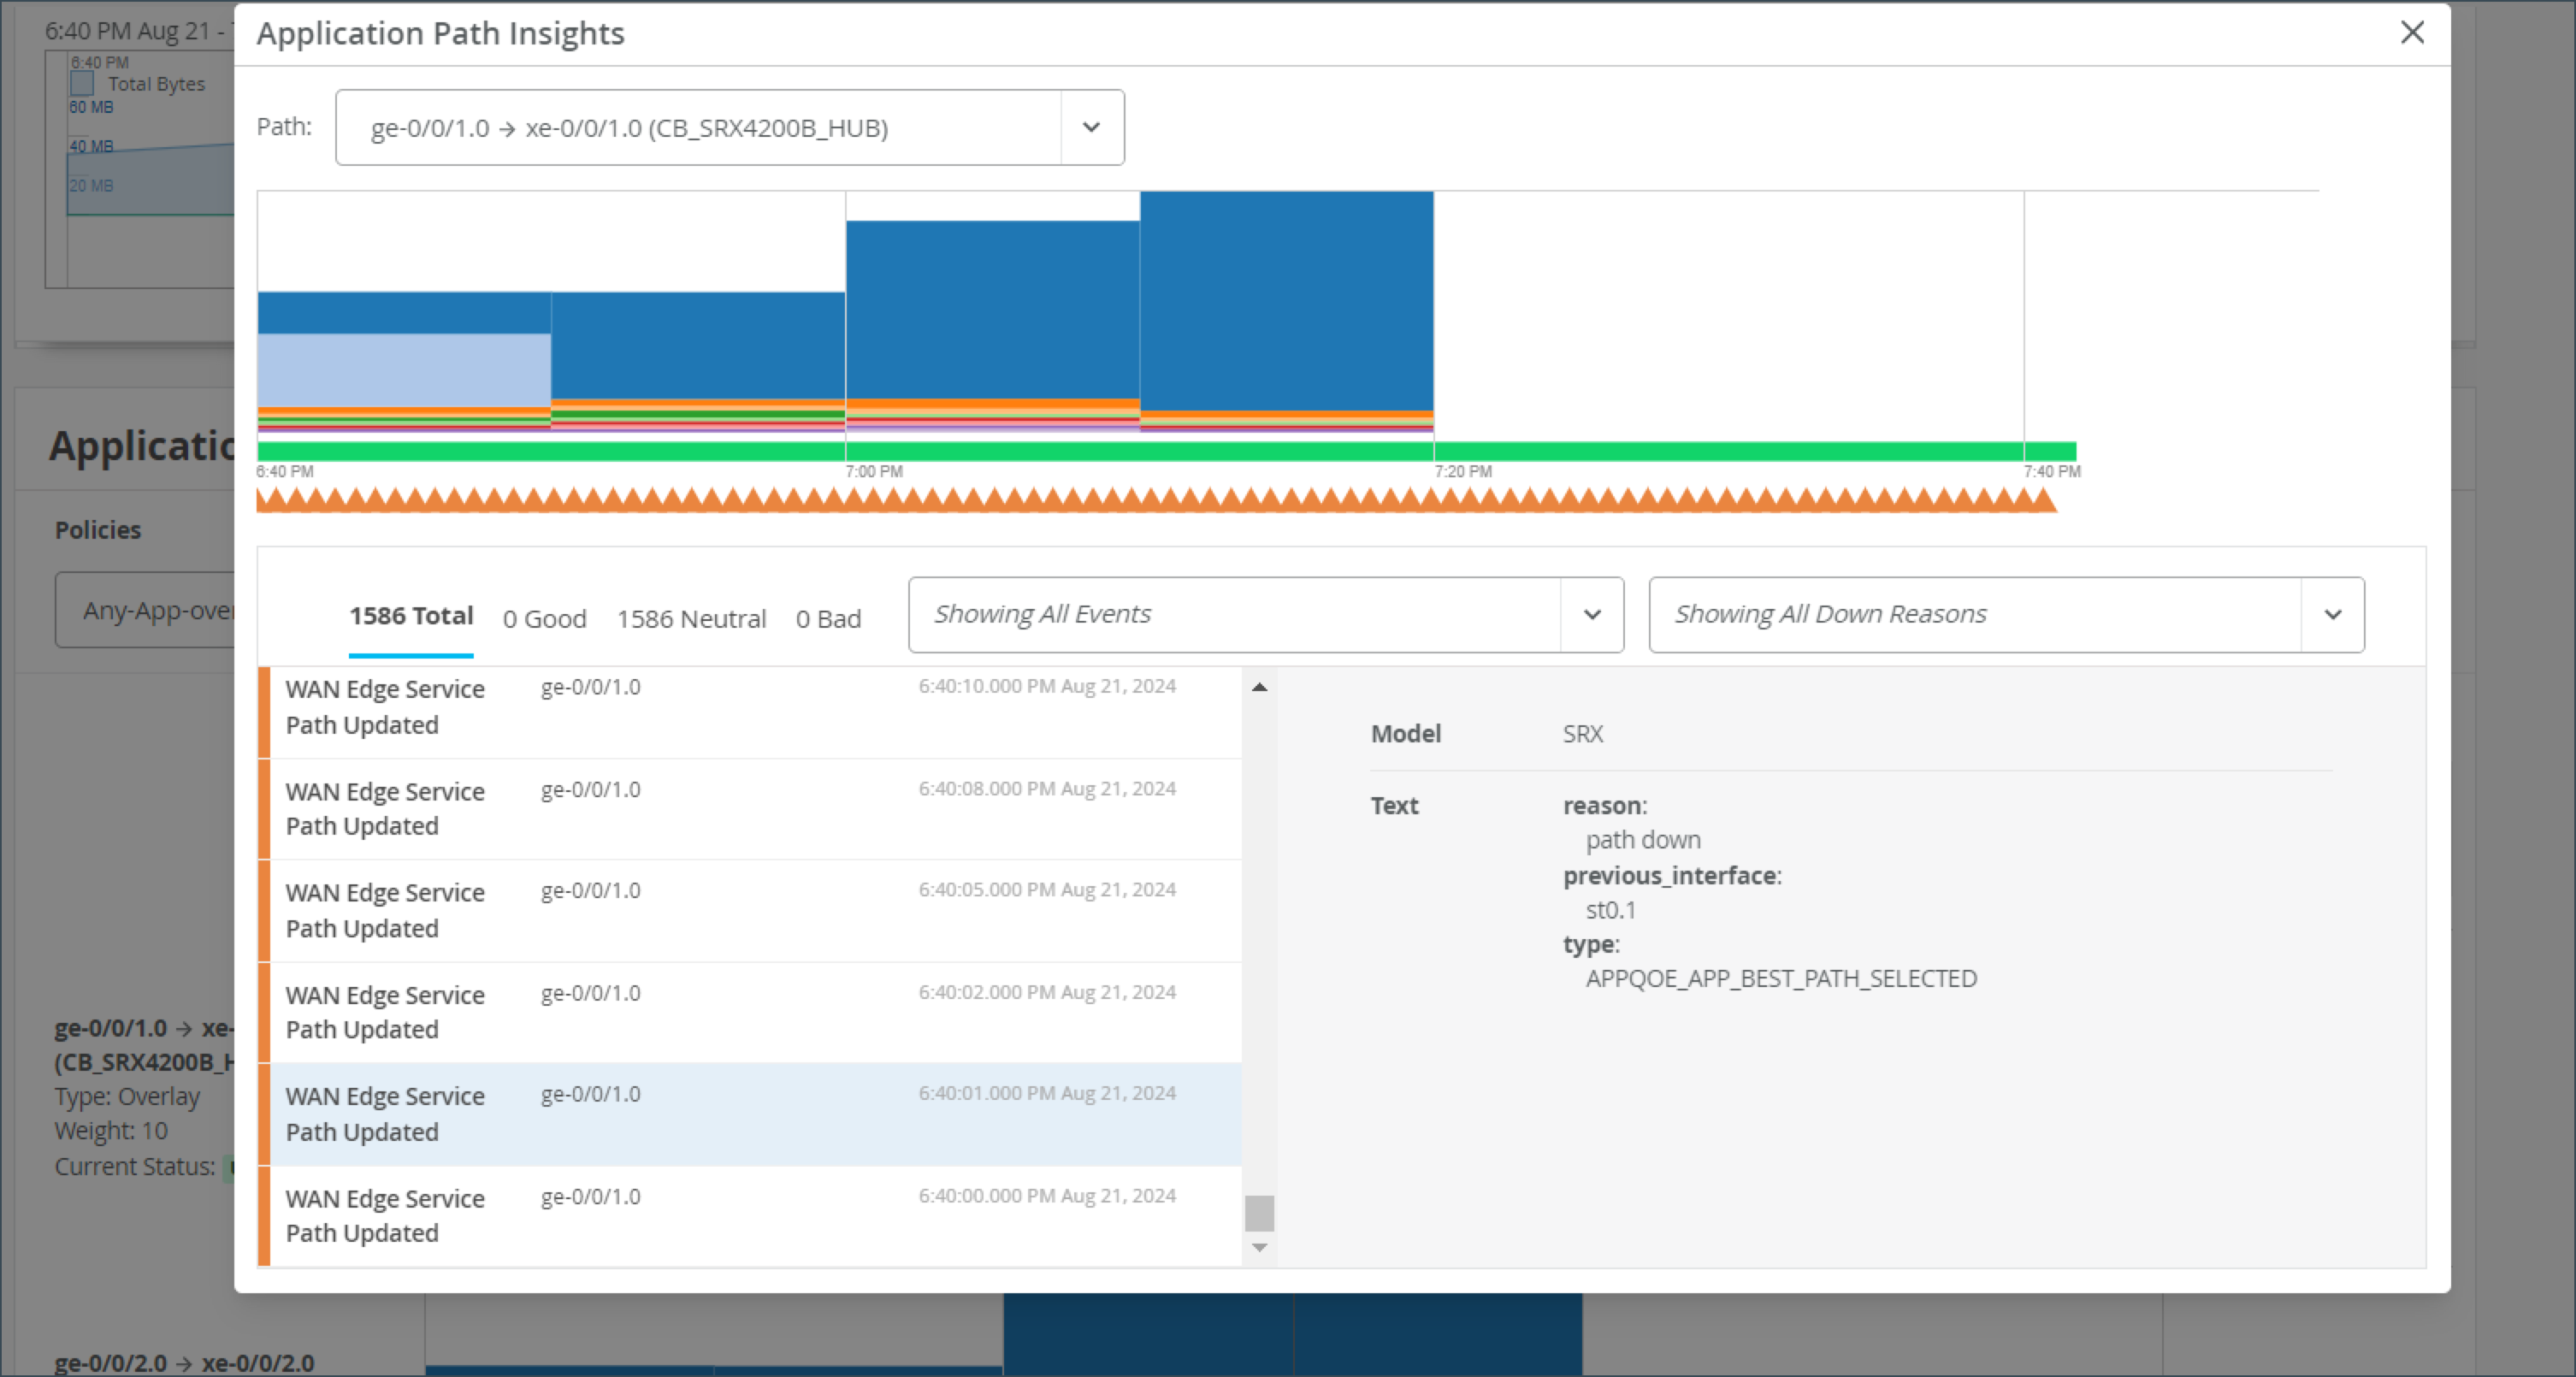
The Application Path Insights (BETA) section shows you which applications are using the most bandwidth according to the selected Application Policy and Network. It displays the effective application flow over the path for the selected Application Policy. You can also change the Data Type to Sessions to see the number of sessions occurring per application. Hover over a section of the graph to view the bandwidth or sessions per application as well as jitter, loss, and latency.
The Application Path Insights visualization data is available only if the configuration is managed by Juniper Mist.
Have you ever been on an important Zoom or Teams call and experienced jitter or latency? This is a bad experience for anyone, but if you're the network operator, it's even worse. You don't want the CEO yelling at you because their shareholder meeting went bad. With Juniper's WAN Assurance Application Insights dashboard, you could do something about it.
This dashboard shows you which applications are using bandwidth at any given time. Given those insights, you can easily set policies to remediate issues, such as prioritizing some applications, blocking others, or working with your ISP to gain more bandwidth. Application Insights dashboard also lets you verify that your policies were configured correctly, and you can easily see the top 10 applications by bandwidth utilized, quickly adding and removing applications from this list.
And that's the power of WAN Assurance App Insights in 60 seconds.
The path state bar shows path state information over a timeline, and path state events are indicated by segments highlighted in different colors. For example, Path Up events are shown in green and Path Down events are shown in red.
You can hover over the highlighted portions of the path state bar to view a summary of path state events.
The Application Path Insights section also includes a summary view on the lefthand side that displays recent path state events.
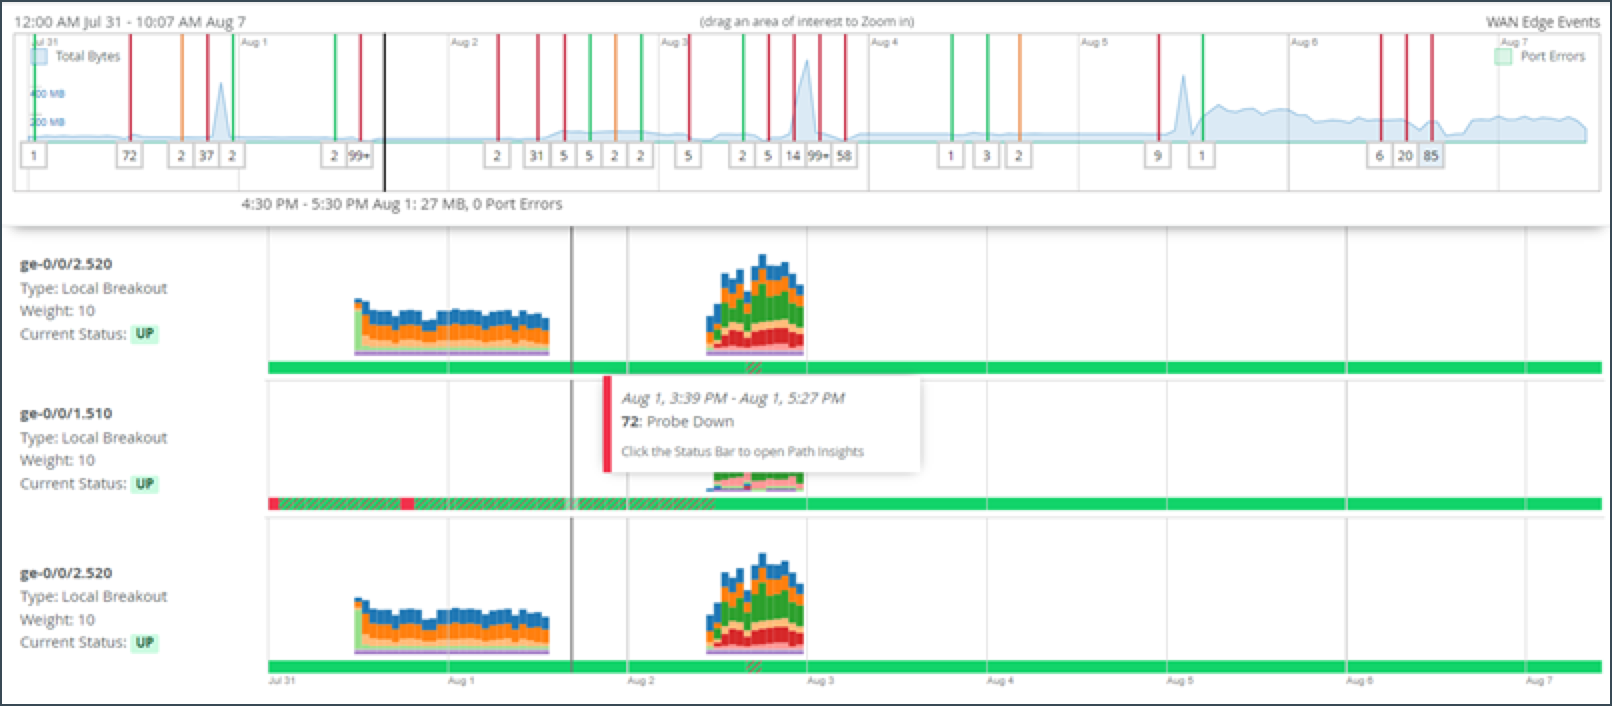
If you click on the bar, you will get a pop-up window where you can view more detailed information about the path state events. The list of events displays on the left and when you select an event, the reason for the event displays on the right.
Path state events include:
- Path Update
- Port Up
- Port Down
- Path Up
- Path Down
Path state reasons include:
- Probe Down
- Peer Path Up
- Peer Path Down
- Config Change
- Best Path Selected
- SLA Metric Violation
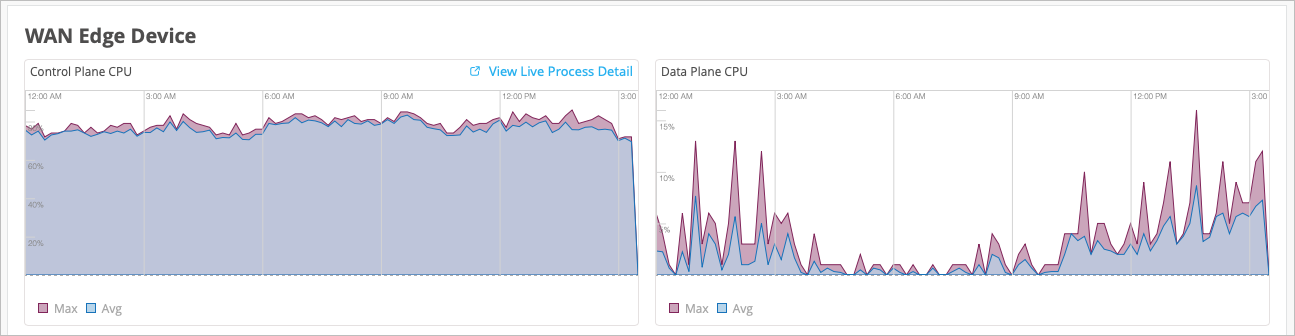
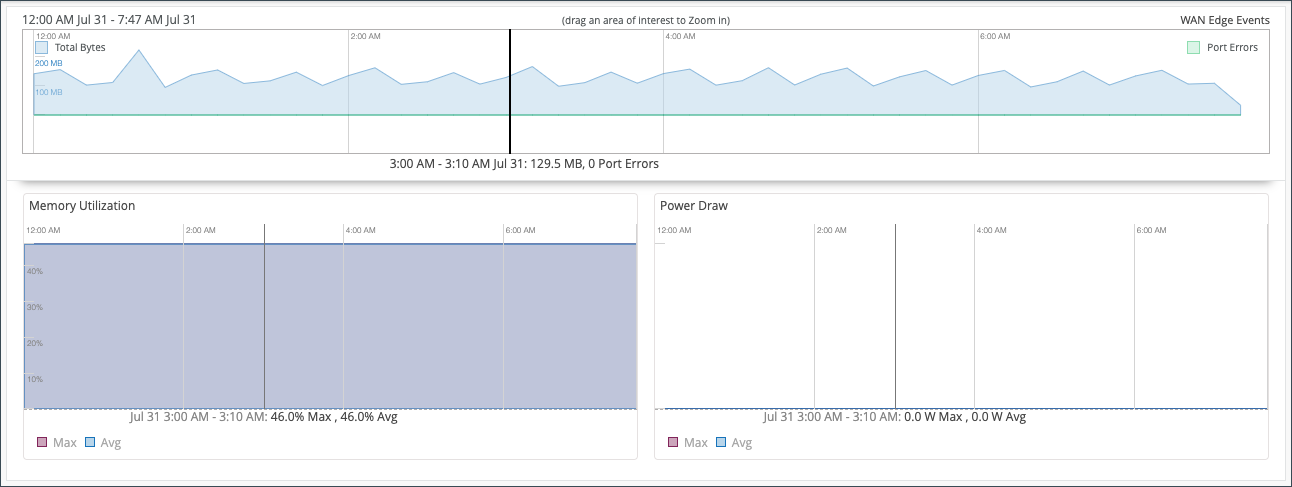
The WAN Edge Device Charts include Control Plane CPU, Data Plane CPU, Memory Utilization, and Power Draw.
The Control Plane CPU and Data Plane CPU charts show you the percentage of CPU utilization for both max and average. On the Control Plane CPU, you can click the View Live Process Detail link to see more in depth information about the processes that are running on the control plane.
The Memory Utilization and Power Draw charts shows you the percentage for both max and average.
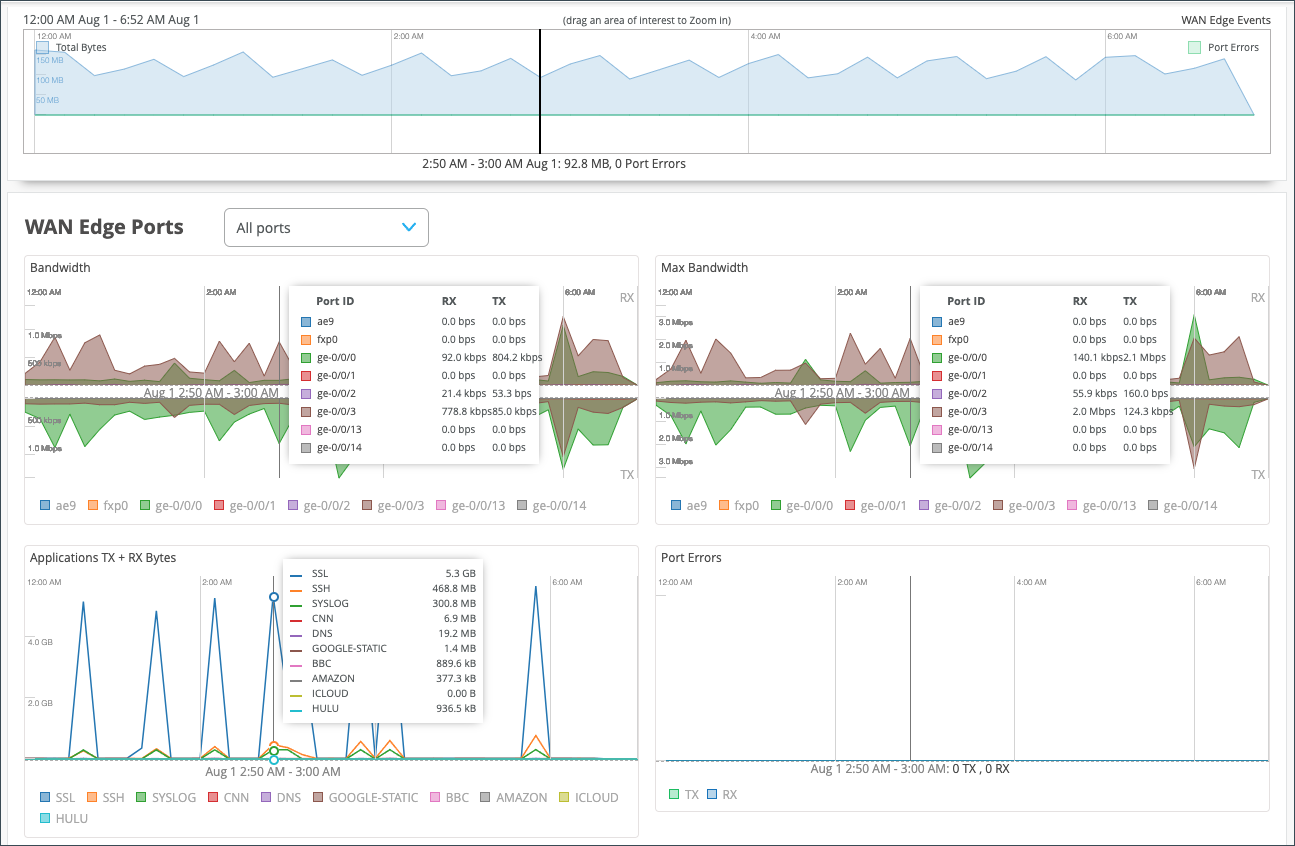
- In the Bandwidth chart, the bandwidth utilization metrics in megabits per second (Mbps) for that particular interface displays.
- The Max Bandwidth chart displays insights into the highest point of link utilization recorded for received power signal (RX) and transmitted power signal (TX) packets on each port during the day. The data is shown in Mbps.
The last three WAN Edge Ports charts are Applications TX + RX Bytes, Port Errors, and IPsec Traffic. Hover over the charts to find out more information.
- The Applications TX + RX Bytes chart outlines transmit and receive data information, which can be isolated at an application level by clicking on the application name at the bottom of the chart to see Client, MAC address, IP address, device type, bytes, and % bytes for bandwidth utilization.
-
The Port Errors graph displays port errors detected on the WAN Edge device over a period of time. Port errors are ethernet data link error counts that include all possible ethernet errors reported by the port device driver. Exact types of errors vary by device driver, and the total may include but is not limited to CRC errors, collisions, and so on. Errors are counted in both the transmit (TX) and receive (RX) direction. The graph displays the total for all ports, or for a particular port based on the WAN Edge Ports selection.
- The IPsec Traffic chart displays IPsec traffic for transmit and receive packets during the day in kilobytes or megabytes.
Peer Path Statistics
This applies only to Session Smart Routers deployed as WAN edge devices in Juniper Mist™ WAN Assurance. Therefore, no data will be populated in this section for SRX Series Firewalls deployed as a WAN edge device.
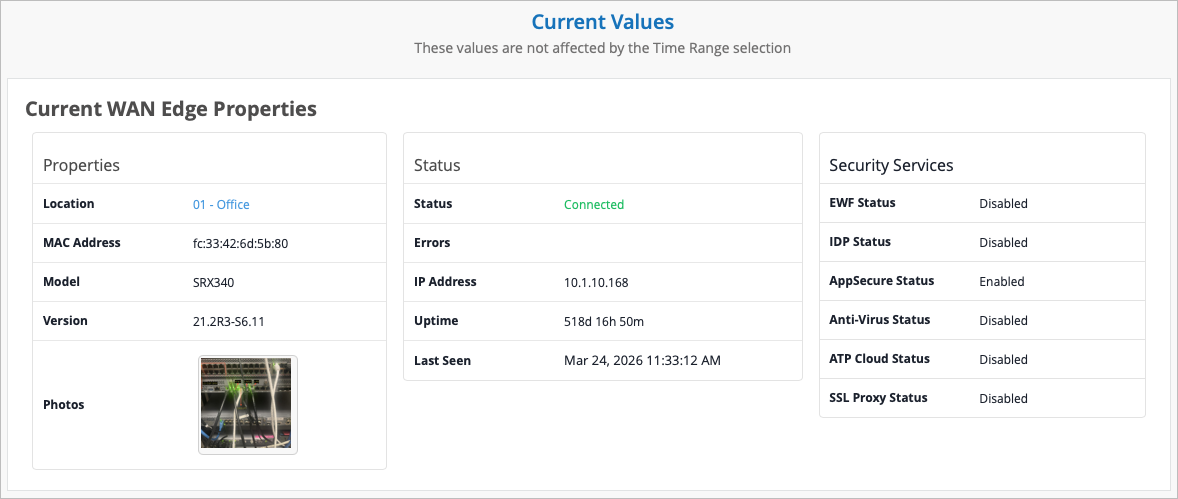
The final section of your WAN Edge Insights page is Current WAN Edge Properties. Time range selections do not impact information in the Current Values pane.
View Alerts for Interfaces Status
In Juniper Mist, alerts present network and device issues that are ongoing. You can view alerts on the Juniper Mist portal by navigating to the left menu of the portal, then selecting Monitor > Alerts.
You can set up alerts and email updates for when certain ports on a WAN Edge device go online or offline. To configure alerts for specific ports, you need to label these ports in the LAN or WAN settings of a WAN Edge device.
To configure the alerts and notifications for specific ports, you must:
- Change the WAN or LAN settings to label the specified ports in the WAN Edge
template or at device-level configuration page.
- In the Juniper Mist portal, select Organization > WAN >
WAN Edge Templates and select the WAN or LAN
configuration that you want to update (or add a new configuration).
To configure this at the device-level, select WAN Edges > WAN Edges from the left menu, then select the WAN or LAN configuration of the selected device.
- In the Interface field, enter the port or ports,
and then select the Enable “Up/Down Port” Alert
Type checkbox. Figure 40: Marking LAN Port or WAN Interface as Critical Interface
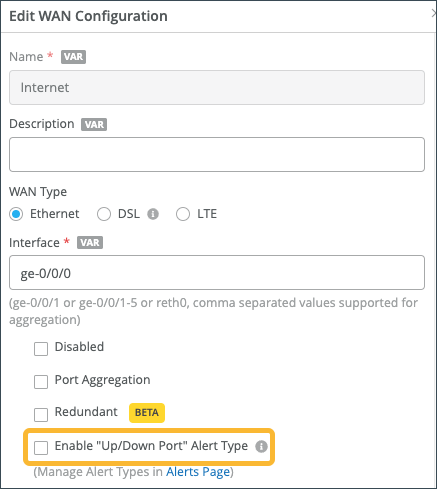
Repeat these steps for all critical ports. Click Save when you are done with each port.
- In the Juniper Mist portal, select Organization > WAN >
WAN Edge Templates and select the WAN or LAN
configuration that you want to update (or add a new configuration).
- Configure alerts and e-mail notifications for the specified ports on the Alerts
page.
- Go to Monitor > Alerts > Alerts
Configuration and use the following check-boxes to
enable alerts for the selected port:
Critical WAN Edge Port Up
Critical WAN Edge Port Down
Figure 41: Alerts Configuration for Critical Ports
See Alert Configuration for details.
When you enable alerts and notifications:
- You receive an e-mail notification whenever a port transitions from one state to another.
- You can delay alerts about when the WAN Edge gateway goes offline to prevent repeated alerts in the case of connectivity flaps by clicking the pencil icon and setting a time threshold.
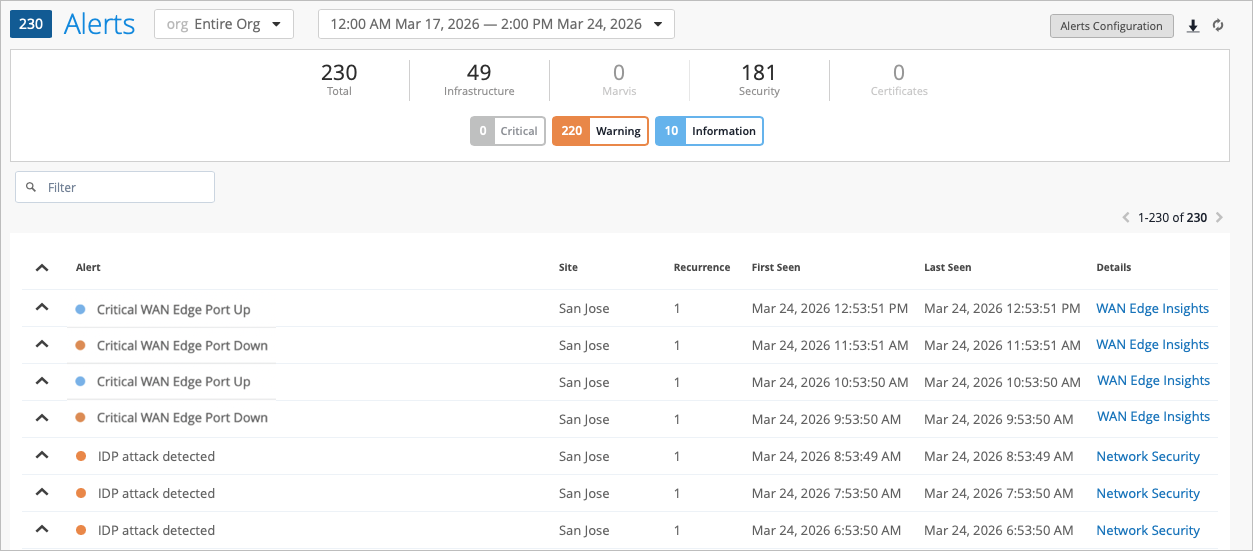
- You can view the status in the Monitor
> Alerts page. Figure 42
shows an example of the critical port status on the Juniper Mist
Alerts dashboard.Figure 42: Critical WAN Edge Port Status
- Go to Monitor > Alerts > Alerts
Configuration and use the following check-boxes to
enable alerts for the selected port: