Use Root Cause Analysis to Troubleshoot Application Health
Application Health is an important SLE to use when troubleshooting issues at the WAN Edge. Use the Root Cause Analysis page to gain insights into lower than expected service levels.
Before you can view the Application Health SLE, there are some important points to remember. You must define application probes on SRX Series devices, but not on Session Smart Routers (SSRs). However, for both platforms, you will need traffic that can be sampled and reported to the Juniper Mist cloud.
Mist AI begins collecting and analyzing data immediately, but you'll see more meaningful data after at least one week.
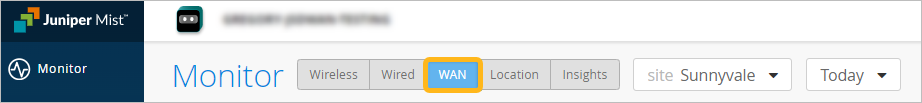
To navigate to the WAN SLEs dashboard, from the left menu of the Juniper Mist portal, select Monitor > Service Levels, and then click the WAN button.
Click Application Health on the WAN SLE dashboard to have the Root Cause analysis information display.
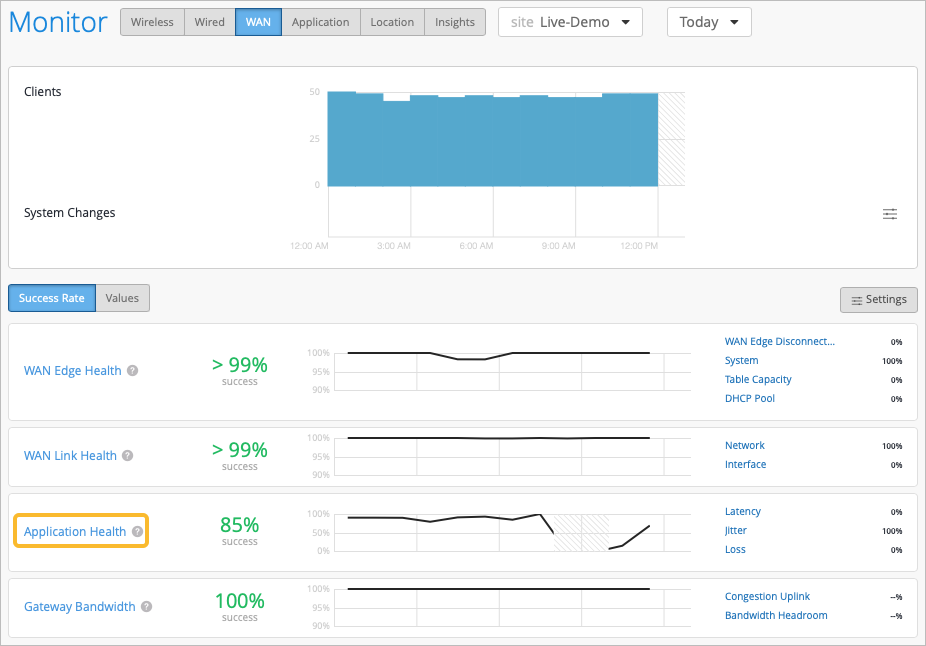
By default, the Statistics tab displays the generalized Success Rate. In this example, it's only 85%. The Statistics tab is only visible when you are viewing the SLE, such as the Application Health SLE. It does not display once you select a classifier.
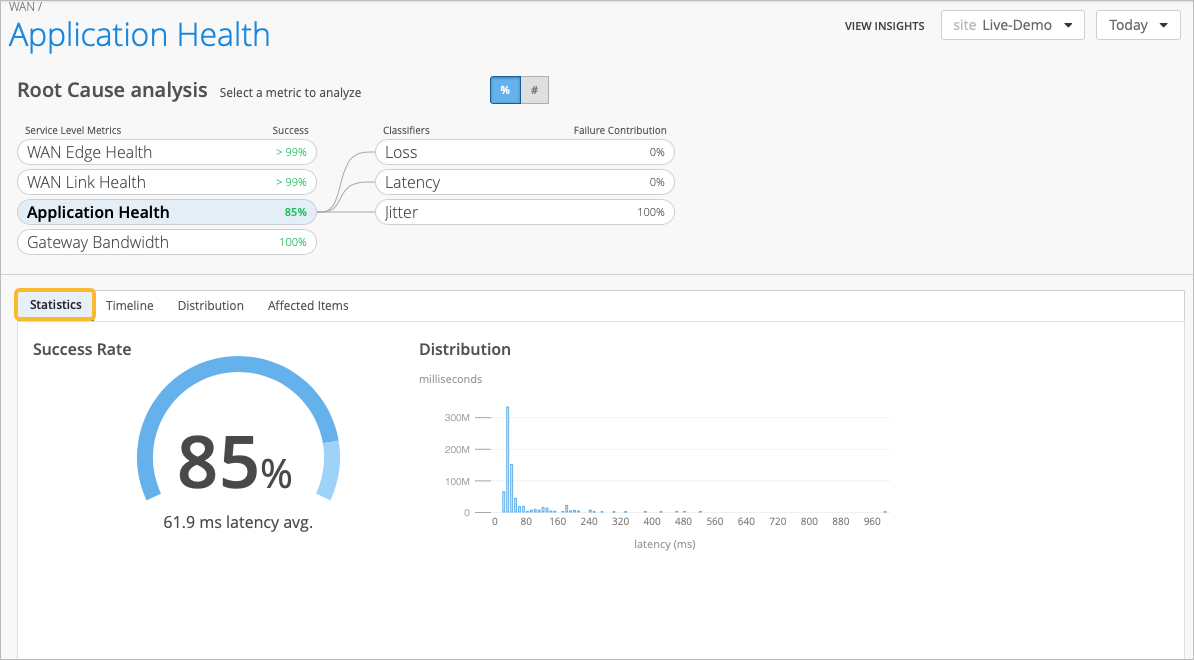
What's going on to generate such a low success rate? Explore the various classifiers (latency, jitter, loss, and in some cases, application services) that contribute to the overall percentage. From the Classifiers list on the top right half of the Root Cause analysis page, select a classifier to display data in the lower half of the page. The Timeline tab displays by default.
Use these tabs to drill down:
-
Timeline—Shows a timeline of the events comprising the classifiers, listing their failures, connected clients, and system changes. Use this information to pinpoint the events that need further investigation.
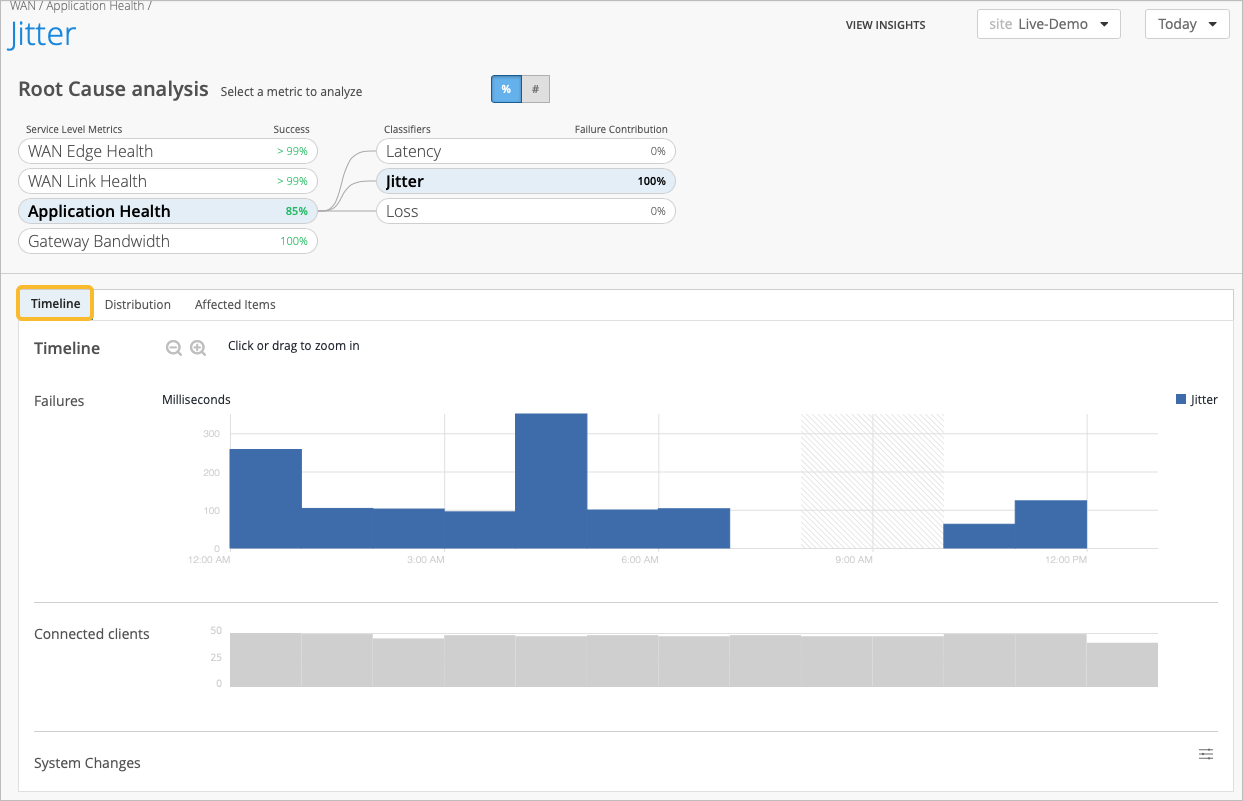
The time frame is influenced by the value at the top of the page, with options for Today, Yesterday, This Week, or a Custom Range. On the timeline, you can select a specific time, zoom in for details, or select a range. Hover over any point in time to see a pop-up message with more information about the classifier that failed to meet service expectations.
-
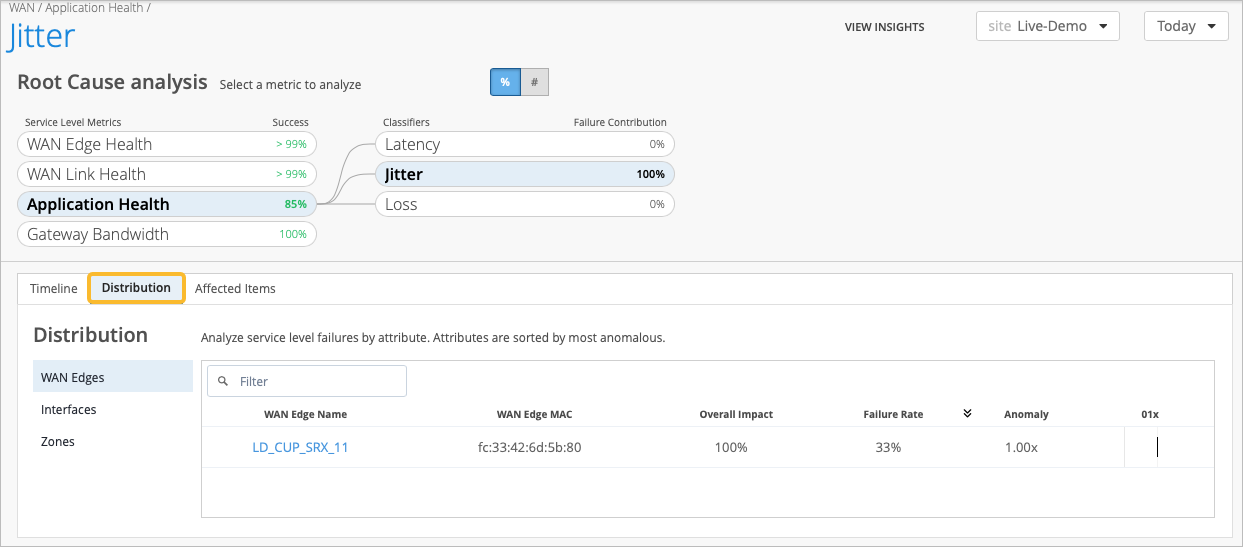
Distribution—Analyzes service-level failures by attribute and is sorted by the most disruptive attribute. You can drill down into categories of traffic classes, peer paths (connections between Session Smart Router peers), physical interfaces, WAN Edges, and zones. Note that WAN Assurance deployments with Session Smart WAN Edge devices leverage the peer path information, while the SRX Series devices leverage destination zones for deeper insights in the Distribution tab.
-
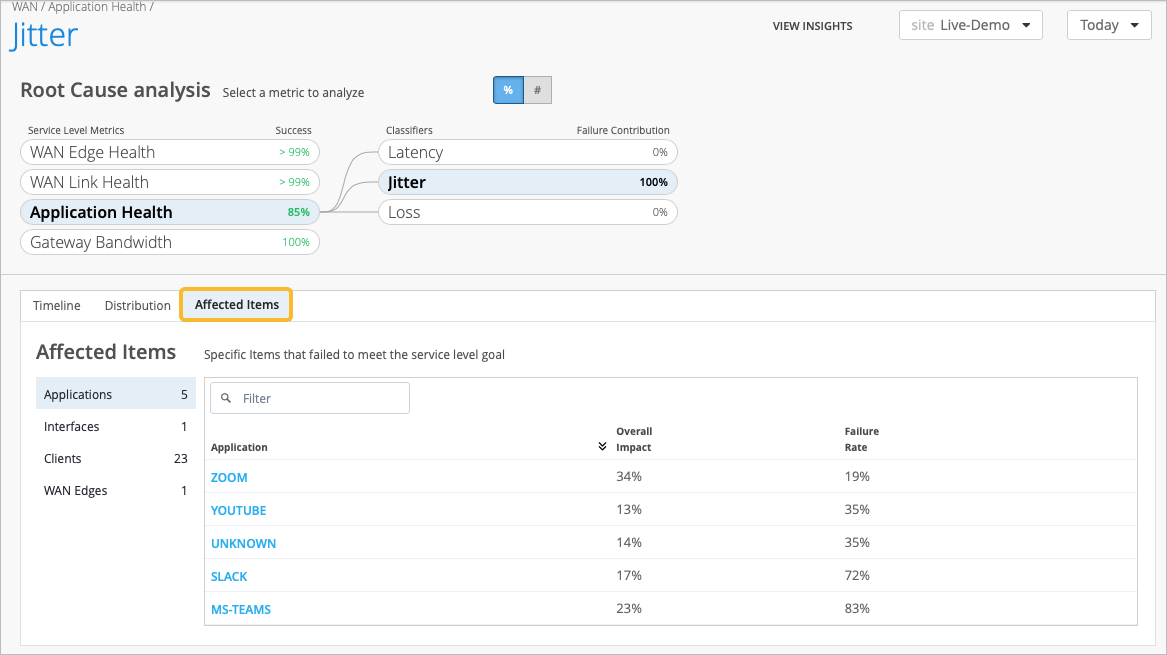
Affected Items—Categorizes the specific items that failed to meet service-level goals. Here, you’ll find the percentage of overall impact and percentage of failure rate per application.