Marvis Minis Dashboard Overview
Get familiar with the major features of the Marvis Minis Dashboard and the details that you can view in the validation results. See how to use filters and other options to find exactly the information that you need.
The Marvis Minis dashboard provides visibility into the validation results. To view the Marvis Minis dashboard, select Marvis > Marvis Minis from the left menu.
In this example, you’ll see the major elements of the dashboard:
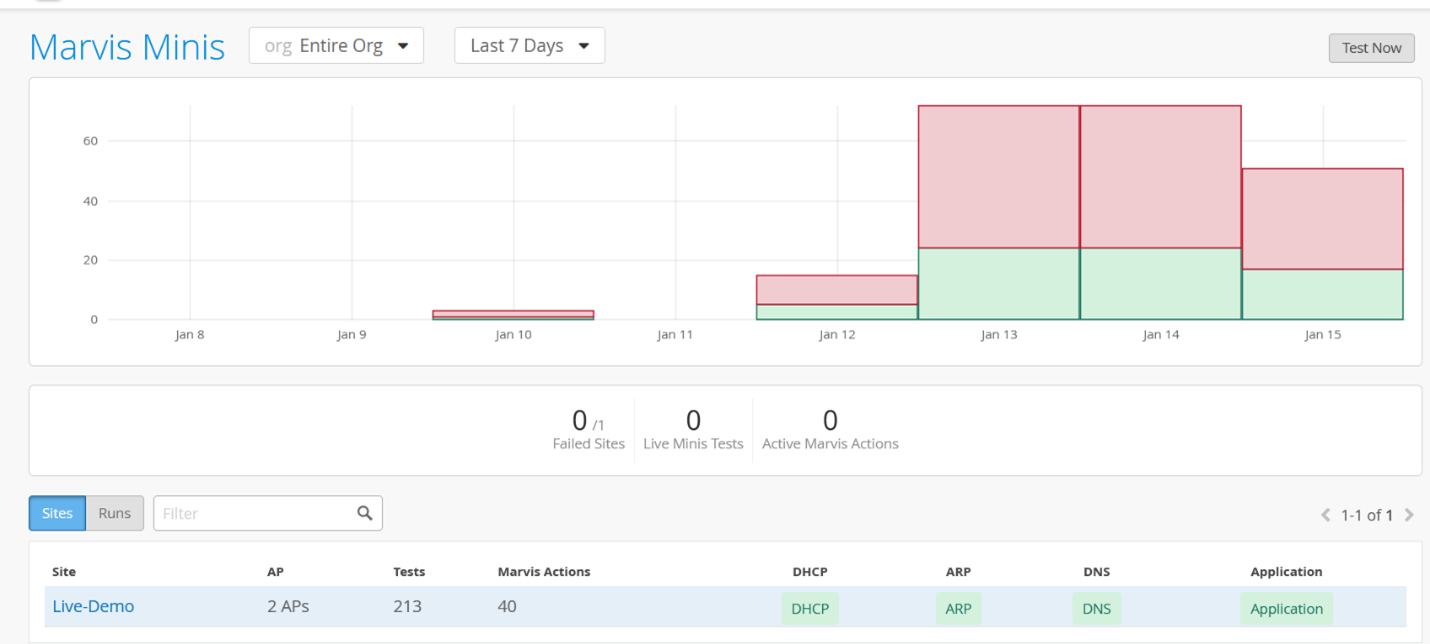
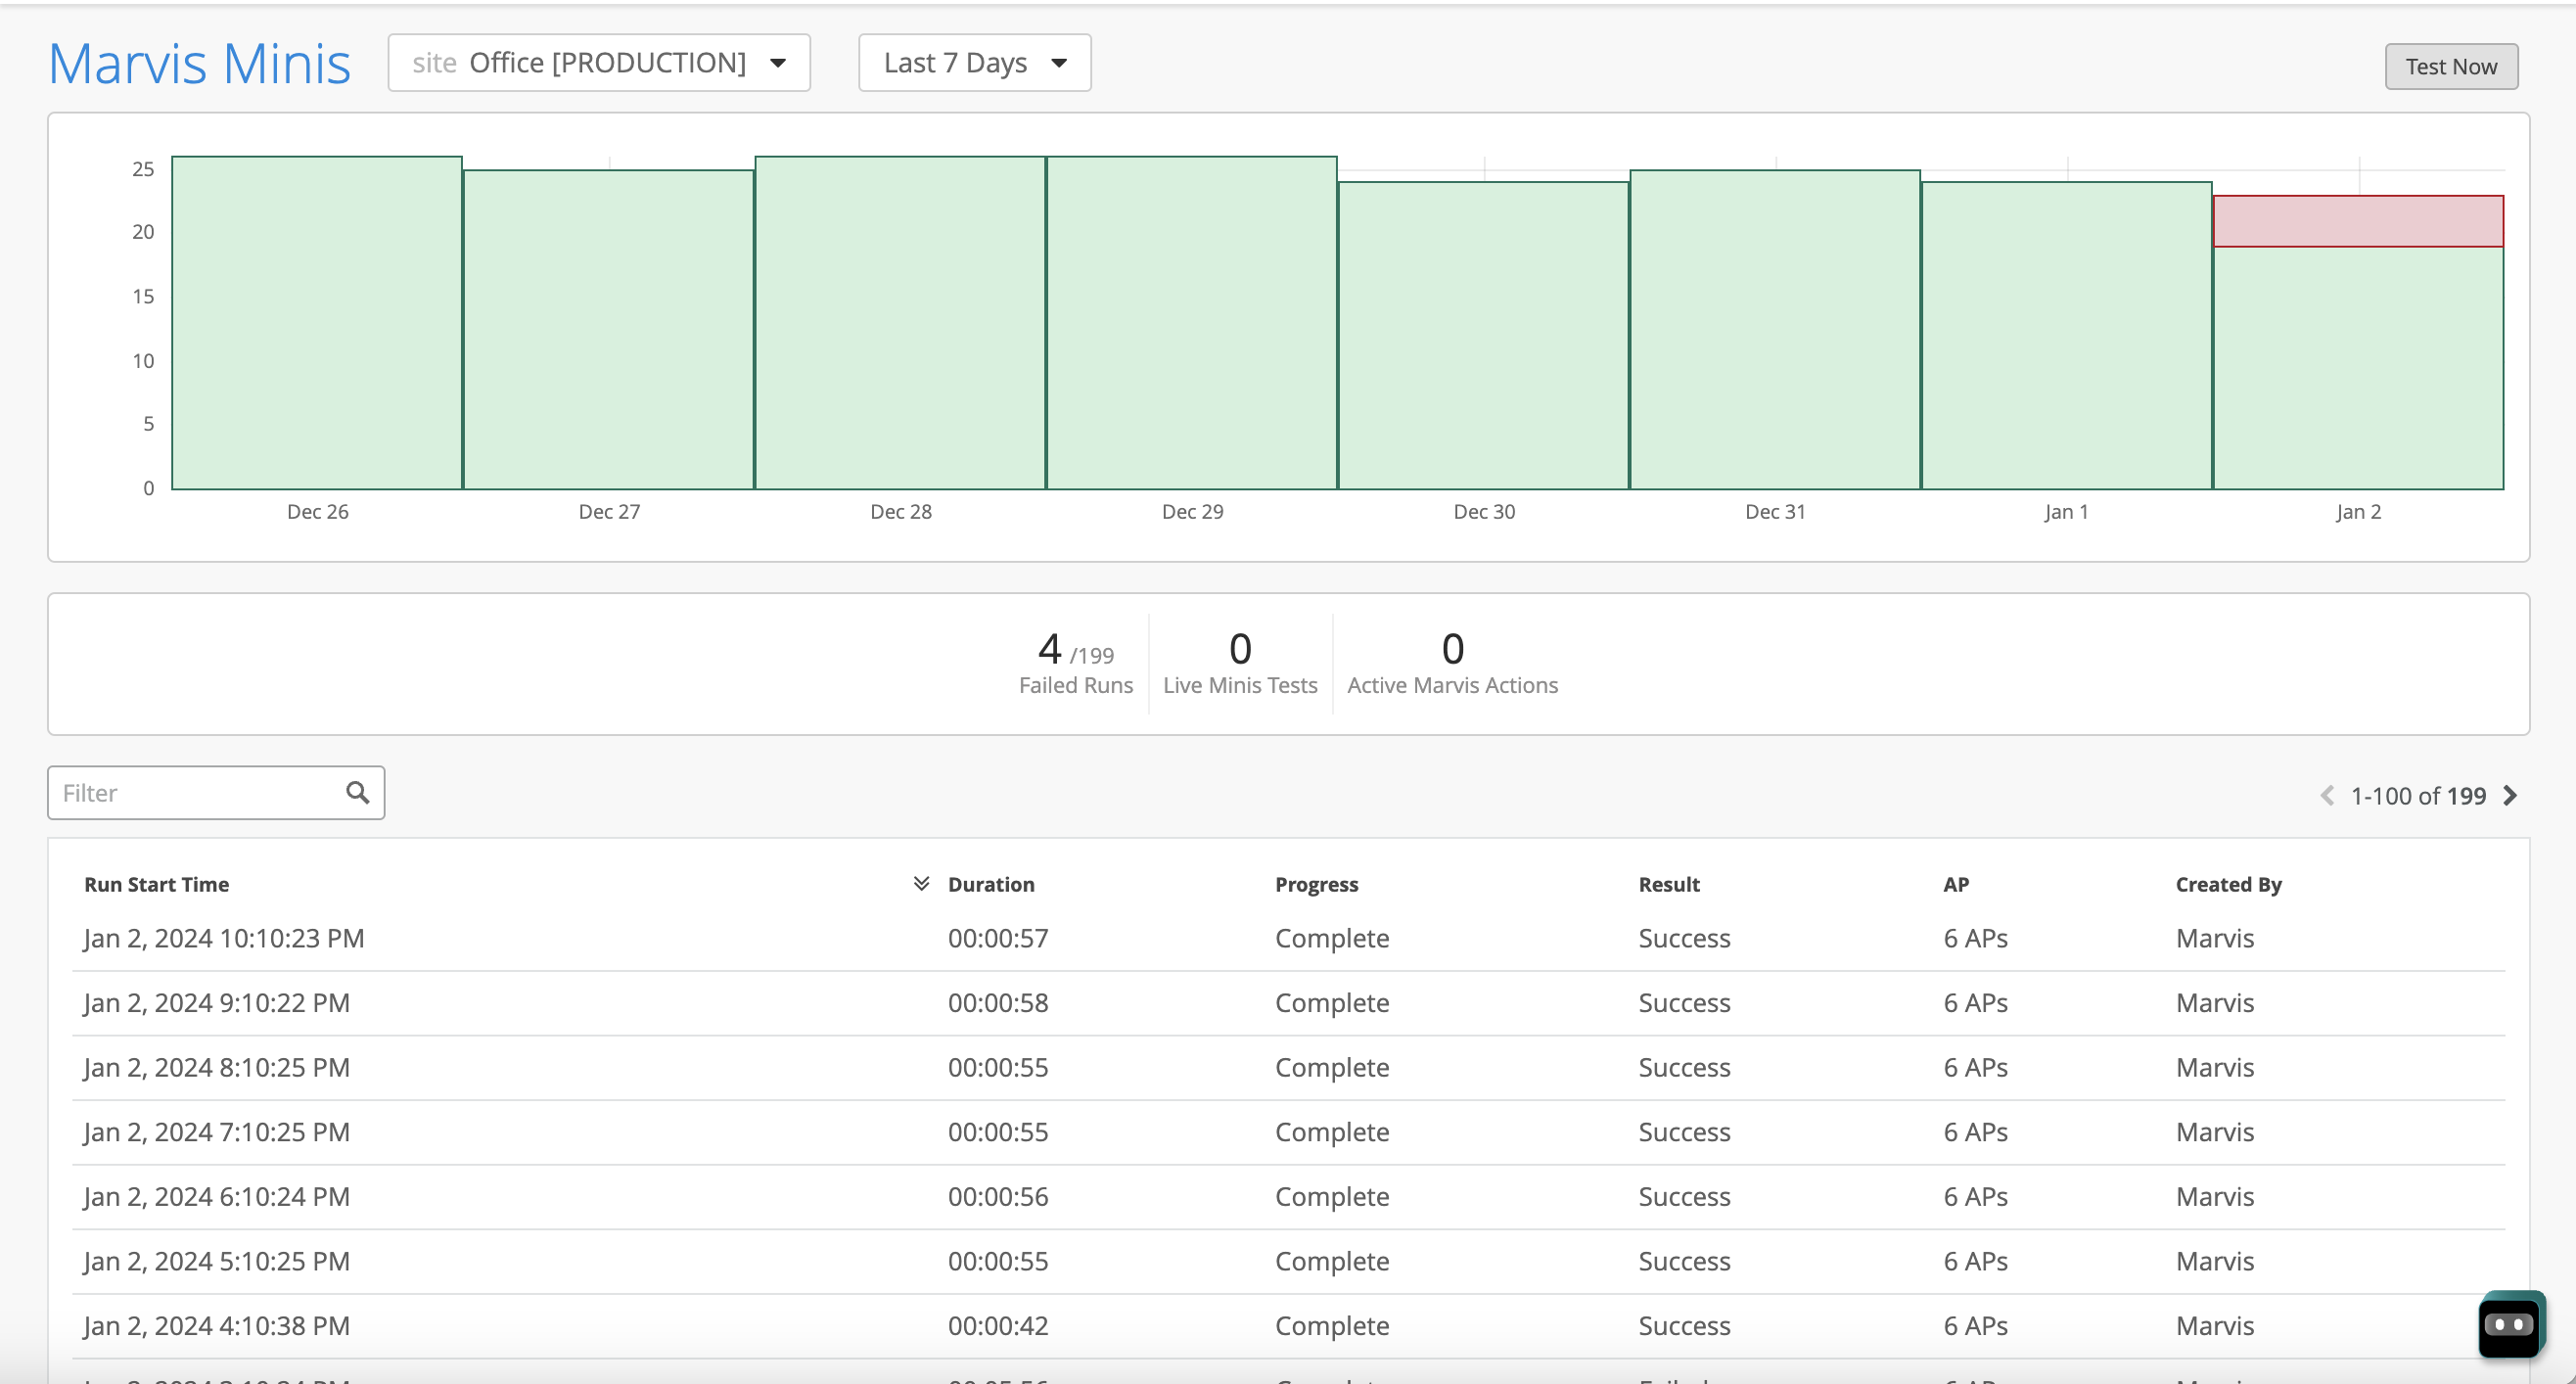
At the top of the page, you’ll see a graphical representation of the total validations executed, with the green block indicating the number of successful validations. You can click each block to view the details of each validation.
Directly below the graph, you’ll see the following statistics for the organization:
-
Failed sites—Number of sites that failed the validation.
-
Live Minis Tests—Number of validations that are being run currently. Marvis runs only one validation per site at a time. You cannot trigger a manual validation when an automated validation is in progress.
-
Active Marvis Actions—Number of actions detected by Marvis Minis at the organization level.
The table at the bottom of the page displays the results that are based on the context you select—an entire organization or a single site.
Organization-Level Marvis Minis Dashboard
Here is an example of the Marvis Minis dashboard view for an organization:
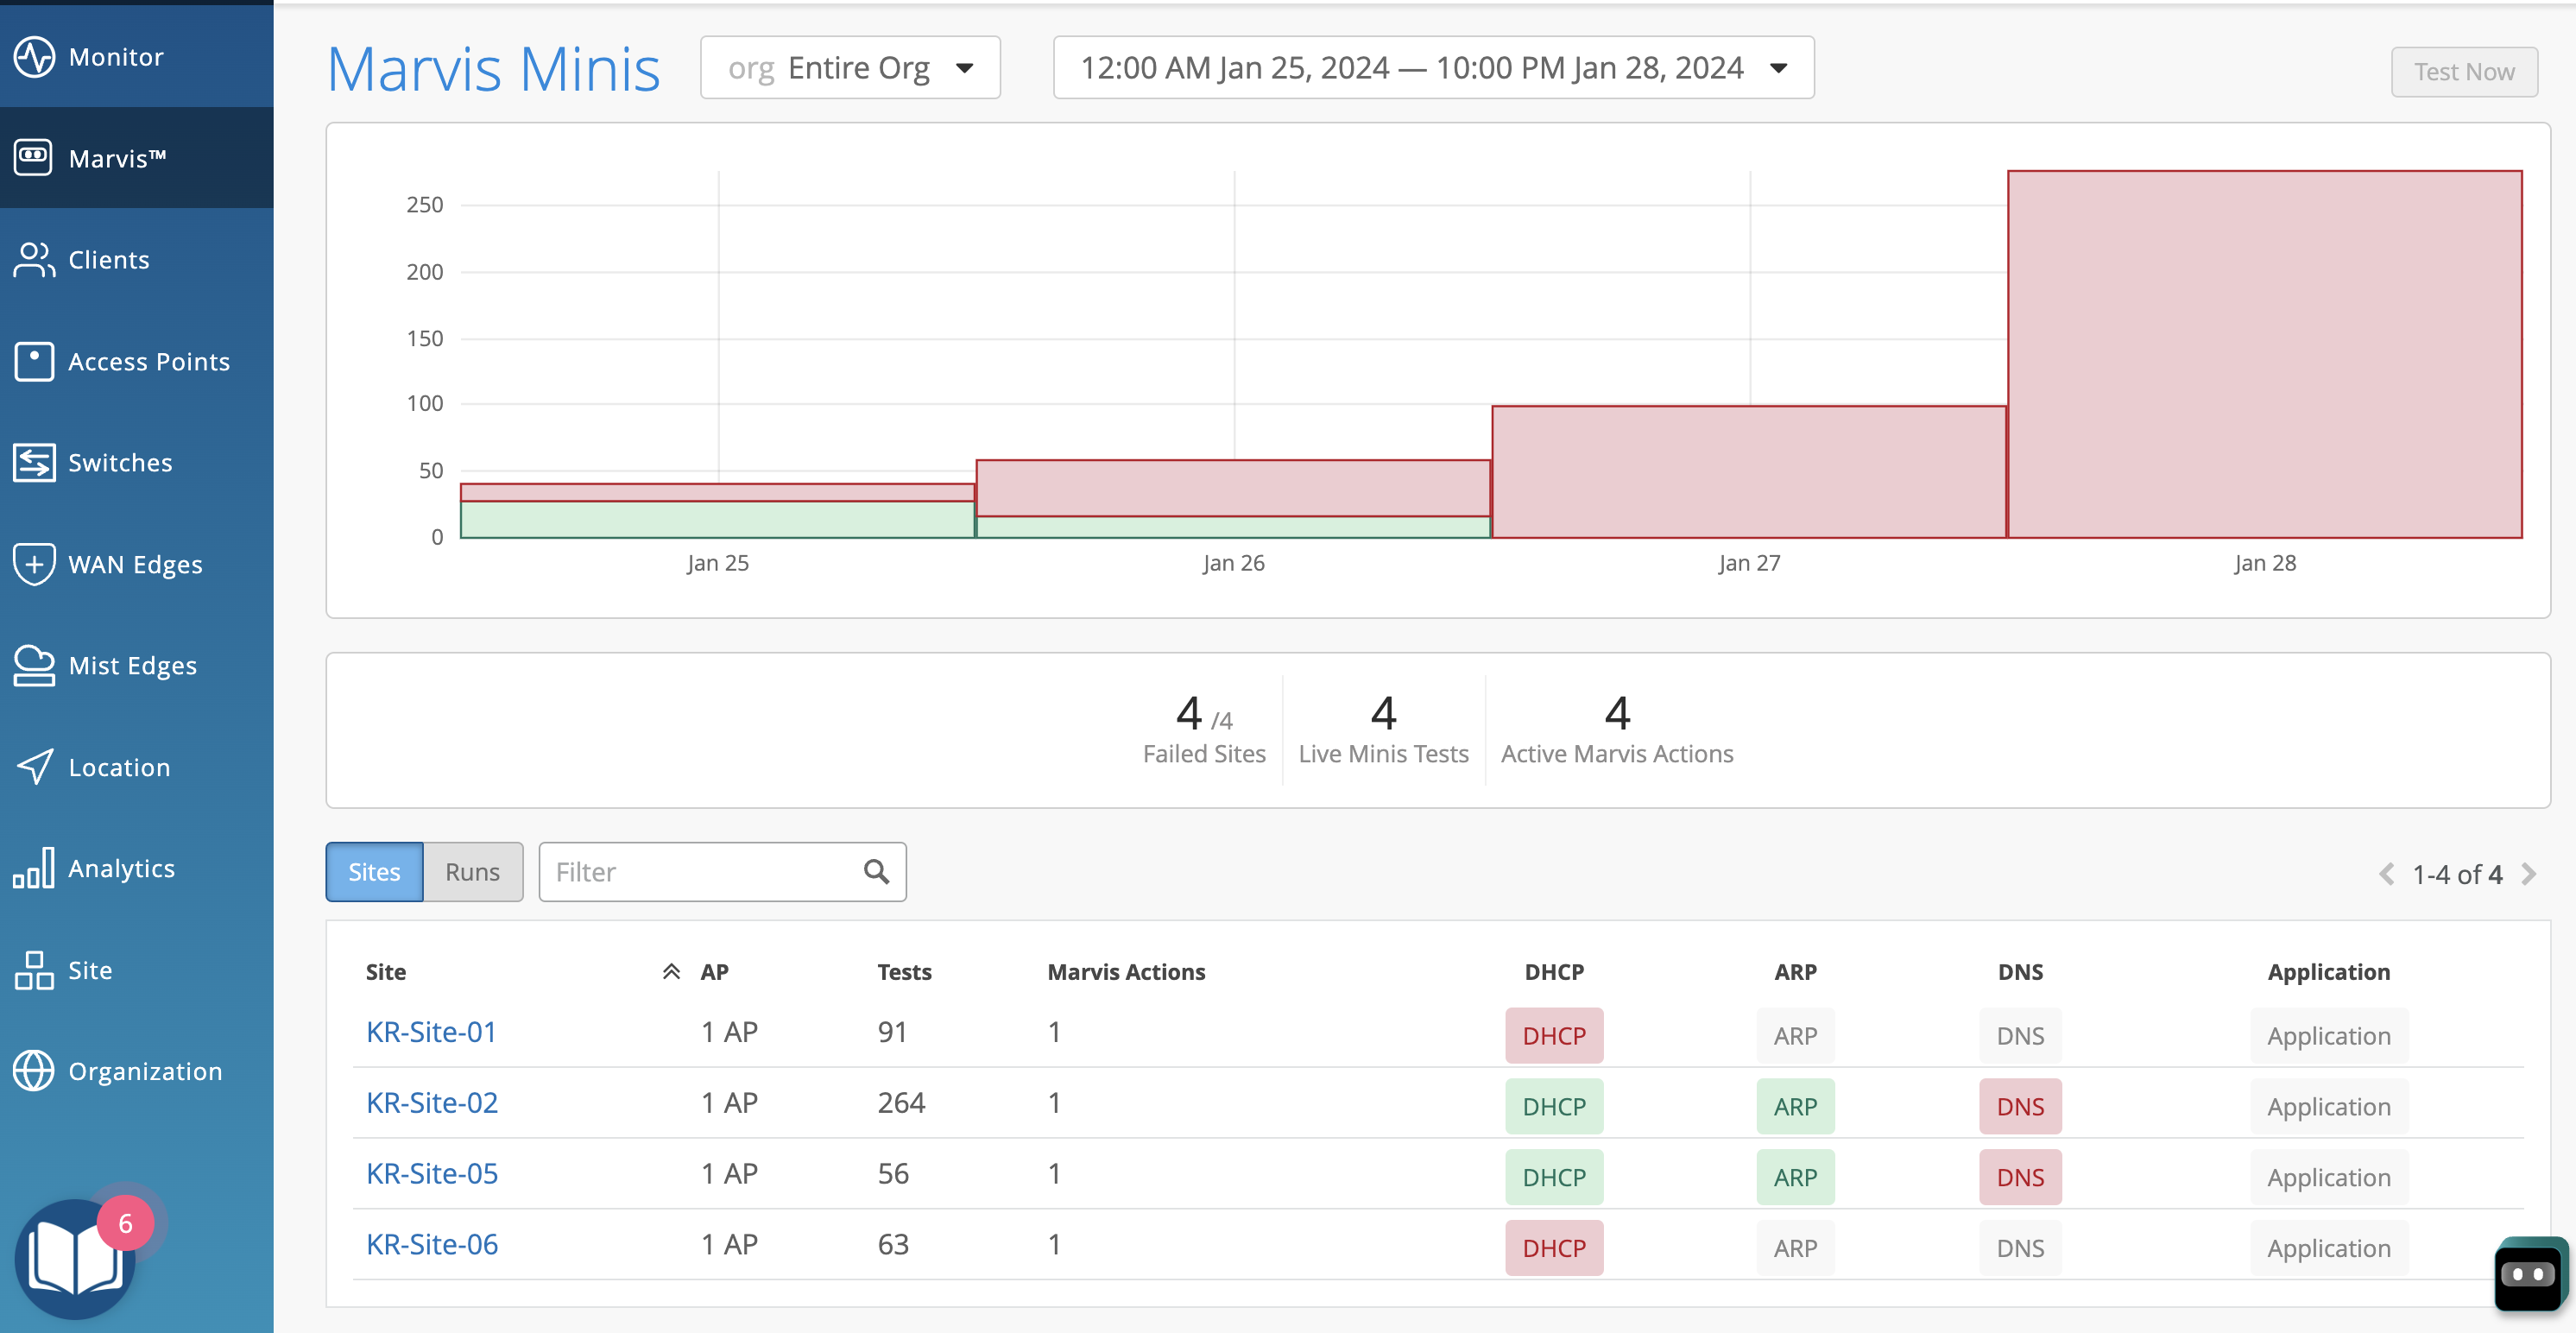
The Sites tab displays all the sites in the organization. The table includes:
-
Site—The name of the site where the validation was run.
-
AP—APs on which Marvis Minis validation is triggered.
-
Tests—The number of times the validation was run on the site for the selected timeline (automated and triggered).
-
Marvis Actions—Lists the number of Marvis Actions detected by Marvis Minis for the site.
-
Network and application services—Marvis Minis provides the validation results for a site for the following network and application services:
-
DHCP
-
ARP
-
DNS
-
Application connectivity
-
You can view the details of each validation run on a site by clicking the site name. In this example, you can see the validations run on a site.
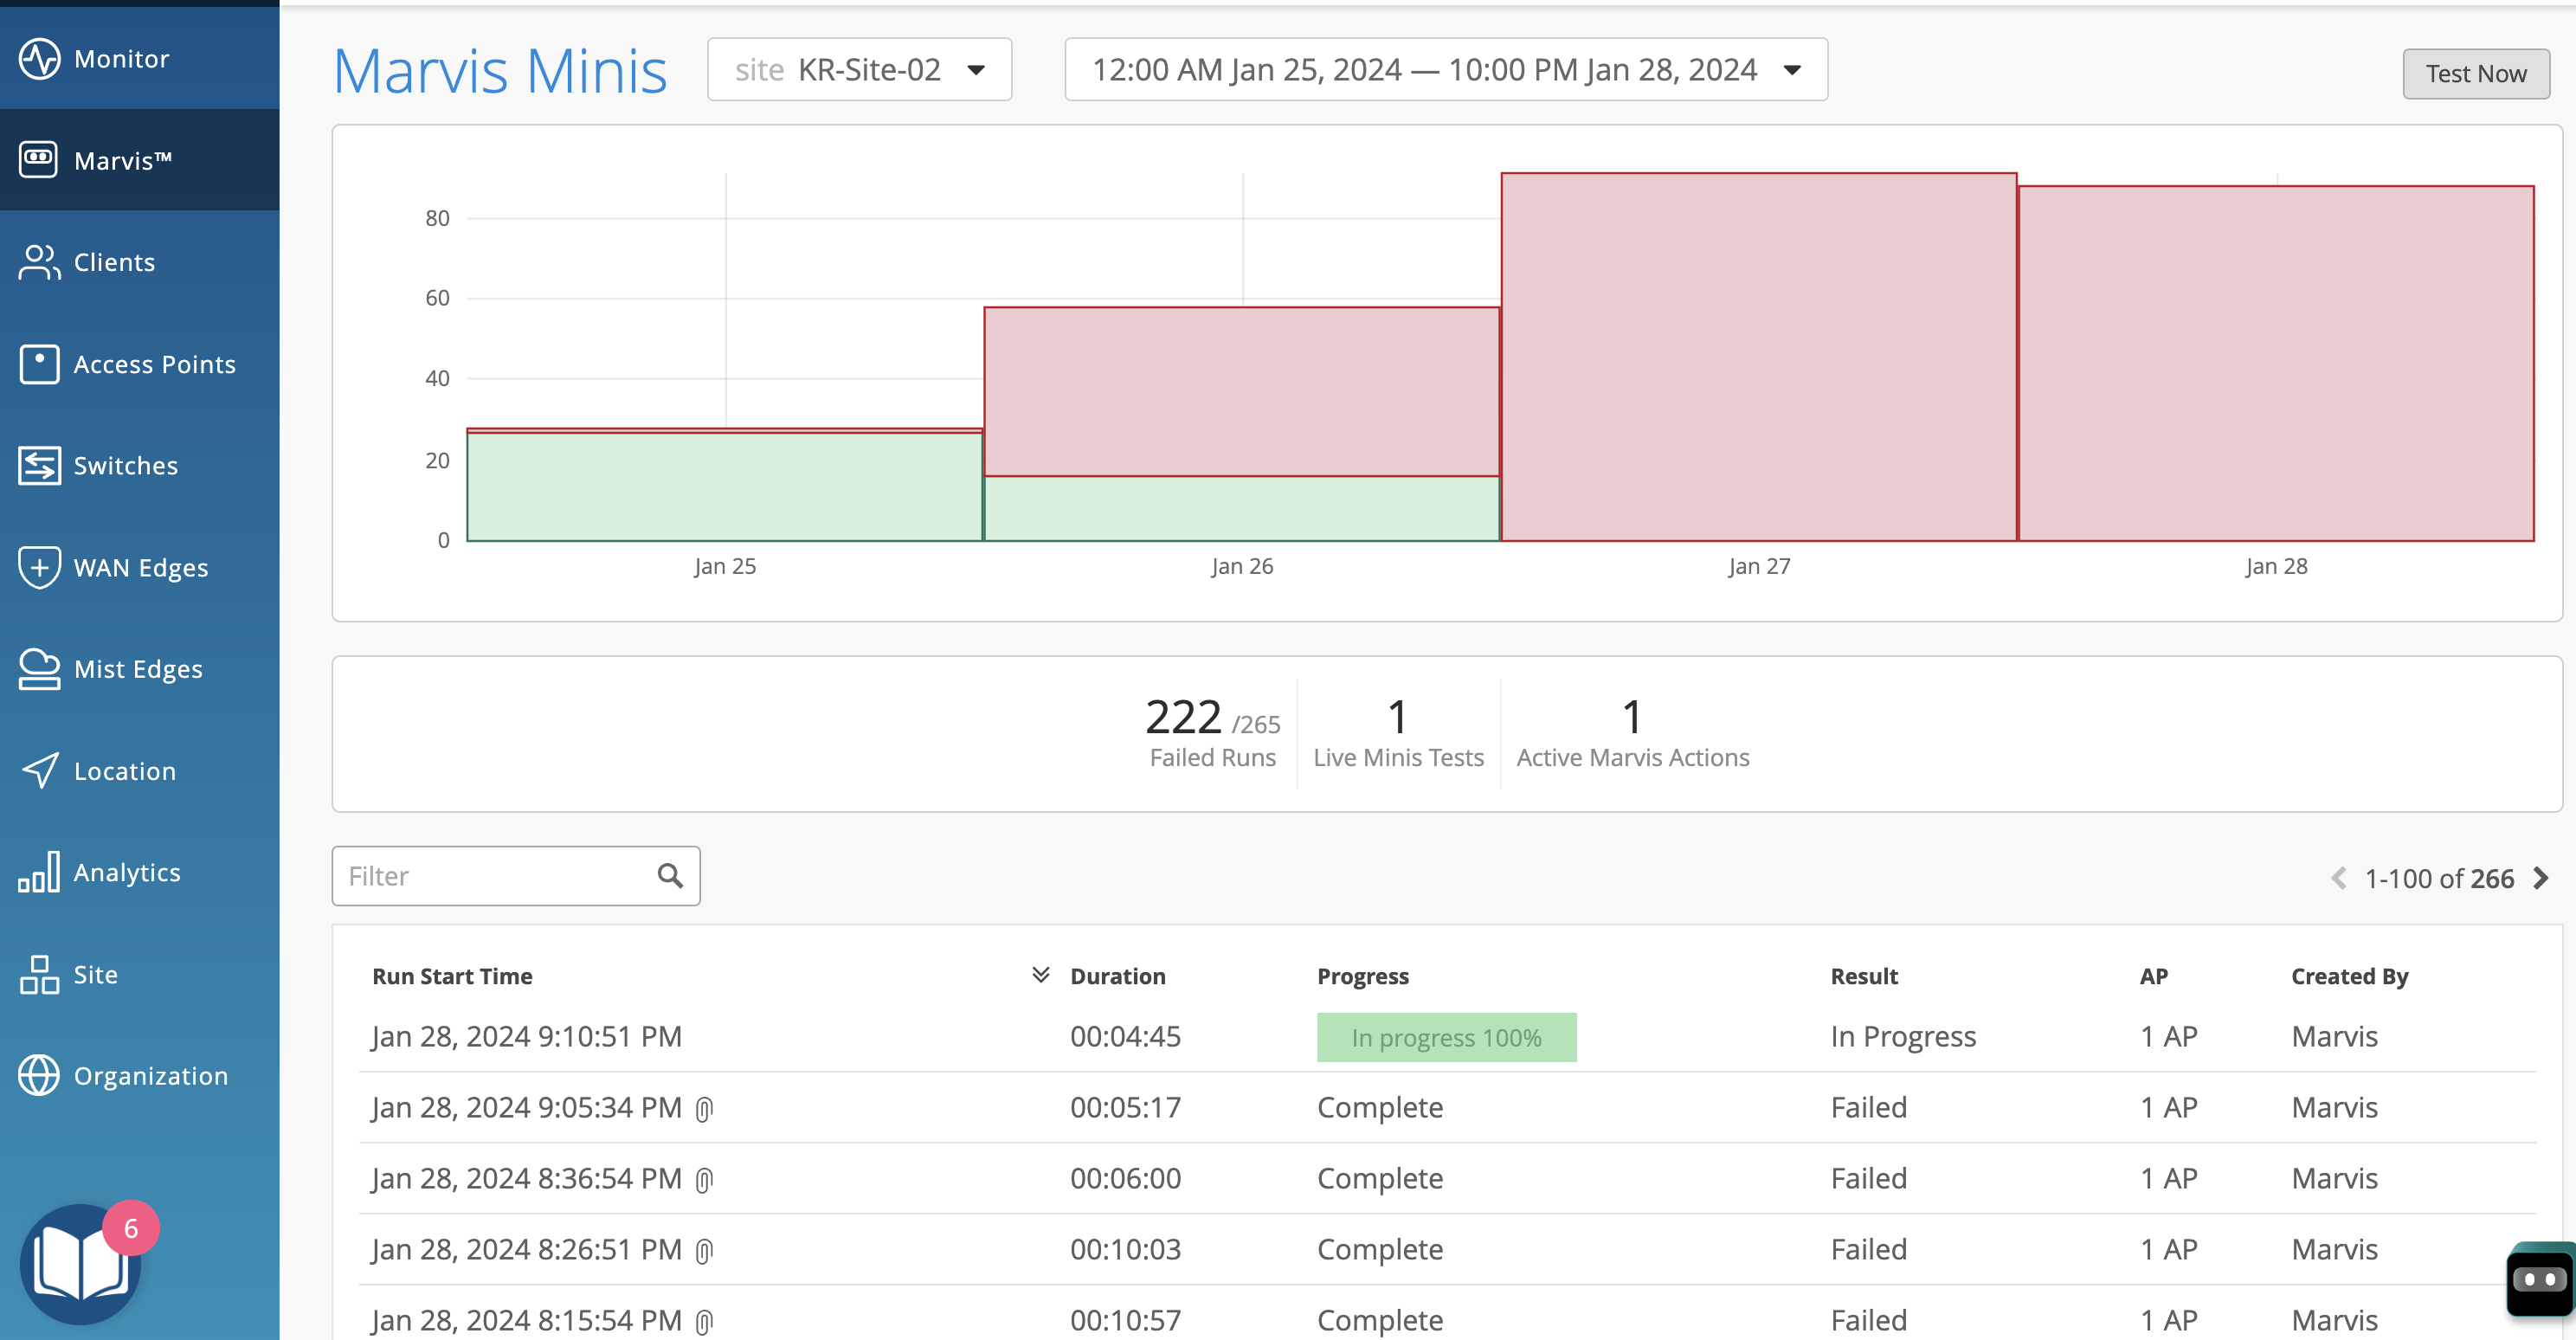
The Created By column indicates who initiated the validation:
-
Marvis—Indicates that Marvis initiated the validation automatically
-
User—Indicates that a user initiated the validation manually
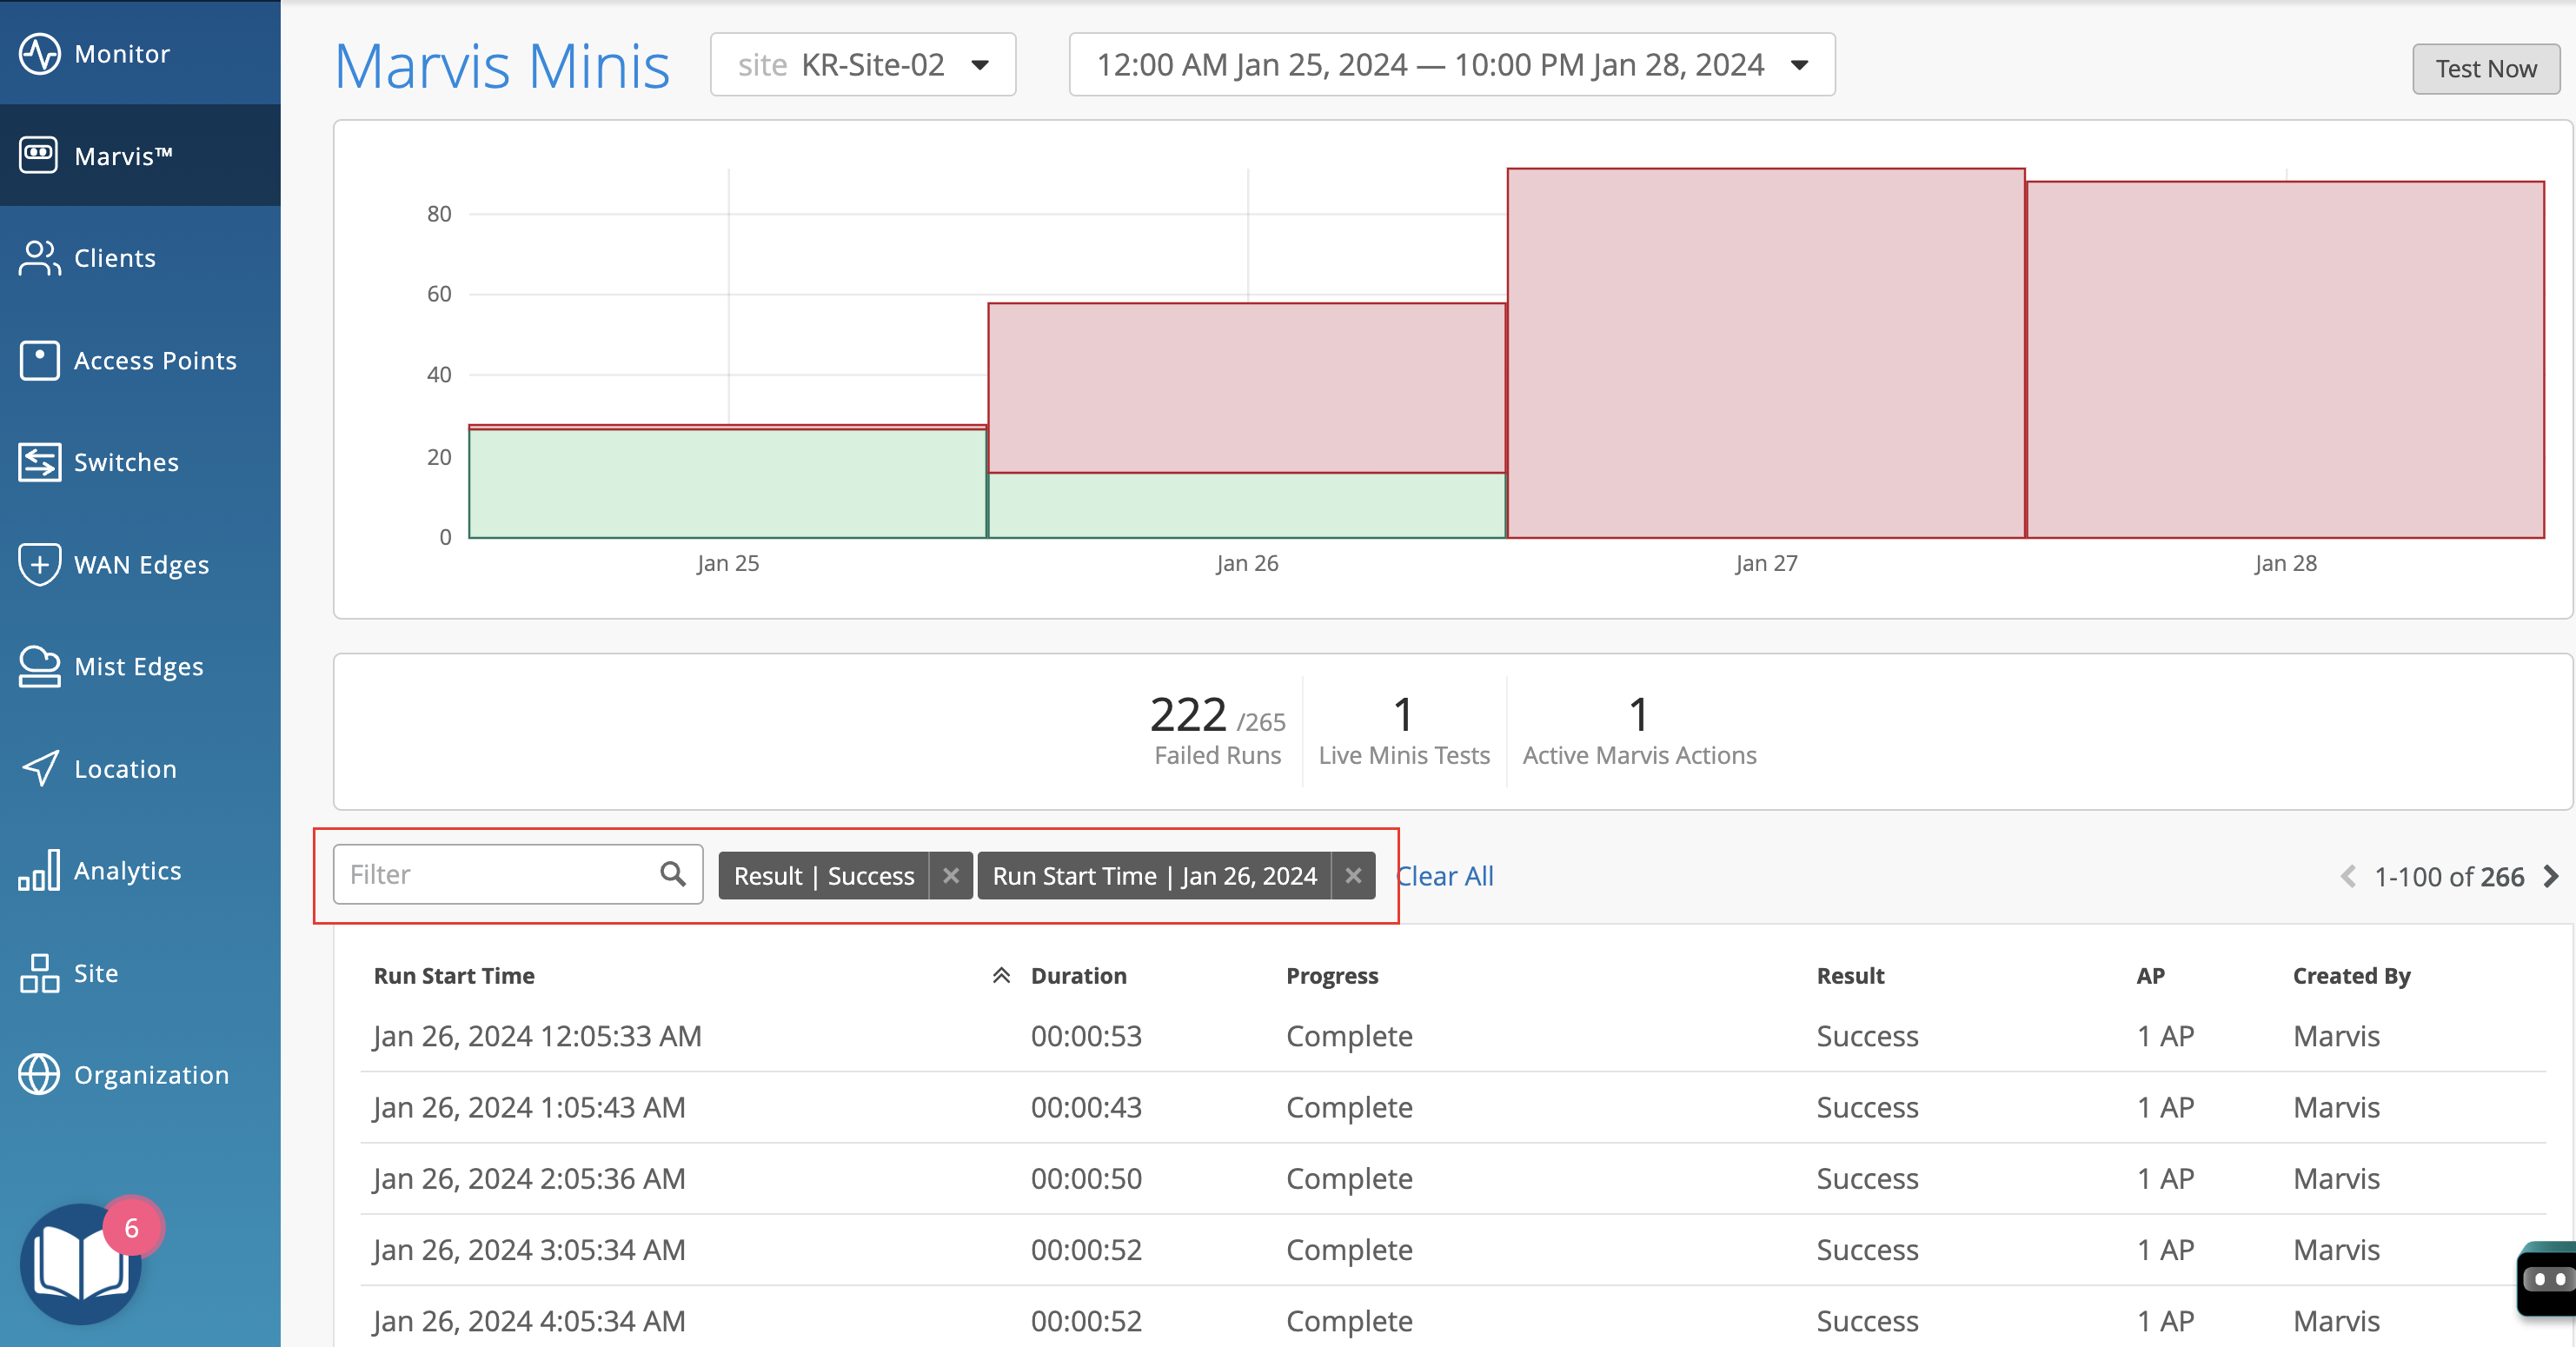
You can also use the Filter option to view specific validations. In the following example, we show you the filtered results for tests run on a specific date.
To view more information about each validation, click each row. You’ll see the details for a validation. The table lists all the APs at the site, the switch to which each AP is connected, VLANs, LLDP port information, and the status for DHCP, ARP, DNS, and application connectivity.
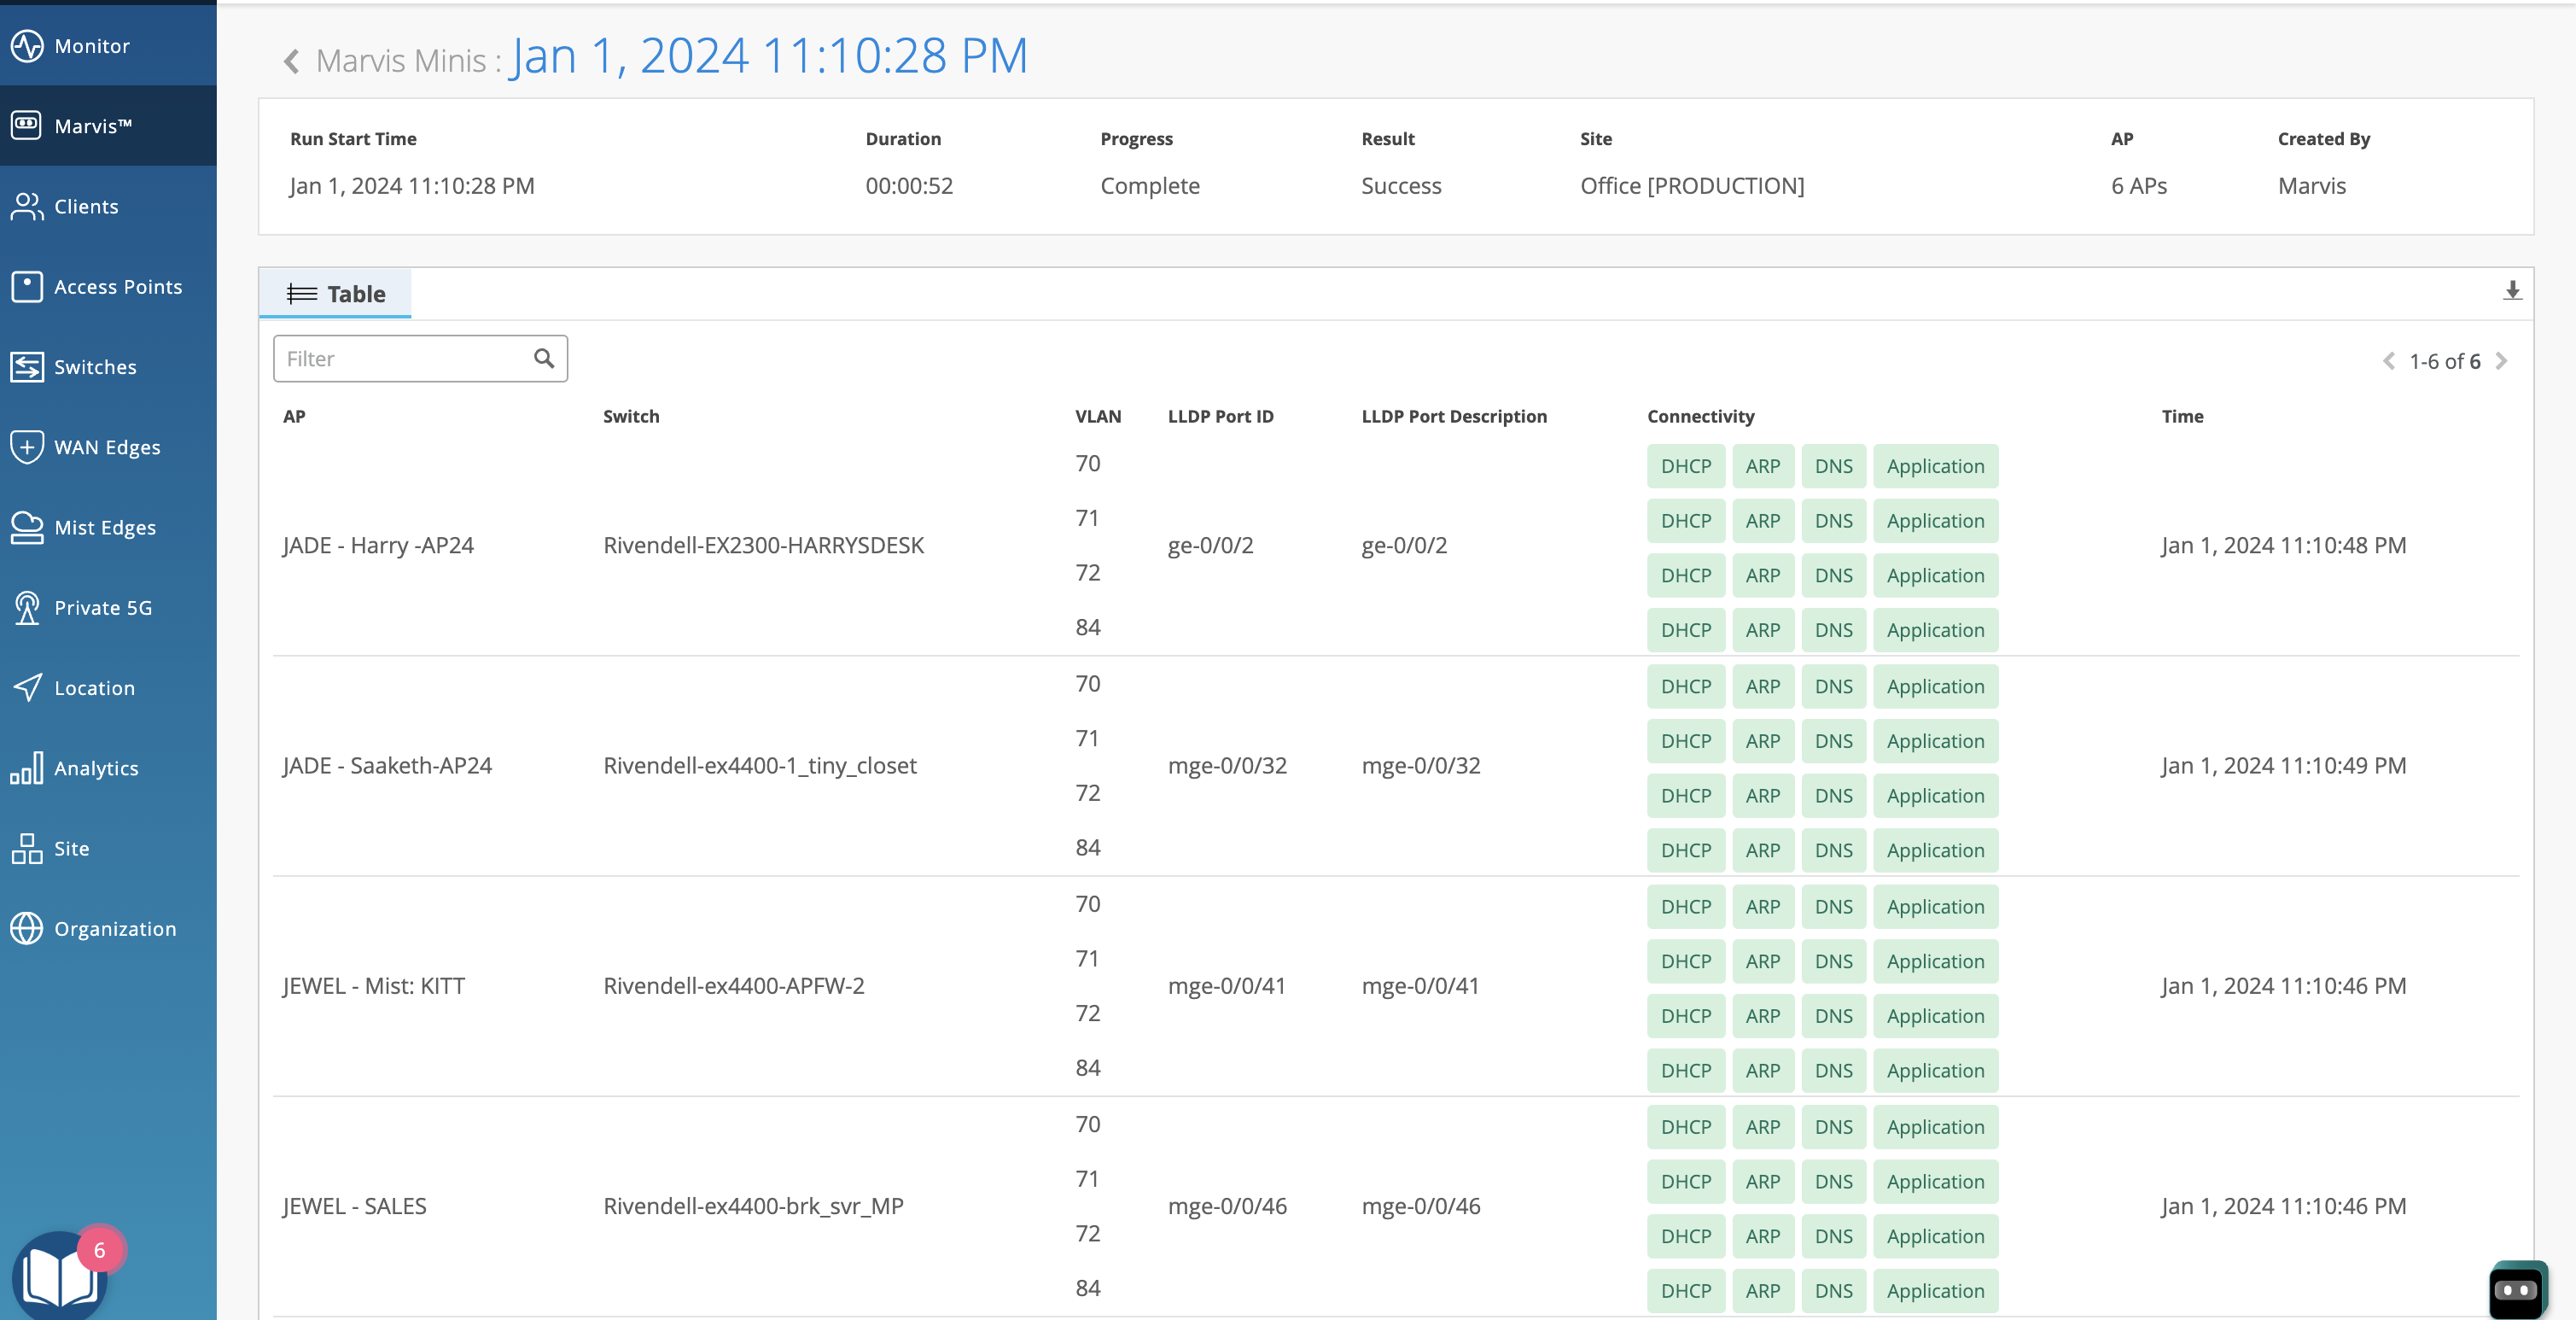
Site-Level Dashboard
Here's an example of the Marvis Minis page for a site. In this case, as it is a single site, you’ll see only the validations run on that site. You can click each row to view the details as described in the previous section.
Here's an example of a validation that detected an ARP failure on one of the APs.
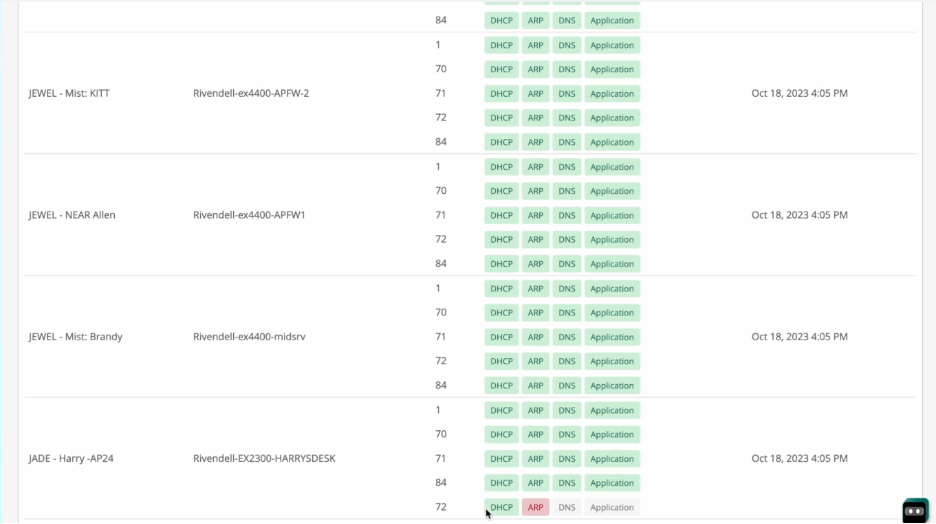
Marvis Minis retests each failure for confirmation. It also expands the scope to additional APs to identify whether the failure is limited to a specific VLAN, AP, or switch or whether it is a sitewide issue.