ON THIS PAGE
Wired SLEs
Use the wired service-level experience (SLE) dashboard to assess the service levels for user-impacting factors such as throughput, connectivity, and switch health.
Overview
Juniper Mist™ cloud continuously collects network telemetry data and uses machine learning (ML) to analyze the end-user experience. This service efficiently collects and analyzes data your entire network, whether you have hundreds or thousands of ports.
You can access this information through the Juniper Mist wired service-level expectation (SLE) dashboards, which help you assess the network's user experience and resolve any issues proactively. It's not merely a matter of devices or links being up or down—it's the quality of the client experience.
For the wired network, the two burning questions are:
-
Are clients able to connect?
-
Are clients able to pass traffic after connecting?
The wired SLE dashboards show the user experience of the wired clients on your network at any given point in time. You can use these interactive dashboards to measure and manage your network proactively by identifying any user pain points before they become too big of an issue.
- Finding the Wired SLEs Dashboard
- Root Cause Analysis for the Wired Successful Connect SLE
- Wired Assurance: Day 2 - Wired SLEs Video Overview
Finding the Wired SLEs Dashboard
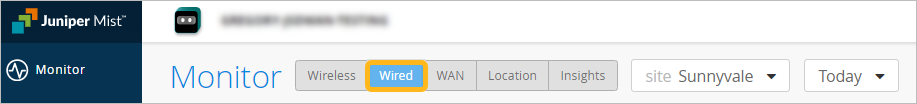
To find the Wired SLEs dashboard, select Monitor > Service Levels from the left menu, and then click the Wired button.
The buttons appear only if you have the required subscriptions. For information about these requirements, see the Juniper Mist AI-Native Operations Guide.
Root Cause Analysis for the Wired Successful Connect SLE
After you click a classifier in the SLE block, you'll see the Root Cause Analysis page. Click classifiers and sub-classifiers to view timeline and scope information in the lower half of the screen.
The information in the lower half of the screen depends on what you've selected at the top.
Useful tabs in the lower half of the screen are:
-
Timeline—See exactly when the issues occurred.
-
Distribution—See which VLANs were affected.
-
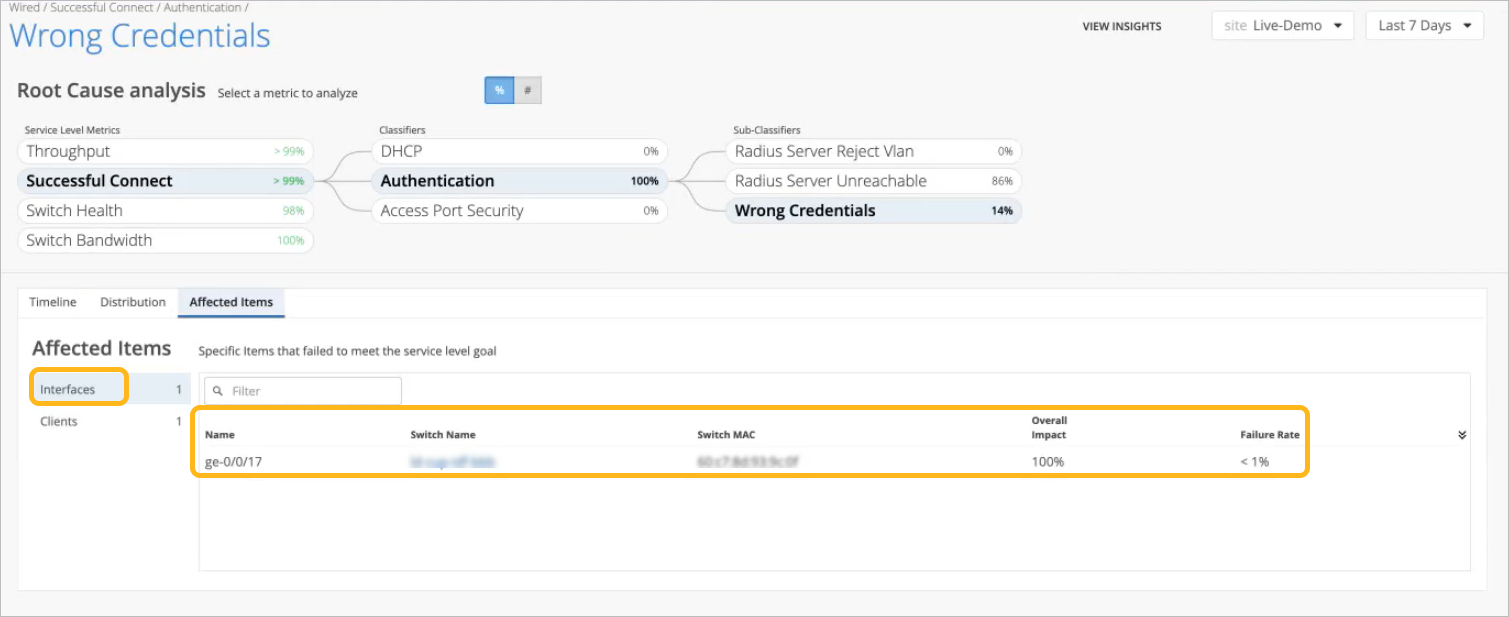
Affected Items—See which interfaces and clients were affected and how much each one contributed to the overall impact. Also see the individual failure rate for each interface or client.
Let's look at an example for the Successful Connect SLE. By clicking options at the top of the page, you can drill down from the SLE to classifiers and sub-classifiers. The lower half of the page shows information relevant to these selections.
By selecting the Affected Items tab and then clicking the Interfaces option on the left, we see the interfaces that were unable to connect due to incorrect credentials.
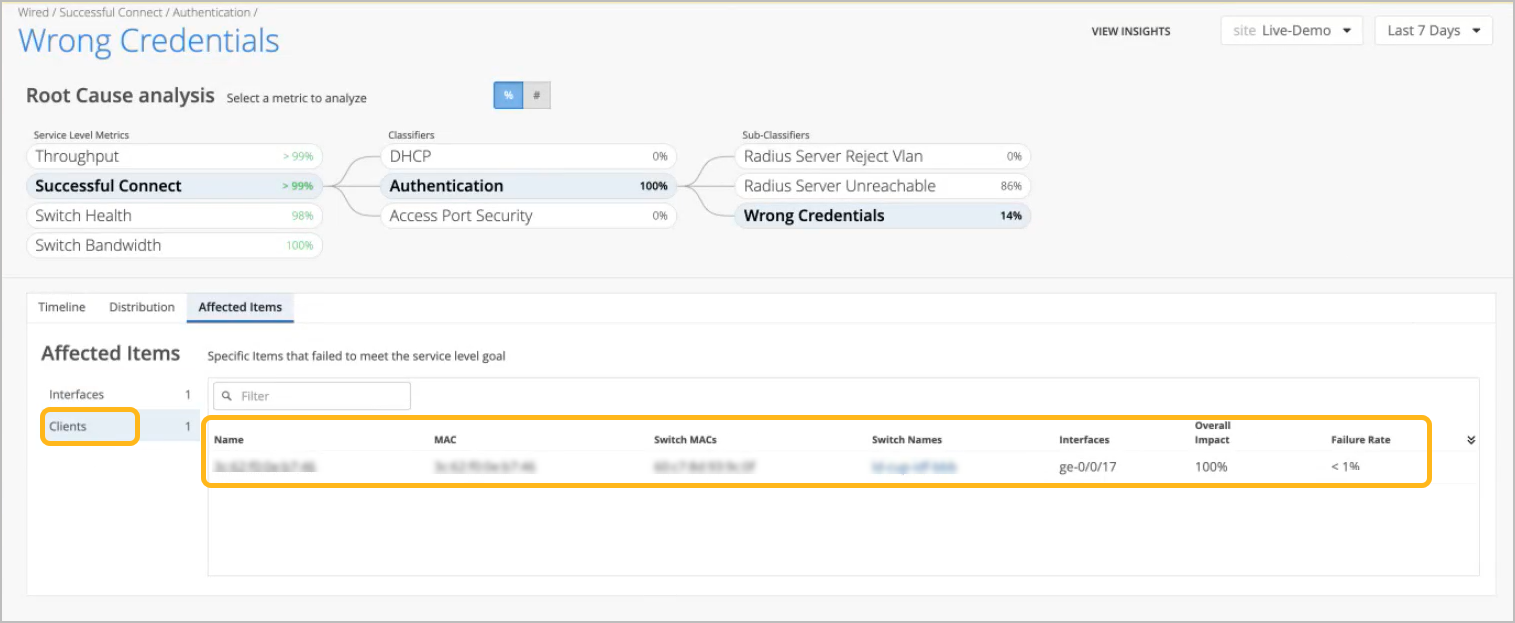
By clicking the Clients tab on the left, we now see the affected clients.
-
Overall Impact is the percentage that a client or interface contributed to all issues for the selected sub-classifier. For example, it can show if a client account for 20 percent or 90 percent of the issues.
-
Failure Rate is the impact of this issue on this interface or client. For example, it can show if an interface was unsuccessful on 20 percent or 90 percent of connection attempts.
-
To see more details, click the hyperlinks in the table to go to the Insights page, where you can see all client and switch events.
Wired Assurance: Day 2 - Wired SLEs Video Overview
One of the coolest features of Wired Assurance is the Service Level Expectations, or SLEs. SLEs were first introduced with Wi-Fi Assurance to help you understand the client experience. Now the SLE framework has been extended to Juniper EX switches.
You can see what the performance and experience for wired devices is, categorized into throughput, successful connect, and switch health. In the throughput SLE, there are classifiers, congestion, interface anomalies, storm control, etc. This is where you can drill down to get an accurate sense of what is going on in the network.
The distribution table breaks it down by clients, VLANs, interfaces, and switches. You can also sort by failure rate or biggest overall impact. Double-click into affected items by switches, VLANs, interfaces, and clients.
Going over to the switch health SLE, we immediately see there are CPU issues. The EX4300 shows the overall impact at 74%. The screen shows CPU utilization spiking over 100%, mapped to a time graph to help you narrow in on the issue.
Wired SLEs measure wired experience with pre and post-connection performance metrics to help you understand how the network experience is for your users, wired devices, and IoT endpoints.
Wired SLE Blocks
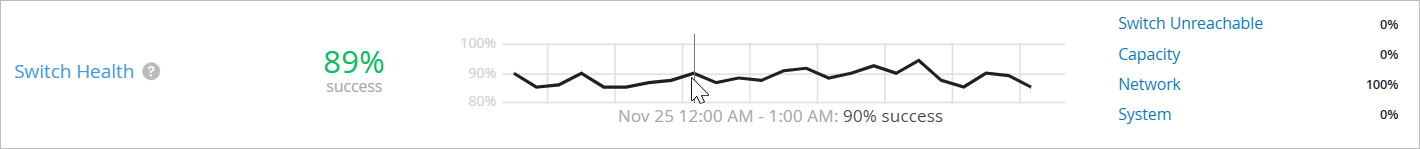
As shown in the following example, each SLE block provides valuable information.
-
At the left, you see that this SLE has an 89 percent success rate.
At the center, the timeline shows variations across the time period. You can hover your mouse pointer over any point to see the exact time and SLE outcome.
At the right, the classifiers show what percentage of issues were attributable to each root cause. In this example, 100 percent of the issues were attributed to Network.
If you click a classifier, you'll see more information on the Root Cause Analysis page. Most classifiers have sub-classifiers for greater insight into the exact causes of issues.
The following table provides more information about the wired SLEs and classifiers.
| SLE | SLE Description | Classifier | Classifier Description |
|---|---|---|---|
| Successful Connect |
Juniper Mist monitors client connection attempts and identifies failures. The source of data is 802.1X events on the switch. This SLE helps you to assess the impact of these failures and to identify the root causes to address. This SLE is available if you use 802.1X on the wired network to authenticate clients or if you have DHCP snooping configured. You cannot set the threshold for this SLE. It's assumed that you want 100 percent successful connects and consider any unsuccessful connect as a critical issue to track. |
DHCP |
Client connections that fail to reach the bound state within a minute. This classifier is available only when DHCP snooping is enabled in the port profile. DHCP snooping might not always work well with endpoints that have static IPs. |
| Authentication |
Events when a client failed to authenticate. Sub-Classifiers:
|
||
| Access Port Security |
Client connection failures caused by access port security issues. Based on the security features configured in your port profiles, this classifier is triggered as security events occur. Sub-Classifiers:
|
||
| Throughput |
This SLE represents the ability of wired users to pass traffic without impedance. You cannot set the threshold for this SLE. It's assumed that you want 100 percent of traffic to pass without impedance and consider any impedance as a critical issue to track. |
Storm Control |
Events when storm control level was exceeded and packets were dropped. Available only if you've enabled Storm Control in the port profile (recommended). |
| Interface Anomalies |
Events when devices were powered up but could not pass traffic. Sub-Classifiers:
|
||
| Switch Bandwidth |
Juniper Mist™ measures the available bandwidth on your network based on the queued packets and dropped packets for each configured queue. A pattern of low success rates can indicate a need for more wired bandwidth. You can click the Settings button to set the percentage to use as the success threshold for this SLE. This percentage represents the total_DropppedPackets as a portion of total_QueuedPackets. |
Congestion |
Heavy congestion causing dropped packets (TxDrops) when the input queue (buffer) fills up. Triggered by considering these ratios:
|
| Congestion Uplink |
High congestion on uplinks with these uplink port characteristics:
|
||
| Bandwidth Headroom |
High bandwidth usage. |
||
| Switch Health |
Juniper Mist™ monitors your switches' operating temperature, power consumption, CPU, and memory usage. Monitoring switch health is crucial because issues such as high CPU usage can directly impact connected clients. For example, if CPU utilization spikes to 100 percent, the connected APs might lose connectivity, affecting the clients' experience. |
Switch Unreachable |
Poor switch-to-cloud connectivity. The switch might be down, or the connection might be severed. |
| Capacity |
Usage exceeding 80 percent. High usage can indicate that the switch is dealing with more requests that it can optimally handle. Sub-Classifiers indicate usages exceeding 90 percent of the relevant table capacity:
|
||
| Network |
Lower than expected throughput due to uplink capacity limitations. Based on the round-trip time (RTT) value of packets sent from the switch to the Mist cloud. Sub-Classifiers:
|
||
| System |
Issues on the switch that can impact user experiences Sub-Classifiers:
|