ON THIS PAGE
Location SLEs
Use the Location Service Level Experiences (SLE) dashboard to assess the service levels for user-impacting factors such as SDK connection issues, latency, dropped requests, access point health, and more.
Overview
Finding the Location SLEs Dashboard
To find the Location SLEs dashboard, select Monitor > Service Levels from the left menu of the Juniper Mist™ portal, and then click the Location button.
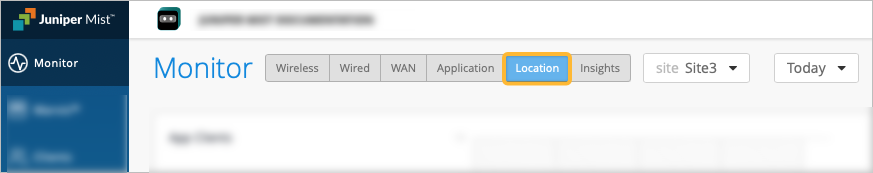
Your subscriptions determine which buttons appear.
Success Threshold Settings
You can adjust the thresholds that determine success or failure. To do so, click the Settings button at the right top corner of the location SLEs section. In the settings window, follow the on-screen instructions to set each threshold.
Location SLE Blocks
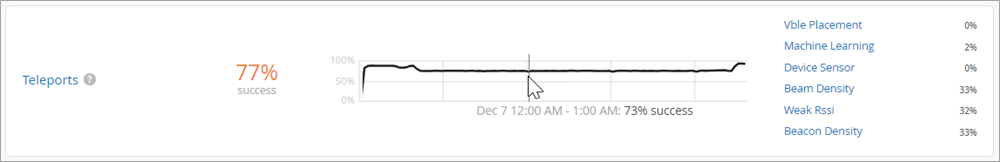
As shown in the following example, each SLE block provides valuable information.
-
At the left, you see that this SLE has a 77 percent success rate. If you select the Value filter button, you'll see a number instead.
At the center, the timeline shows variations across the time period. You can hover your mouse pointer over any point to see the exact time and SLE outcome.
At the right, the classifiers show the percentage of the issues that were attributed to each root cause. In this example, the issues were almost evenly distributed among Beam Density (33 percent of the issues), Beacon Density (33 percent), and Weak RSSI (32 percent). Another 2 percent of issues were attributed to Machine Learning.
-
If you click a classifier, you'll see more information on the Root Cause Analysis page. Most classifiers have sub-classifiers for greater insight into the exact causes. The Root Cause Analysis page also provides additional details about the scope and impact of the issues. For all location SLEs, the Root Cause Analysis page includes a Location tab, where you can see exactly where the issues occurred on your floor plans.
See the following table for more information about the location SLEs and classifiers.
| SLEs | SLE Descriptions | Classifiers | Classifier Descriptions |
|---|---|---|---|
| SDK Connect Time |
Juniper Mist measures the time when your SDK-enabled app clients are connected to location services at your site. |
User Usage |
Incidents when the client connection time was below the threshold. For example, if you set the threshold to 60 seconds (by clicking the Settings button), then this classifier is triggered when a client is connected for less than a minute. |
| Latency |
Juniper Mist measures the latency of location responses and estimates to app clients. |
Cellular |
Latency on a cellular data connection |
| WiFi |
Latency on a wireless connection |
||
| No Reported Connection Type | Latency with unknown connection type | ||
| Teleports |
Juniper Mist identifies instances when the app client's estimated location veers away (or "teleports") from the actual location. For example, if you set 3 meters as the service target, this SLE is triggered when the actual location is more than 3 meters from the estimated location. |
Beacon Density |
The app client detected a low number of beacons from the access points (APs). |
| Beam Density |
The app client detected a low number of beams. |
||
| Machine Learning |
—Changes in machine learning affected location accuracy. |
||
| vBLE Placement |
The placement of the APs affected location accuracy. Sub-Classifiers:
|
||
| Dropped Requests |
Juniper Mist monitors the instances when dropped location requests reduced location accuracy. The Pending Requests classifier uses the threshold that you set with the Settings button. The other classifiers act on a pass/fail basing, counting any incidents that result in dropped requests. |
Reconnects |
Reconnection attempts made after losing Internet connectivity |
| Offline |
App offline due to issues such as Wi-Fi reception, poor cellular reception, connectivity problems, or user actions (for example, switching to airplane mode) |
||
| Not Uniform Requests |
Inconsistent speeds when sending location requests The app relies on uniform requests for location accuracy. |
||
| Dropped by Network |
Network issues causing dropped requests |
||
| Client Request Timeout |
Client timeouts causing dropped requests |
||
| Cellular |
Dropped requests while using a cellular data connection |
||
| WiFi | Dropped requests while using a Wi-Fi connection | ||
| Pending Requests |
Excess requests above the configured SLE threshold A high number of pending requests is used as an indicator that future requests are likely to be dropped. |
||
| AP Health |
Juniper Mist counts the incidents when APs rebooted or lost connectivity to the cloud. |
Low Power |
Insufficient power for location features |
| AP Disconnected |
Disconnected from cloud due to issues such as site down, switch down, AP reboot, or AP unreachable |
||
| Ethernet |
Ethernet errors or speed mismatch |
||
| Network |
Issues such as tunnel down, latency, or jitter |