Explore J-Web
J-Web: A First Look
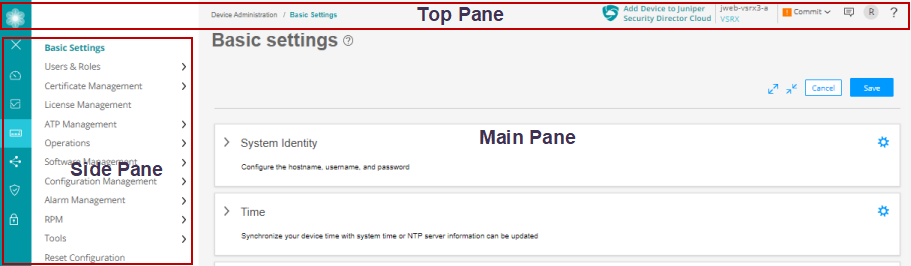
Each page of the J-Web interface is divided into the following panes (see Figure 1):
Use Feature Explorer to confirm platform and release support for specific features.
-
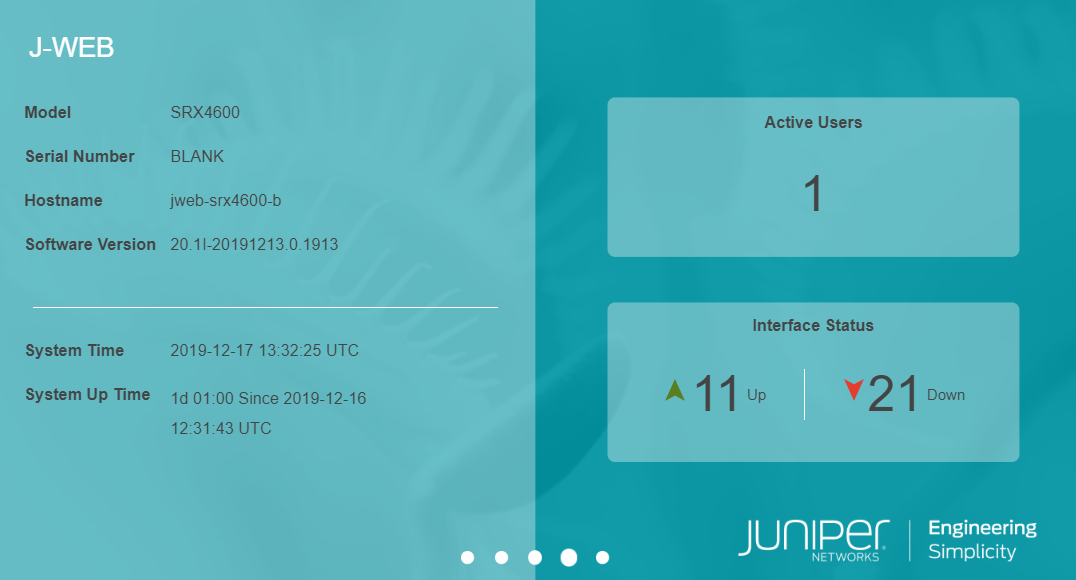
Launch pad—Displays high level details of the system identification, active users, and interface status. See Figure 2.
-
Top pane—Displays identifying information and links.
-
Side pane—Displays subtasks of the Dashboard, Monitor, Device Administration, Network, Security Policies and Objects, and Security Services tasks currently displayed in the main pane. Click an item to access it in the main pane.
-
Main pane—Location where you monitor, configure, view or generate reports, and administrate the Juniper Networks device by entering information in text boxes, making selections, and clicking buttons.
J-Web Launch Pad
After you successfully login to J-Web GUI, J-Web launch pad appears.
The launch pad provides a quick view of:
Device information such as model number, serial number, hostname, software version, system time, and system up time.
Number of active users using the device.
State of the device physical interfaces: Up or Down.
The launch pad closes automatically once the application is loaded in the background. You do not have the option to manually close or refresh the launch pad.
Launch pad is not displayed in the factory default settings.
Launch pad is displayed for all users.
Figure 2 shows the launch pad screen and its elements.
J-Web Top Pane
For a more personal, helpful, and user experience, Juniper Networks has provided some aids within the J-Web GUI. Table 1 provides the details of the J-Web top pane elements.
Element |
Description |
|---|---|
|
Banner 
|
Location—The gray bar at the top of the screen. You can access device details, feedback button, commit options, a profile management access menu, and a help button. |
|
Add Device to Juniper Security Cloud 
|
Location—To the upper-right corner of the banner. |
|
Device details 
|
Location—To the right of the Add Device to Juniper Security Director Cloud icon. Provides details of the device you have accessed. |
|
Commit Configuration Menu 
|
Location—To the right of the device details icon. Provides options to:
|
|
Feedback Button 
|
Location—To the right of the Commit menu. You can provide feedback (mailto:jweb-feedback@juniper.net) if you are having an issue with the product. |
|
User Functions Menu 
|
Location—To the right of the Feedback icon. A head-and-shoulders icon and a field showing the logged in user type. Clicking your username or the down arrow button, logs you out of J-Web interface. |
|
Help Button 
|
Location—To the right of the User Functions menu. Access to the online Help center and the Getting Started Guide are available by clicking the right-most icon on the banner, shaped like a question mark. The help center includes access to a list of supported web browsers, user interface assistance, as well as links to technical support and full J-Web documentation. |
|
Mode 
|
Location—To the right of the device details. Provides the setup mode details whether your device is in the standard, chassis cluster (HA), or passive mode. |
|
Tenant & LSYS 
|
Location—To the right of the Feedback icon. Note:
This menu is only available for root-logical-system context and devices that support tenant and logical system. Starting in Junos OS 23.1R1 Release, you can view the name and number of available tenant or logical system. For example, Tenant (5). Select the name from the list to enter a root-logical-system user as a tenant or logical system. Use the search box to enter as a specific tenant or logical system, To go back to the root-logical-system user context, click the down arrow on the selected tenant or logical system menu and choose Exit Tenant or Exit Logical System respectively. Note:
Once the configuration cache synchronizes, the updated tenant or logical system data will be shown. If no tenant or logical system data is available, go to Device Administration > Multi Tenancy and create a new tenant or logical system from the respective menus. |
J-Web Side Pane
J-Web presents you a security-focused administrator with a tabbed interface.
The following tabs across the side pane of the J-Web GUI provide workspaces in which an administrator can perform specific tasks:
Dashboard—The Dashboard is the main page for J-Web. You can customize the workspace in your Dashboard by adding widgets from the carousel. The placement of, and settings within, widgets are saved so that anything from device information to firewall event information or from top blocked viruses to live threat maps can be unique for each user. Once you decide on the widgets that you want to see, you can minimize the carousel to regain some screen space.
Note:By default, the selected widgets are displayed every time you login to J-Web.
Figure 3 shows an example of the J-Web Dashboard tab.
Figure 3: J-Web Dashboard Tab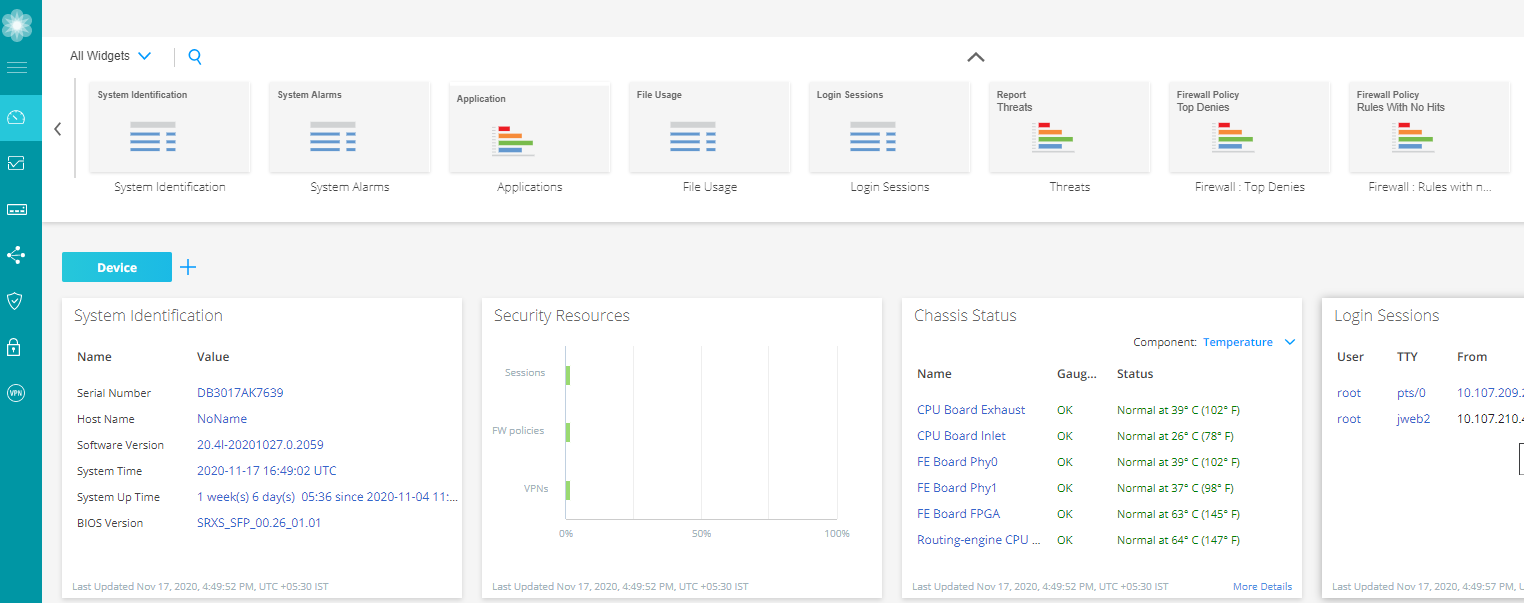
Monitor—The Monitor tab provides a workspace in which graphical representations of network traffic, firewall events, live threats, and network user data are available. There is also detailed data for alerts and alarms information. In this workspace, you can review the detailed information needed to understand what is happening to the managed security devices and traffic in your network.
Figure 4 shows an example of the J-Web Monitor tab.
Figure 4: J-Web Monitor Tab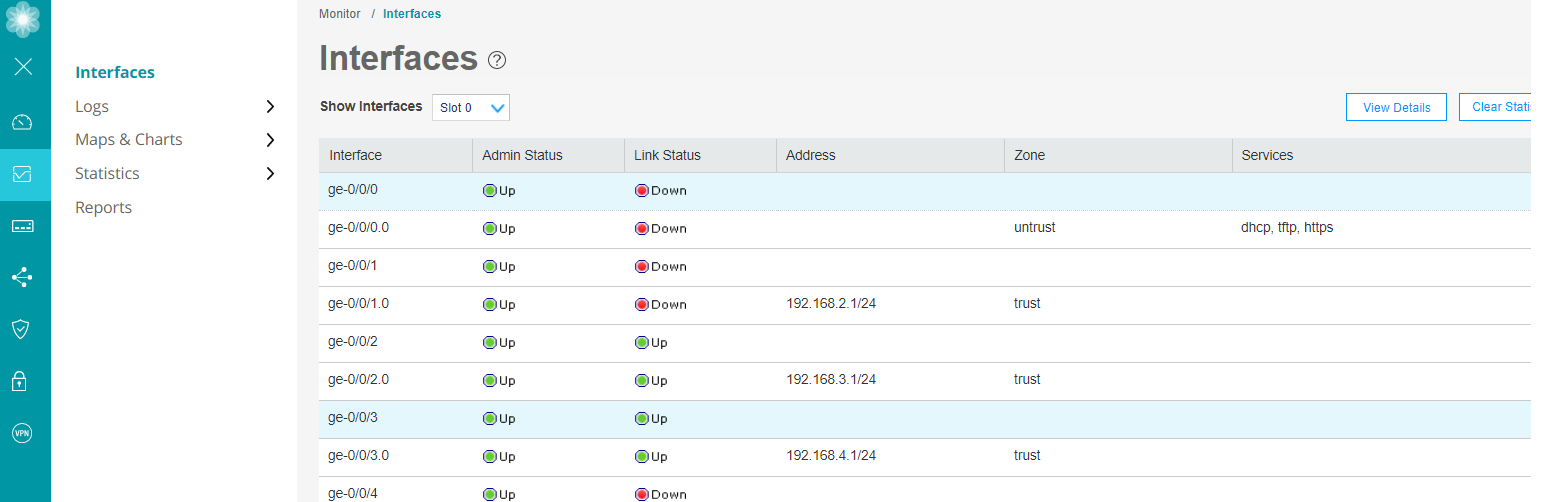
Configure—The highlighted workspace in Figure 5 is where all of the SRX Series Firewall configuration happens. You can configure the following features for managing your network security:
-
Device Administration—Such as basic settings, user management, certificate management, license management, security package management, ATP management, operations, software management, configuration management, alarm management, RPM, tools, and reset configuration.
-
Network—Such as connectivity, DHCP, firewall filters, NAT, routing, Class of Services (CoS), Application QoS, IPsec VPN, and dynamic VPN.
-
Shared Objects and Identity—Starting in Junos OS Release 25.2R1, the Security Policies & Objects and Security Services menus are combined and renamed as Shared Objects and Identity. Using this, you can access zones/screens, global addresses, access profiles, address pools, and services.
Figure 5 shows an example of the J-Web configuration menus.
Figure 5: J-Web Configure Menus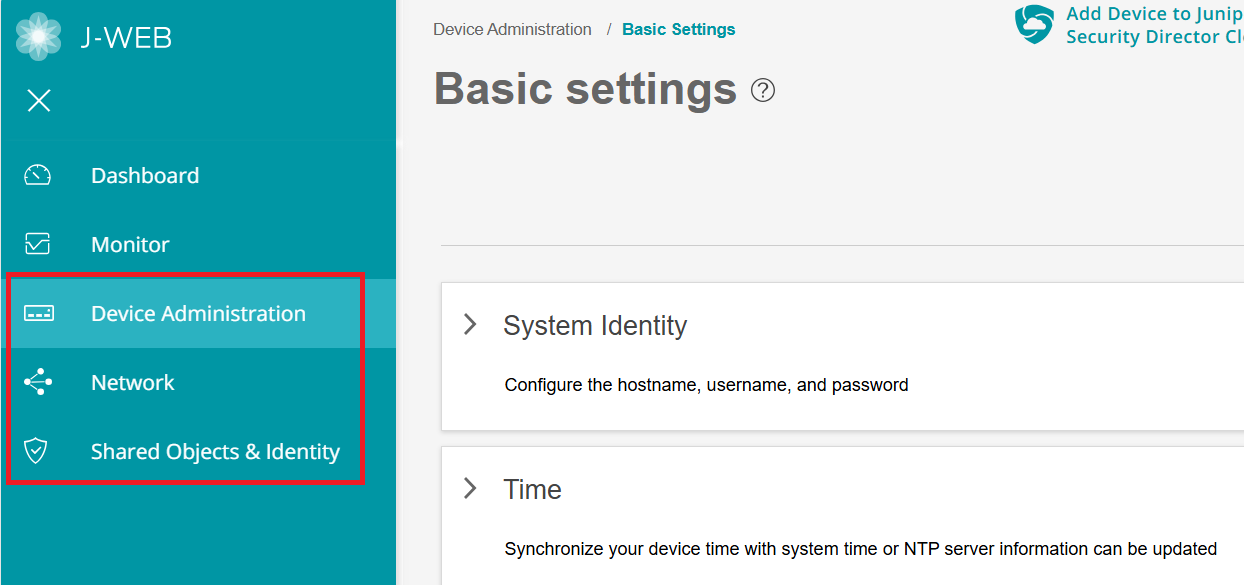
-
J-Web Main Pane
The main workspace of J-Web takes up the remainder of the browser window just below the Banner and next to the side pane. Table 2 shows a sample of navigation, customization, and help icons in the main pane of the J-Web GUI.
Element |
Description |
|---|---|
Breadcrumbs  |
Location—Upper left part of main screen. Not visible on the Dashboard. Trace your location in the GUI. The breadcrumbs provide a path back to one of the five tabs: Dashboard, Monitor, Configure, Reports, and Administration. |
Info Tips  |
Location—Various places around the GUI. Hover your mouse over any available question mark icon for quick pop-up guidance. |
Show/Hide Columns  |
Location—Upper right corner of some tabular display windows such as the Address Pools tab, Rules tab, and so on. In tabular displays, you can choose which columns are visible by clicking the icon and then selecting the check boxes on the menu. |
Table Search  |
Location—Upper right corner of tabular views. You can click the magnifying glass icon, within large tabular views, to search for specific text within any of the visible fields in the display. |
Item Selector Search 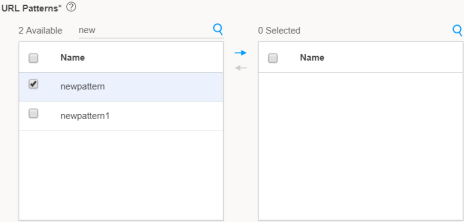 |
Location—Within the fields. You can use a search text box to select items for inclusion in a rule or policy. |
Advanced Search  |
Location—Above the table grid. The search includes the logical operators as part of the filter string. In the search text box, when you hover over the icon, it displays an example filter condition. When you start entering the search string, the icon indicates whether the filter string is valid or not. Note:
Press Spacebar to add an AND operator or OR operator to the search string. Press backspace at any point of time while entering a search criteria, only one character is deleted. |
Filter  |
Location—Upper right corner of tabular views. You can click the filter icon to select any value from a list for category and subcategory columns. The grid is reloaded with the filtered category and subcategory. |
Success message  |
Location—At the top of the main pane. A message is displayed with this icon to state that your task is successful. |
Information message  |
Location—At the top of the main pane. A message is displayed with this icon to state you have some pending actions, but you can continue with the task. |
Alert message  |
Location—At the top of the main pane. A message is displayed with this icon to state you have some pending actions which you must complete to proceed with the required task. |
Warning message  |
Location—At the top of the main pane. A message is displayed with this icon to state you have some pending actions which you must complete else you cannot proceed with the required task. |
J-Web Workflow Wizards
J-Web contains assisting workflow wizards that guide you through some of its security functions. These include Setup wizard, Chassis Cluster wizard, PPPoE wizard, and NAT wizard. These wizards help you with a guided setup and helps you in performing step-by-step configuration of a services gateway that can securely pass traffic.
PPPoE and NAT Wizards are available only in the SRX300 line of Firewalls.
Summary
J-Web is a GUI approach that aims to provide a graphical framework to help you visualize and manage your SRX Series Firewalls more easily.